

Abstract
To maintain genome integrity, eukaryotic cells initiate DNA replication once per cell cycle after assembling prereplicative complexes (preRCs) on chromatin at the end of mitosis and during G1. In S phase, preRCs are disassembled, precluding initiation of another round of replication. Cdt1 is a key member of the preRC and its correct regulation via proteolysis and by its inhibitor Geminin is essential to prevent premature re-replication. Using quantitative fluorescence microscopy, we study the interactions of Cdt1 with chromatin and Geminin in living cells. We find that Cdt1 exhibits dynamic interactions with chromatin throughout G1 phase and that the protein domains responsible for chromatin and Geminin interactions are separable. Contrary to existing in vitro data, we show that Cdt1 simultaneously binds Geminin and chromatin in vivo, thereby recruiting Geminin onto chromatin. We propose that dynamic Cdt1–chromatin associations and the recruitment of Geminin to chromatin provide spatio-temporal control of the licensing process.
Keywords: Cdt1, fluorescence lifetime imaging microscopy (FLIM), fluorescence recovery after photobleaching (FRAP), Geminin, licensing
Introduction
DNA replication in eukaryotic cells initiates from hundreds of origins of replication on chromatin to ensure that the complete genome will be duplicated during S phase. Since the genome must be replicated only once per S phase, this requires a tight coordination in both time and space to ensure that the right origins are used at the correct point in time. To achieve this, the processes of origin selection and of initiation of DNA replication from these origins are separated. At the end of mitosis and during G1 phase, the licensing process specifies the origins of replication that will be used during the following S phase by the formation of a multi–protein complex on specific chromatin sites, the prereplicative complex (preRC) (Diffley, 2004; Blow and Dutta, 2005). During S phase, a major protein rearrangement on origins of replication occurs, leading to the recruitment of the DNA synthesis machinery and the concomitant inactivation of the preRC. This mechanism ensures that once DNA synthesis is initiated from a particular origin, re-initiation of DNA replication is prevented until the next G1 phase (Diffley, 2004). In this way, the eukaryotic cell achieves a high level of control of DNA replication.
The first level of control is achieved by tight regulation of the licensing process. In particular, licensing involves the stepwise formation of the preRC on the potential origins of replication, which in the final step leads to the recruitment of the mini-chromosome maintenance (MCM) proteins, believed to function as replicative helicases (Aparicio et al, 1997; Ishimi, 1997), onto these sites. The assembly of the preRC requires the presence of the origin recognition complex (ORC) proteins onto the potential origins of replication and the recruitment of the Cdc6 and Cdt1 proteins, which then act as loading factors for the MCM proteins (Bell and Dutta, 2002; Nishitani and Lygerou, 2002). Licensing is considered complete when the MCM complex is loaded onto chromatin. At the onset of S phase, MCM proteins are activated resulting in origin unwinding and recruitment of the DNA polymerase machinery. It is believed that MCM proteins travel along with the replication fork (Aparicio et al, 1997) while bringing the origins to an unlicensed state.
Licensing must be temporally limited only to G1 phase. It has been proposed that Cdt1 is crucial for determining when licensing occurs in mammals as it is strictly regulated to be present only in G1 phase (Wohlschlegel et al, 2000; Nishitani et al, 2001). Indeed, overexpression of Cdt1 alone in mammalian cells is sufficient to induce re-replication (Vaziri et al, 2003), demonstrating the importance of a tight control over Cdt1. This tight temporal control of Cdt1 is achieved by two different means: through ubiquitin-dependent proteolysis at the onset of S phase (Li et al, 2003; Nishitani et al, 2004), and through the presence of its inhibitor Geminin (McGarry and Kirschner, 1998). In particular, Cdt1 is ubiquitinated by two distinct E3 ubiquitin ligases, SCF-Skp2 and DDB1-Cul4, leading to degradation in S phase (Nishitani et al, 2006). It has been reported that PCNA binds to Cdt1 and this interaction is essential for DDB1-Cul4-mediated proteolysis during S phase (Arias and Walter, 2006; Senga et al, 2006). This pathway is also activated upon DNA damage leading to rapid proteolysis of Cdt1 (Higa et al, 2003; Hu et al, 2004; Kondo et al, 2004) highlighting the importance of the tight control of Cdt1. Geminin, a main inhibitor of Cdt1, provides the second mechanism that ensures that Cdt1 activity will be limited to G1 phase (Wohlschlegel et al, 2000; Tada et al, 2001). The importance of Geminin has been verified through depletion experiments that led to over-replication of the genome (Melixetian et al, 2004; Zhu et al, 2004). Geminin is absent in G1 phase when Cdt1 is present and accumulates in S and G2 phases (McGarry and Kirschner, 1998). On the basis of in vitro data, Geminin inhibits the ability of Cdt1 to bind MCM proteins as well as the non-specific DNA sequence binding activity of Cdt1 (Yanagi et al, 2002; Lee et al, 2004), suggesting that expression of Geminin during G1 could sequester Cdt1 from chromatin. In contrast, in a Xenopus licensing system, cooperative interactions of Cdt1 and Geminin with chromatin have been reported (Gillespie et al, 2001). Therefore, how Cdt1–Geminin interactions inhibit the process of licensing in vivo has remained unclear.
To elucidate the role of Cdt1 in licensing and to clarify the mechanism of licensing inhibition by Geminin in vivo, we studied the interactions of Cdt1 with chromatin and Geminin in the living cell. We found that Cdt1 dynamically associates with chromatin throughout G1 phase and that Cdt1 can simultaneously interact with both chromatin and Geminin leading to Geminin recruitment onto chromatin.
Results
Analysis of Cdt1GFP during the cell cycle
To study the interactions of Cdt1 with chromatin and with its inhibitor Geminin in living human cells, Cdt1 was fused to green fluorescent protein (GFP) at its N (GFPCdt1) or C terminus (Cdt1GFP). Whereas Cdt1GFP had the same localization and cell cycle regulation as the endogenous protein following transient transfections in MCF7 cells, GFPCdt1 failed to exhibit nucleolar accumulation and a correct cell cycle expression pattern (data not shown). MCF7 cell lines stably expressing Cdt1GFP were therefore generated. A cell line expressing Cdt1GFP to physiological levels was chosen for further experiments (Figure 1A). In this cell line, Cdt1GFP adopts the same localization as endogenous Cdt1 (Nishitani et al, 2001), localizing to the nucleus and exhibiting a strong nucleolar staining (Figure 1B). Previous experiments have shown that endogenous Cdt1 is strictly regulated to be present only in G1 phase, whereas over-expression of Cdt1 leads to replication defects in different cell lines (Vaziri et al, 2003), including MCF7 cells (our unpublished observations). We therefore wished to ensure that Cdt1GFP was correctly regulated in the stably expressing cell line chosen, and did not interfere with normal cell cycle progression. Fluorescence-activated cell sorting (FACS) analysis showed that the stable Cdt1GFP cell line exhibited no defects in cell cycle progression, and that all the Cdt1GFP positive cells have G1 DNA content (data not shown). In addition, no increase in γ-H2AX staining, indicative of replication defects, was detected (data not shown). Moreover, immunofluorescence experiments showed that Cdt1GFP-positive cells are negative for staining of cyclin A, a marker of S and G2 phases, indicating that Cdt1GFP is present only during G1 phase and is, therefore, subject to the same regulation as the endogenous protein (Figure 1C). To verify the correct functionality of the stable Cdt1GFP cell line, we performed chromatin association assays in synchronized cell populations, which showed that Cdt1GFP binds and accumulates on a chromatin-enriched fraction with kinetics similar to endogenous Cdt1 (Figure 1D). To characterize further the stable cell line and to obtain more information about the behavior of Cdt1 in living cells, we performed time-lapse analysis. Cdt1GFP appears during mitosis and accumulates in the nucleus of cells progressing through G1 (Figure 1E). This is consistent with the behavior of the endogenous protein that has low expression in mitotic cells compared to cells in G1 phase (data not shown). Interestingly, Cdt1GFP starts to accumulate in the nucleoli from mid-G1 phase (data not shown). As cells proceed into S phase, Cdt1GFP is rapidly degraded (Figure 1E). Our data show that the fusion protein Cdt1GFP accurately mimics the behavior of Cdt1 enabling its use for detailed assessment of the temporal and spatial regulation of the endogenous molecule.
Figure 1.
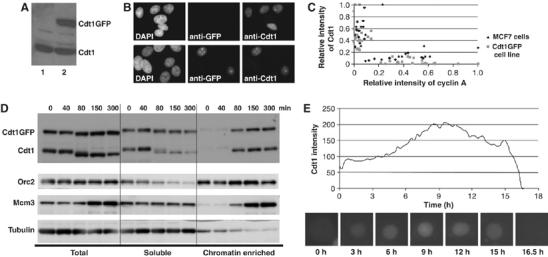
Characterization of the Cdt1GFP stably expressing cell line. (A) Western blot analysis of total cell extracts using anti-Cdt1-specific antibodies. Lane 1: MCF7 cells, lane 2: Cdt1GFP-expressing cell line. (B) Parental MCF7 (upper) or Cdt1GFP-expressing (lower) cell lines were subjected to immunofluorescence with anti-GFP-(middle) and anti-Cdt1-(right) specific antibodies and counter-stained with DAPI (left). (C) 2D scatter plots showing relative intensity of Cdt1 (by indirect immunofluorescence) or Cdt1GFP (GFP fluorescence) against relative intensity of cyclin A (indirect immunofluorescence) in individual cells from the parental MCF7 (black diamond) or the Cdt1GFP-expressing (grey square) cell line respectively. Intensities in 30 cells were quantified for each cell line. (D) Subcellular fractionation of Cdt1GFP-expressing cells. Cells were synchronized in mitosis by a nocodazole block and time points taken as they progressed into G1. Total cell lysates (lanes 1–5) were fractionated into a soluble fraction (lanes 6–10) and a chromatin-enriched fraction (lanes 11–15) as described previously (Nishitani et al, 2004). An anti-Cdt1 antibody was used to detect Cdt1GFP and endogenous Cdt1, whereas Orc2, Mcm3 and tubulin served as controls. (E) Time-lapse analysis of Cdt1GFP. Cdt1GFP intensity in a cell exiting mitosis into G1 is depicted. Images were recorded every 15 min. Representative images are shown at the bottom.
Cdt1–chromatin interaction dynamics in the living cell
Cdt1–chromatin association has mainly been studied using biochemical and in vitro approaches. To obtain information about the dynamics of Cdt1 association with chromatin in the context of the living cell, we employed in vivo fluorescence microscopy. Fluorescence recovery after photobleaching (FRAP) experiments were performed on Cdt1GFP, on a nuclear localized construct of GFP (GFPnls) and on a GFP-tagged mutant of Cdt1 (Cdt1Δ1–140nlsGFP). The Cdt1Δ1–140nlsGFP mutant has a deletion in a region that was previously shown to exhibit in vitro DNA-binding activity (Yanagi et al, 2002), but retains the major Geminin and MCM interaction domains (Yanagi et al, 2002; Ballabeni et al, 2004; Lee et al, 2004; Nishitani et al, 2004; Saxena et al, 2004; Ferenbach et al, 2005). Because the mutant shows a reduced association with chromatin (Figure 2A), it is able to serve as a proper control for wild-type Cdt1–chromatin association. The binding properties of wild-type Cdt1 or the mutant form of Cdt1 were assessed by photobleaching the GFP-tagged proteins in a 4-μm-diameter circular area in the nucleus, and measuring the recovery of fluorescence intensity over time (Figure 2B). A qualitative analysis of the recovery curves that measures the half-time of recovery (t1/2) showed that Cdt1GFP exhibited significantly slower mobility (t1/2=0.89±0.2 s) than either GFPnls (t1/2=0.40±0.08 s) or the mutant form of Cdt1 (Cdt1Δ1–140nlsGFP, t1/2=0.40±0.09 s). Thus Cdt1Δ1–140nlsGFP diffuses freely, much like GFPnls, whereas the slow recovery of Cdt1GFP can be attributed to binding to chromatin, which prevents a rapid diffusion of unbleached Cdt1GFP into the bleached area. Identical recovery kinetics were obtained using other cell lines (Supplementary Figure S1 and data not shown).
Figure 2.
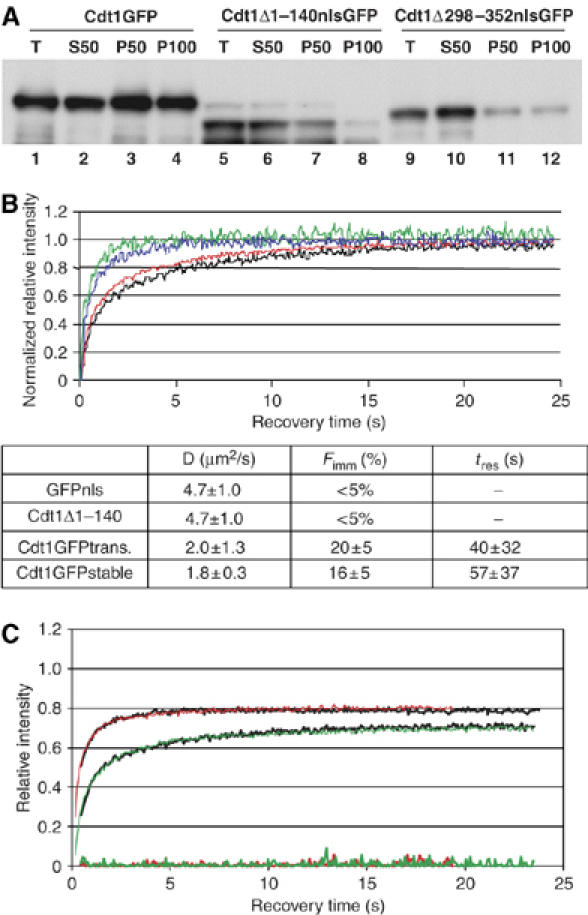
FRAP of Cdt1GFP reveals dynamic chromatin association. (A) Chromatin association of wild-type and mutant Cdt1 forms. MCF7 cells were transfected with Cdt1GFP (lanes 1–4), Cdt1Δ1–140nlsGFP (lanes 5–8) or Cdt1Δ298–352nlsGFP (lanes 9–12) and total cell extracts (lanes 1, 5 and 9) fractionated into soluble (lanes 2, 6 and 10) and chromatin enriched fractions in the presence of 50 mM NaCl (lanes 3, 7 and 11) or 100 mM NaCl (lanes 4, 8 and 12). All fractions were Western blotted with anti-Cdt1 antibodies. Reduced recovery in chromatin-enriched fractions of Cdt1Δ1–140 and Cdt1Δ298–352 as compared to wild-type Cdt1 is evident. (B) Fluorescence recovery over time of Cdt1GFP (black: stable cell line, red: transiently transfected), Cdt1Δ1–140nlsGFP (blue, transiently transfected) and GFPnls (green, transiently transfected). Lower panel: diffusion coefficient (D), immobile fraction (Fimm) and duration of immobilization (tres, representing residence time in immobile chromatin-associated complexes), as estimated from fitting the data using computer simulations. FRAP curves are normalized from 0 to 1 to allow direct comparison of the data. (C) Overlay of simulated curves for Cdt1GFP (green line, D=1.9 μm2/s, Fimm=20% and tres=64 s) and Cdt1Δ1–140nlsGFP (red line, D=4.8 μm2/s, no immobile fraction), to experimentally obtained data (black lines). The residuals of the fittings are shown at the bottom of the graph. For parameter identification, FRAP data normalized to prebleach values only were used, to avoid masking of the immobilized fraction by normalization (Houtsmuller, 2005).
To obtain quantitative binding parameters from the FRAP data, computer simulations were used to derive FRAP curves from modeling both the diffusion and binding of molecules within a defined geometry (see Material and methods; and Houtsmuller et al, 1999, 2005; Hoogstraten et al, 2002; Farla et al, 2005). Using this approach, the diffusion constants of the GFP-tagged molecules and their residence times on chromatin were derived by fitting the measured FRAP data to a model consisting of multiple species with different kinetics. The fluorescence recovery curves of Cdt1GFP were well fitted by a model containing two kinetic pools (Figure 2B): a large pool (84±5%), exhibiting an apparent free diffusion rate of 1.8±0.3 μm2/s, and a slower pool (16±5%), representing a transiently immobile fraction with an estimated residence time in the order of minutes. In contrast to the wild-type Cdt1 kinetics, the mutant Cdt1Δ1–140nlsGFP did not exhibit a detectable immobile fraction and had an apparent diffusion rate (4.7±1 μm2/s) comparable to that of GFPnls (Figure 2B and C), which is consistent with the qualitative analysis above, and demonstrates that Cdt1Δ1–140nlsGFP does not interact with chromatin. Thus Cdt1GFP shows a dynamic chromatin association with residence times in the order of minutes. These kinetics are more dynamic than those described for chromatin-associated complexes such as DNA repair proteins (Houtsmuller et al, 1999) and RNA polymerases (Dundr et al, 2002) but are comparable to the kinetics that have been reported for transcription factors (McNally et al, 2000).
With a model consisting of only two pools, a mobile and an immobile pool, the kinetics of the wild-type Cdt1GFP could only be fitted with an apparent diffusion rate that is slower than that of the mutant that does not bind chromatin. The two to three fold difference in diffusion rate that we observed cannot be explained merely by a difference in complex size. We therefore reasoned that the slower apparent diffusion rate of wild-type Cdt1GFP may arise from a pool having short-lived transient interactions with chromatin. Indeed, fitting the Cdt1GFP recovery curves with a model that assumes three kinetic pools (free diffusion and two immobile fractions) yields a population of 30% with a diffusion coefficient comparable to that of the mutant and GFPnls (4.8 μm2/s), a ∼50% short-lived (<1 s) immobile fraction, and a ∼20% long-lived (>1 min) immobile fraction. Thus, the observed FRAP kinetics of Cdt1 are dominated by the binding reactions and not by its rapid diffusion (comparable to GFPnls). Our data therefore suggest that Cdt1 associates with chromatin both with short- and long-lived interactions, comparable with a DNA ‘scanning' or ‘probing' model (Phair et al, 2004), where Cdt1 continuously probes the genome for appropriate binding sites and only forms more stable complexes when it encounters a bona fide binding site.
Cdt1–chromatin interaction kinetics during the cell cycle
We then asked whether the observed dynamic interactions of Cdt1 with chromatin are maintained throughout G1 phase, or whether there is a particular critical time during G1 where Cdt1 is stably bound to chromatin to load the MCM proteins. To address this question, Cdt1GFP-expressing cells were synchronized by a thymidine-nocodazole block. These cells were then released into a synchronous cell cycle and subjected to FRAP analysis at 1-h intervals as they progressed into G1. As shown in Figure 3A, in a two-component fit the apparent diffusion coefficient (1.6±0.4 μm2/s) and the long-lived (∼1 min) transiently immobile fraction (14±5%) remained constant through G1 phase (2–12 h). Therefore, Cdt1 retains its dynamic interactions with chromatin during all of the G1 phase.
Figure 3.
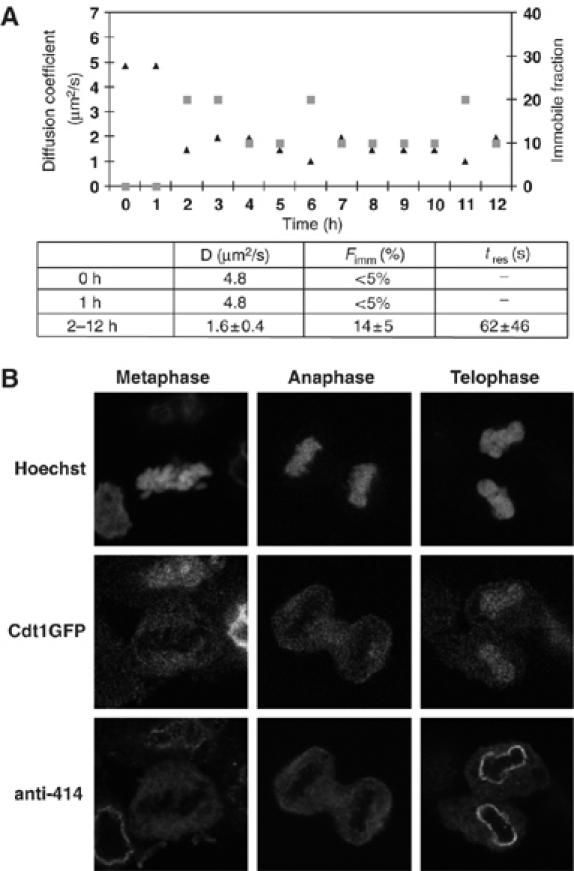
Cdt1GFP shows dynamic chromatin association during G1. (A) Diffusion coefficient (D—triangles) and immobile fraction (Fimm—squares) of Cdt1GFP plotted against time (in hours) after release of mitotic block by thymidine-nocodazole on Cdt1GFP-expressing cells (stable cell line): 0–1 h (mitosis), 2–12 h (G1 phase). The diffusion coefficient (D), immobile fraction (Fimm) and the duration of immobilization of this fraction (tres) as estimated from fitting the data to recovery curves generated by computer simulations, are shown at the bottom. (B) Confocal images during mitosis show that Cdt1GFP, present at low levels in early mitosis, is excluded from chromatin until anaphase, whereas it colocalizes with chromatin during telophase, concomitant with the formation of the nuclear envelope. DNA staining by Hoechst and staining for nucleoporins (anti-414) were used to discriminate mitotic stages from a population of asynchronous cells.
However, in early mitosis (0–1 h) Cdt1 accumulates in the nucleus at low levels and exhibits only rapid diffusion (4.8 μm2/s) similar to the non-binding mutant and GFPnls, indicating that Cdt1 does not bind to chromatin during this stage of the cell cycle. This observation prompted us to investigate the localization of Cdt1 during mitosis in more detail. Using confocal microscopy we imaged the localization of Cdt1GFP (Figure 3B) and of endogenous Cdt1 (data not shown) through mitosis. Cdt1 is excluded from the condensed chromatin for most of mitosis, including anaphase, consistent with the FRAP data that there is no Cdt1 interaction with chromatin during these phases. However, Cdt1 reappears on chromatin at telophase (Figure 3B), as the nuclear envelope reforms. Indeed, FRAP analysis of Cdt1GFP in telophase cells shows kinetics that are consistent with chromatin binding (D: 2.6 μm2/s, Fimm: 20%). To exclude any possible effect of the drugs used for the synchronization of the cells, we also performed FRAP experiments in mitotic cells from asynchronous populations and obtained similar results (data not shown). We conclude that Cdt1 is excluded from chromatin in early mitosis and starts associating with chromatin at telophase, maintaining both long- and short-lived transient interactions with chromatin throughout G1.
In vivo mapping of Cdt1 functional domains
Cdt1 is negatively regulated by its inhibitor Geminin although the exact mechanism is unknown. From in vitro data, it has been suggested that the Cdt1 DNA-binding domains overlap with the Geminin-binding domain (Yanagi et al, 2002; Lee et al, 2004). However, in a Xenopus licensing system, both Cdt1 and Geminin can be found associated with chromatin (Gillespie et al, 2001). These conflicting data prompted us to map the functional domains of Cdt1 that are responsible for chromatin association in vivo. Furthermore we investigated if these domains overlap with the domains responsible for Geminin interactions.
Previous experiments have broadly defined three functional domains on Cdt1 (Gillespie et al, 2001; Yanagi et al, 2002; Ballabeni et al, 2004; Lee et al, 2004; Nishitani et al, 2004; Saxena et al, 2004; Ferenbach et al, 2005): a domain in the middle of the molecule, containing the major Geminin interaction site; an N-terminal domain, which is required for correct cell cycle proteolysis and contains a second interaction site for Geminin; and a C-terminal domain, which is required for association with MCM proteins. Moreover, recombinant Cdt1 has been shown to exhibit a sequence non-specific DNA sequence binding activity in vitro, in which both the N terminus and the middle part of the molecule have been implicated (Yanagi et al, 2002; Lee et al, 2004).
To map functional domains of Cdt1, we performed FRAP experiments on deletion mutants of Cdt1. As shown in Figure 4A, mutants with deletions in the N-terminal domain (aa 1–140) as well as in a short region in the middle (aa 298–352) both showed rapid recovery kinetics comparable to that of GFPnls, indicating that these areas are required independently for the transient interactions of Cdt1 with chromatin. Cdt1 has been shown to interact with the DNA polymerase clamp PCNA (Arias and Walter, 2006; Senga et al, 2006) and with cyclin-dependent kinase complexes (Liu et al, 2004; Sugimoto et al, 2004) through its N-terminal region. To investigate whether these protein–protein interactions might be responsible for tethering Cdt1 to chromatin, we studied the recovery kinetics of two more mutants, Cdt1A6 and Cdt1Cy, previously shown to lack the ability to interact with PCNA (Nishitani et al, 2006) and cyclin E/A (Nishitani et al, 2004) complexes, respectively. These mutants showed FRAP kinetics comparable to wild-type Cdt1GFP, indicating that interactions with PCNA or cyclins are not required for Cdt1–chromatin association during G1 (Figure 4B and data not shown). Interestingly, the mutants Cdt1Δ1–140nlsGFP and Cdt1Δ298–352nlsGFP, which have lost the ability to bind to chromatin, still retain their interactions with Geminin (Lee et al, 2004; Nishitani et al, 2004) (Figure 4B). On the other hand, mutants deleted in the major Geminin interaction domain (residues 150–190), which show a reduced affinity for Geminin (Ballabeni et al, 2004; Figure 4B), have similar mobility as wild-type Cdt1, showing that they retain the capacity to bind to chromatin (Figure 4B). Taken together these experiments demonstrate that there are two domains, at the N terminus and in the middle part of Cdt1, which are both required for the association of Cdt1 with chromatin, whereas they are redundant for Geminin interaction. Moreover, the middle part of the Cdt1 molecule, which is required for Geminin interaction, is not required for chromatin association. Therefore, we conclude that in the context of the living cell, chromatin and Geminin binding are separable functions of Cdt1.
Figure 4.
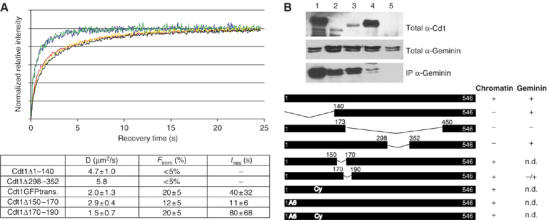
Mapping of Cdt1 regions required for chromatin association in vivo, assessed by FRAP. (A) Fluorescence recovery over time of Cdt1GFP (red), Cdt1Δ1–140nlsGFP (blue), Cdt1Δ298–352nlsGFP (green), Cdt1Δ150–170GFP (yellow) and Cdt1Δ170–190GFP (black) transiently transfected in MCF7 cells. The diffusion coefficient (D), immobile fraction (Fimm) and the duration of immobilization of this fraction (tres) are shown at the bottom. (B) Geminin interactions of wild-type Cdt1 and mutants used in this study. Cdt1GFP (lane 1), Cdt1Δ1–140nlsGFP (lane 2), Cdt1Δ298–352nlsGFP (lane 3), Cdt1Δ170–190GFP (lane 4) or GFPnls (lane 5) were transfected into MCF7 cells together with Geminin-dhcRed. Total cell extracts (first Western blot anti-Cdt1, second Western blot anti-Geminin) were immunoprecipitated with anti-GFP antibodies and the presence of Geminin-dhcRed in the immunoprecipitate assessed by Western blotting (third Western plot). Cdt1Δ170–190 shows greatly reduced association with Geminin, though still detectable binding above background levels. Lower panel: schematic representation of the mutant forms of Cdt1 used for FRAP analysis. Their ability (+) or inability (−) to exhibit wild-type kinetics of fluorescence recovery (chromatin) and to co-immunoprecipitate with Geminin is shown on the right. Mutants Δ1–140, Δ298–352 and Cdt1Cy, which failed to localize correctly to the nucleus, were fused to three copies of the SV40 nuclear localization sequence at the C terminus of the molecule, before the GFP. Wild type Cdt1nlsGFP showed identical kinetics to Cdt1GFP (data not shown). n.d. not determined.
Cdt1–Geminin interactions in the living cell
Expression of Geminin during G1 inhibits licensing through binding to Cdt1 (Shreeram et al, 2002), though the mechanism of inhibition remains unclear. To study quantitatively the interactions of Cdt1 with its inhibitor, Geminin, within the living cell, we employed fluorescence lifetime imaging microscopy (FLIM). Upon illumination, the excitation energy of one fluorophore (donor) can be transferred to another fluorophore (acceptor) in close proximity by fluorescence resonance energy transfer (FRET) (Bastiaens and Squire, 1999). Typically, FRET only occurs when the distance is less than 10 nm, and therefore can be used to detect direct interactions between fluorescently tagged proteins. FRET can be detected by a reduction in donor fluorescence lifetime, which can be measured robustly on a pixel-by-pixel basis by FLIM, enabling quantification of where and when interactions take place within the living cell. The advantage of FLIM over other methods to measure FRET is that fluorescence lifetimes are independent of fluorophore concentration or light path length, parameters difficult to control in a biological specimen such as a cell. FLIM is therefore highly suitable not only for measuring location and timing of binding but also for assessing relative binding affinities within living cells. In our case, FRET is measured by the lifetime of the donor-tagged Cdt1 alone, yielding a measure of the amount of acceptor-tagged Geminin that is binding.
To study Cdt1–Geminin interactions, we expressed Cdt1GFP alone or coexpressed Cdt1GFP and Geminin tagged with the red fluorescent protein dimer hcRed (GeminindhcRed) in MCF7 cells and recorded FLIM data. As Cdt1GFP is expressed only during G1 phase, while GeminindhRed escapes degradation and is expressed in all cell cycle phases, the cells that co-express both are in G1 phase (Supplementary Figure S2A). Two independent estimations of the fluorescence lifetime of the donor GFP were calculated (phase and modulation lifetimes) in each pixel of the image. FRET, and therefore protein–protein interaction, is indicated by a decrease of both these lifetime estimations in the Cdt1GFP/GeminidhcRed coexpressing cells, compared to those measured in control cells expressing Cdt1GFP alone. As shown in Figure 5A, cells coexpressing Cdt1GFP with GeminindhcRed showed decreased Cdt1GFP lifetime values throughout the nucleus, indicative of Cdt1–Geminin binding. The FRET signal decreased markedly when a form of Geminin mutated in the Cdt1 binding domain (Δ90–120) (Ballabeni et al, 2004) was coexpressed with Cdt1GFP (Figure 5A). Immunoprecipitation experiments verified that GemininΔ90–210 is not detected in a complex with Cdt1GFP in cell extracts (Supplementary Figure S2B). Cumulative two-dimensional histograms of the phase and modulation lifetimes measured on many cells showed the presence of a population of cells with low lifetime values (red) compared to the control cells (green) (Figure 5A, lower panel), indicating the occurrence of Cdt1–Geminin interactions. This shift in the phase and modulation lifetimes was not detected when we substituted GeminindhcRed by its mutant (Δ90–120).
Figure 5.
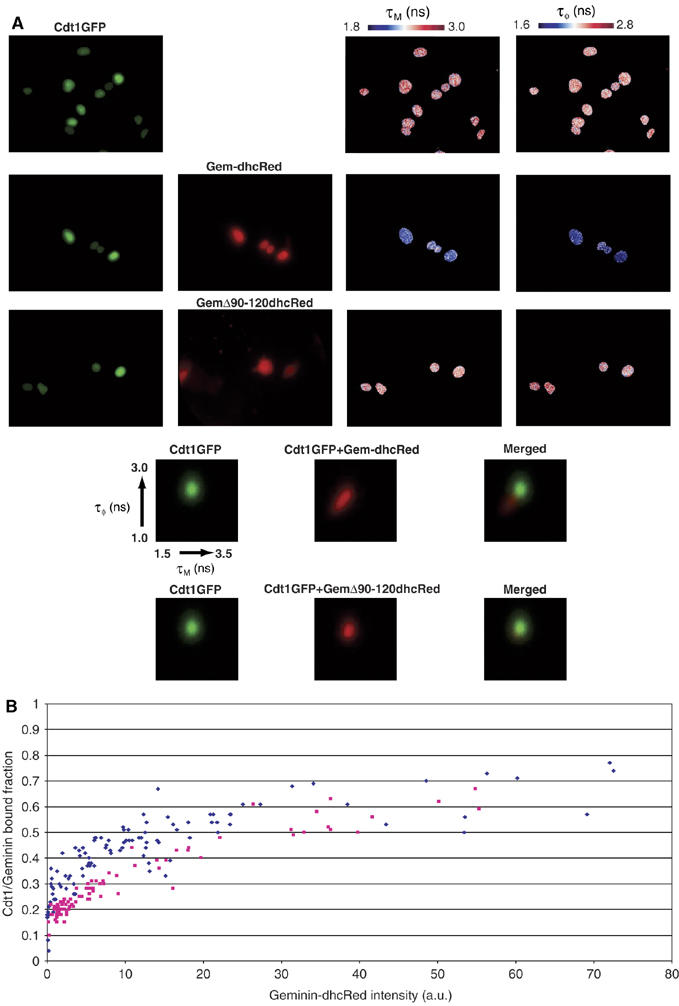
Cdt1 interacts with Geminin in vivo. (A) FLIM was used to assess interactions of Cdt1GFP with Geminin-dhcRed and GemininΔ90–120dhcRed in living MCF7 cells following transient transfection. GFP fluorescence, hcRed fluorescence, GFP modulation (τM, 1.8–3.0 ns) and phase (τϕ, 1.6–2.8 ns) lifetimes are shown. Cumulative 2D histograms (50–100 cells) of phase and modulation lifetimes of Cdt1GFP with (red) and without (green) cotransfection of Geminin-dhcRed or GemininΔ90–120dhcRed are shown at the bottom. (B) Relative fraction of Cdt1GFP in complex with GeminindhcRed (blue dots) or GemininΔ90–120dhcRed (red dots) as a function of GeminindhcRed expression. Data were acquired in 100 different cells. Average complex fractions are plotted against the average intensity of dhcRed for each cell.
To quantify the fraction of Cdt1 in complex with Geminin and to show the concentration-dependent binding of Cdt1 to Geminin, we applied global analysis to the FLIM data (Verveer et al, 2000; see also Supplementary data). This analysis calculates the fraction of Cdt1GFP that is bound to GeminindhcRed in each pixel. By plotting the mean of the bound Cdt1 fraction in each cell as a function of the mean GeminindhcRed intensity, we obtained binding isotherms (Figure 5B) that clearly show that Cdt1 interacts with Geminin in vivo when both proteins are expressed. As expected, these in vivo binding isotherms follow the law of mass action, which predicts that at low expression levels the fraction of Cdt1 in complex is lower than at high expression levels (see also Supplementary data). The higher values of the bound fraction of Cdt1 for wild-type Geminin compared to mutant (Δ90–120) Geminin for a given Geminin concentration demonstrate that the mutant protein has a decreased binding affinity to Cdt1. Furthermore, these curves show that Geminin is binding to a large fraction (up to 70%) of Cdt1. Taken together, the FLIM data demonstrate that a high proportion of the Cdt1 molecules are in complex with Geminin throughout the cell nucleus in living cells.
Cdt1 recruits Geminin onto chromatin
Our FRAP experiments showed that approximately 70% of Cdt1 maintains short- and long-lived interactions with chromatin during an unperturbed G1. Previous in vitro experiments have shown that Geminin disrupts binding of Cdt1 to DNA (Yanagi et al, 2002; Lee et al, 2004). Therefore, we directly addressed the question whether Geminin binding disrupts Cdt1 interactions with chromatin in vivo by performing FRAP experiments in MCF7 cells coexpressing Cdt1GFP and GeminindhcRed. As a control, we used Cdt1GFP coexpressed with dhcRed alone (vector-dhcRed). Experimental conditions were identical to those of FLIM measurements, where we show that up to 70% of Cdt1GFP is in complex with Geminin. As shown in Figure 6A, Cdt1GFP mobility is unaffected by the presence of Geminin dhcRed. Fitting of the Cdt1GFP FRAP data obtained in the presence and absence of Geminin showed that Cdt1GFP diffusion and binding parameters are unaffected by the presence of Geminin (Figure 6A). FRAP experiments were also performed on cells expressing a large range of GemininhcRed intensities (ratio of GeminindhcRed/Cdt1GFP from 0.25 up to 13), as well as on cells stably expressing Cdt1GFP to low levels (similar to endogenous Cdt1 levels) and transiently expressing GemininhcRed to high levels (on average 50-fold over the endogenous Geminin; data not shown). In all these cases, the mobility of Cdt1GFP remained unaffected (Supplementary Figure S2C and data not shown). We conclude therefore that, contrary to in vitro experiments where it has been reported that Geminin disrupts Cdt1 DNA-binding activity (Yanagi et al, 2002), Geminin does not affect Cdt1's association with chromatin in living cells.
Figure 6.
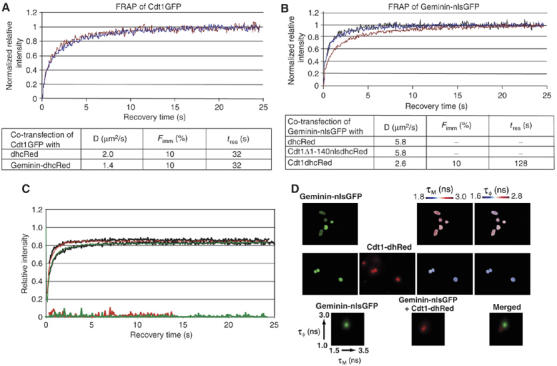
Cdt1 recruits Geminin onto chromatin. (A) Coexpression of Geminin does not affect the mobility of Cdt1GFP. Cdt1GFP fluorescence recovery curves in the presence of vector dhcRed (red line) or GeminindhcRed (blue line). Diffusion coefficient (D), % immobile fraction (Fimm) and duration of immobilization (tres) derived from fitting the data on computer-simulated curves as above are shown. (B) Coexpression of Cdt1 affects the mobility of Geminin. Geminin-nlsGFP fluorescence recovery curves in cells coexpressing Cdt1dhcRed (red line), Cdt1Δ1–140-nlsdhcRed (blue line) or vector dhcRed (black line). Diffusion coefficient (D), immobile fraction (Fimm) and duration of immobilization (tres) are shown. Geminin-nlsGFP data were best fitted by only one, freely diffusing component. (C) A computer simulation was used to fit the Geminin-nlsGFP recovery curves (black lines) in the presence of Cdt1Δ1–140-nlsdhcRed (upper graph) or in the presence of Cdt1 (lower graph) with a model that contains two components (free diffusion and one binding fraction — red lines). The residuals of the fittings are shown at the bottom of the graph. (D) Geminin-nlsGFP and Cdt1dhcRed interactions in living cells were measured by fluorescence lifetime imaging microscopy following transient transfection. Cumulative 2D histograms of phase and modulation lifetimes of Geminin-nlsGFP before (green) and after (red) cotransfection of Cdt1 are shown at the bottom.
To clarify the in vivo mechanism of Geminin inhibition, we next asked whether Cdt1 recruits Geminin onto chromatin. To this end, we performed FRAP experiments in cells expressing Geminin-nlsGFP in the presence of Cdt1-dhcRed or vector-dhcRed. Geminin-nlsGFP recovery was significantly slower in the presence of Cdt1 (Figure 6B and C), suggesting binding of Geminin-nlsGFP to the chromatin-associated fraction of Cdt1. Using FLIM measurements taken under identical conditions, the interaction between Cdt1-dhRed and Geminin-nlsGFP in living cells was directly confirmed (Figure 6D). To verify that the observed change in the diffusion rate of Geminin resulted from the ability of Cdt1 to interact with chromatin and not from differences in free diffusion of the Geminin–Cdt1 complex, we performed FRAP experiments in cells expressing Geminin-nlsGFP and Cdt1Δ1–140-nlsdhcRed, a mutant that retains the ability to interact with Geminin but not with chromatin. This experiment showed that the fluorescence recovery of Geminin remained unaffected in the presence of the Cdt1Δ1–140 mutant (Figure 6B and C). Furthermore, the fluorescence recovery of the Geminin Δ90–120 mutant, which shows reduced affinity for Cdt1, was also unaffected by Cdt1 coexpression (data not shown). Taking these data together, we conclude that Geminin is recruited onto chromatin via Cdt1 and thereby forms a licensing inhibitory complex onto chromatin.
Discussion
Here we have quantitatively studied the interactions of Cdt1 with chromatin and its inhibitor, Geminin in vivo. We showed that Cdt1 exhibits dynamic interactions with chromatin and that different domains of Cdt1 are required for chromatin and Geminin interaction, suggesting that these functions are separable in vivo. Contrary to in vitro data, our analysis shows that Cdt1 simultaneously binds chromatin and Geminin in the living cell. We propose that dynamic chromatin association of Cdt1 together with Geminin recruitment onto chromatin via Cdt1 permits a tight spatial and temporal control of the licensing process.
Dynamic chromatin association of Cdt1 throughout G1
We have demonstrated that Cdt1 interacts with chromatin in a dynamic manner and have defined the time when Cdt1 chromatin association occurs. In early mitosis, Cdt1 is free to diffuse within the nucleus, while we detect dynamic binding to chromatin from telophase, when licensing of DNA for replication has been proposed to take place (Okuno et al, 2001; Dimitrova et al, 2002). Dynamic interactions of Cdt1 with chromatin are maintained throughout G1, indicating continuous probing of chromatin. Analysis of our FRAP data demonstrates that Cdt1 exhibits both short- and long-lived interactions with chromatin, indicating that regardless of the dynamic nature of these interactions, a large fraction of Cdt1 molecules is bound to chromatin at any given time. This behavior is consistent with a 3D genome-‘scanning' or ‘probing' model according to which chromatin-binding proteins are continuously scanning the genome for appropriate binding sites, ensuring that these proteins are available throughout the nucleus (Phair et al, 2004). Our FRAP data analysis indicates that whereas Cdt1 diffuses rapidly within the nucleus irrespective of cell cycle phase, both short- and long-lived binding interactions dominate the FRAP kinetics observed during G1.
The current model for the licensing process states that origins are licensed for replication at the end of mitosis by formation of the preRC, and that chromatin remains in a licensed state until DNA replication is initiated in S phase. This suggests that preRCs must be maintained onto origins of replication throughout G1 to spatially define which parts of chromatin can be used for initiation of DNA replication. Origins are therefore viewed traditionally as being present in a fixed licensed state during G1 (Cvetic and Walter, 2006), with preRC components forming stable complexes onto chromatin. However, in recent years many cases of supposedly stably bound chromatin proteins, including heterochromatin components (Festenstein et al, 2003) and origin recognition complex components (McNairn et al, 2005), have been shown to be surprisingly dynamic. G1 phase is several hours long in mammalian cells, while transcription is ongoing, suggesting that licensing may need to be redefined during G1. Probing of chromatin by Cdt1 throughout G1 would be consistent with a dynamic model, in which chromatin is constantly checked and licensed origins are re-established throughout G1. Direct measurement of MCM protein mobility within living cells will clarify whether licensing would be better described as a dynamic process rather than a state.
Plasticity in the licensing process would offer advantages for mammalian cells, allowing fast responses to changes in the environment, as for example in response to DNA damage, when Cdt1 has been shown to become rapidly proteolysed (Higa et al, 2003; Hu et al, 2004). However, a dynamic licensed state would pose problems during S phase, when spatial information of origins not yet replicated should be maintained. We propose that recruitment of the licensing inhibitor Geminin by Cdt1 onto chromatin at the G1/S transition could help preserve this spatial information.
Mechanistic insight into licensing inhibition by Geminin in vivo
Tight coordination of licensing in both time and space is essential to ensure once per cell cycle replication. Given that Cdt1 dynamically associates with chromatin throughout G1 phase, how is such a strict coordination achieved? To address this, we further examined the molecular interactions that are relevant to the mechanism of licensing DNA replication by Cdt1.
We show here that Cdt1 can interact at the same time with chromatin and Geminin, thereby leading to Geminin recruitment onto chromatin. This contrasts to previous in vitro experiments, which showed inhibition of Cdt1 binding to single- and double-stranded DNA by Geminin. A number of reasons could explain this difference between in vitro and in vivo data: a physiological template that includes nucleosomes, nuclear matrix or other Cdt1-interacting proteins could not be assessed in vitro and it is likely that Cdt1 binding to chromatin will differ from binding to naked DNA. In addition, relative protein concentrations and experimental conditions in vitro may only partially reproduce conditions in vivo. A conformational change is likely to take place upon Geminin binding to Cdt1, both in vitro and in vivo. This conformational change may destabilize binding of Cdt1 to naked DNA in vitro while still permitting Cdt1 binding to chromatin in vivo, where additional contacts are likely to be present and relative concentrations and binding constants may differ. The major Geminin interaction domain of Cdt1 is not required for Cdt1's ability to interact with chromatin in vivo, lending support to the conclusion that Cdt1 can bind simultaneously to Geminin and to chromatin. Interestingly, the two regions of Cdt1 that are required for chromatin association in vivo have been proposed to form secondary weak interactions with Geminin (Lee et al, 2004; Saxena et al, 2004; Ferenbach et al, 2005). It is intriguing to speculate that a change in the Geminin–Cdt1 complex takes place upon chromatin association, exposing regions of Geminin previously involved in these secondary interactions. Such a conformational change would allow Geminin to interact with other factors only when in a tertiary complex with Cdt1 and DNA. It is noteworthy that Geminin has been suggested to have positive, as well as negative functions on cell cycle progression (McGarry, 2002; Wohlschlegel et al, 2002; Ballabeni et al, 2004) and to interact with chromatin-modifying activities (Del Bene et al, 2004; Luo et al, 2004; Seo et al, 2005). Interestingly, while this manuscript was under revision, Lutzmann et al (2006) proposed both positive and negative roles for Geminin recruited onto chromatin together with Cdt1 in Xenopus.
In the light of the data we have presented, we propose the following model for how temporal and spatial regulation of licensing is achieved (Figure 7). Throughout G1 phase, Cdt1 is continuously scanning the genome for the appropriate binding sites (short-lived interactions) while binding more stably but still transiently to chromatin at putative origins of replication (long-lived interactions) (Figure 7A). Such a dynamic chromatin association is an effective way to ensure that Cdt1 will be available throughout the nucleus and provides plasticity and robustness in the process of licensing. At the onset of S phase, when a tight regulation is necessary for the activation of the correct origins of replication, Geminin starts accumulating and is recruited by Cdt1 onto specific origins where changes in origin bound complexes allow origin firing (Figure 7B). Geminin recruitment leads to the formation of a licensing inhibitory complex onto chromatin and marks the unlicensed state.
Figure 7.
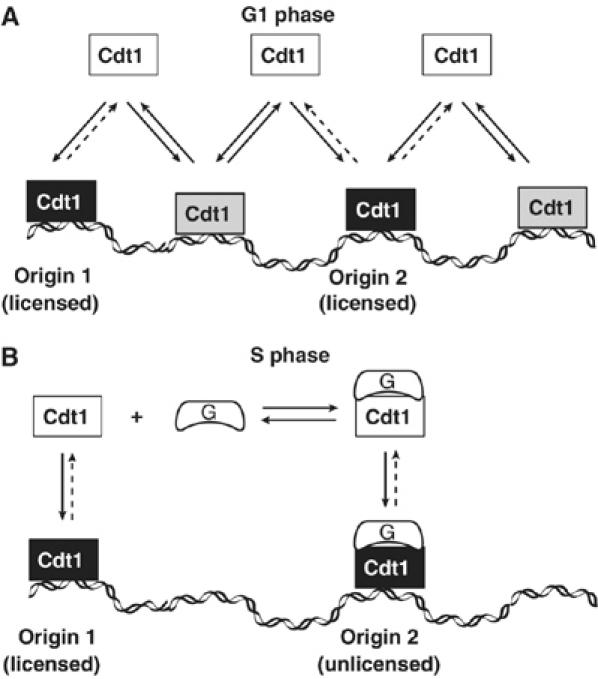
Model for the regulation of licensing through dynamic Cdt1–chromatin association and Geminin recruitment onto chromatin. (A) During G1 phase, Cdt1 continuously scans chromatin (short-lived interactions: gray boxes) while interacting more tightly (long-lived interactions: black boxes) with the appropriate origins of replication (origin 1 and origin 2). (B) At the onset of S phase, Geminin accumulates and is recruited by Cdt1 onto chromatin to determine the origins of replication where the licensing process is inhibited (origin 2, but not origin 1). By recruiting the inhibitory Geminin–Cdt1 complex only to origins that have fired, a tight spatial–temporal regulation of the licensing process is achieved.
In addition to the novel mechanistic insights into the licensing process, the analysis described here is also of practical interest. Cdt1 and Geminin constitute promising targets for anti-tumor drug development. In particular, it has been shown that Cdt1 overexpression predisposes mammalian cells for malignant transformation, whereas ectopic expression of Geminin during G1 phase inhibits licensing and results in cancer-cell-specific death (Shreeram et al, 2002). FLIM analysis and the resulting in vivo binding isotherms described here offer a measure of Cdt1–Geminin interactions in live cells and open up new possibilities for in vivo screens aiming to identify compounds blocking Cdt1 interactions within the living cell for use as anti-tumor agents.
Materials and methods
Fluorescent microscopy
Time lapse imaging was performed using a wide-field microscope VisitroSystems (Visitron) with a × 40/1.4 numerical aperature (NA) oil immersion objective and a temperature-controlled incubator. Cells were maintained at 37°C and 5% CO2 and time-lapse images were recorded every 15 min. Quantification were performed with IPLab software (Scanalytics Inc., Fairtax, VA, USA).
FLIM
Lifetimes were measured by a frequency-domain method, where the sample is excited by sinusoidally modulated light, and the phase shift and demodulation of the fluorescent light are measured. Two estimations of the fluorescence lifetime are measured from the phase shift and the demodulation in each pixel, and displayed as pseudo-color images, or summarized in two-dimensional histograms.
FLIM sequences were obtained at a modulation frequency of 80 MHz with an Olympus IX70 inverted microscope, using a × 100/1.4 NA oil objective. GFP was excited with a 476-nm argon laser line, and fluorescence was detected with a dichroic beamsplitter (Q495 LP; Chroma Technology, Brattleboro, VT) and a narrow-band emission filter (HQ510/20; Chroma). DhcRed images were recorded with a 100 W mercury arc lamp using a Texas-red filter set (excite, D560/40; dichroic, Q595 LP; emitter, D630/60).
FRAP experiments
Photobleaching experiments were performed on a Leica SP2 AOBS Sirius equipped with a × 63/1.4 NA oil immersion lens. The temperature during experiments was maintained at 37°C. GFP and dhcRed were excited using the 488 and 594 nm lasers lines respectively. Fluorescence in a 4-μm-diameter circular area of interest was monitored at 0.078 s intervals. Fifty prebleach images were recorded with 4% laser power of the 488 line followed by a bleach pulse of 0.078 s using the 456, 476, 488 and 496 nm laser lines combined at maximum power. After bleaching, 300 or 500 images were recorded at 0.078 s intervals. For telophase cells, a 3-μm-diameter circular area of interest was used. Background intensities were subtracted from each image before analysis. To allow direct comparison between FRAP curves (Figures 2, 3 and 4), raw data were normalized as follows. The relative fluorescence intensity in the area of interest at each time point following the bleach pulse was calculated as RFI(t)=(It/ITOT(t))/(I0/ITOT(0)), where It is the average fluorescence intensity in the area of interest at each time point, ITOT(t) the average fluorescence intensity of the whole cell at the same time point, I0 the average fluorescence intensity in the area of interest of the 50 prebleach images and ITOT(0) the average fluorescence intensity of the whole cell of the 50 prebleach images. The relative fluorescence intensity (RFI) was further normalized for the bleach depth to give the normalized relative intensity I(t)=(RFI(t)-Ibleach)/(1-Ibleach), where Ibleach is the fluorescence intensity of the first image after the bleach pulse. The results of at least 10 cells were averaged for each curve.
FRAP data analysis
For the model-based analysis of the FRAP data, raw FRAP curves were normalized to prebleach values and the best-fitting curve (by a least-squares criterion) was picked from a large set of computer-simulated FRAP curves, in which three parameters representing mobility properties were varied: diffusion rate (ranging from 0.04 to 25 μm2/s), immobile fraction (0, 10, 20, 30, 40 and 50%), and time spent in immobile state (2, 4, 8, 16, 32, 64, 128 and ∞ s). The discrete parameter sampling determines a minimum error equal to half the sampling interval I. The reported error is the standard deviation S, calculated from three independent experiments or I/2 if S<I/2.
The Monte Carlo computer simulations used to generate FRAP curves for the fit were based on a model that simulates diffusion of molecules and binding to immobile elements in an ellipsoidal volume. The bleaching pulse of the FRAP measurement was simulated on the basis of an experimentally derived three-dimensional laser intensity profile. This was used to determine the probability for each molecule to get bleached considering their 3D position relative to a circular bleach region. The simulation of the FRAP curve was then run for a number of time steps of duration Δt. Diffusion was simulated at each new time step t+Δt by deriving the new positions (xt+Δt, yt+Δt, zt+Δt) of all mobile molecules from their current positions (xt, yt, zt) by xt+Δt=xt+G(r1), yt+Δt=yt+G(r2), and zt+Δt=zt+G(r3), where ri is a random number (0⩽ri⩽1) chosen from a uniform distribution, and G(ri) an inversed cumulative Gaussian distribution with μ=0 and σ2=6D Δt, with D being the diffusion coefficient. Immobilization was derived from simple binding kinetics described by kon/koff=Fimm/(1−Fimm), where Fimm is the relative number of immobile molecules. The probability for each particle to become immobilized (representing chromatin binding) is defined as Pimmobilise=kon=koff·Fimm/(1−Fimm), where koff=1/Timm, and Timm is the average time spent in immobile complexes. The probability to be released is given by Pmobilise=koff=1/Timm. In simulations of two immobile fractions with different kinetics, two immobilization/mobilization probabilities were evaluated at each unit time step. Simulations of the FRAP curve were performed at every unit time step by counting the number of unbleached molecules in the bleached region after simulations of diffusion and binding during that time step.
In all simulations, the size of the ellipsoid was based on the size of the nuclei, and the region used in the measurements determined the size of the simulated bleach region. The laser intensity profile using the simulation of the bleaching step was derived from confocal images stacks of chemically fixed nuclei containing GFP that were exposed to a stationary laser beam at various intensities and varying exposure times. The unit time step Δt corresponded to the experimental sample rate of 78 ms. The number of molecules in the simulations was equal to 106, which was empirically determined by producing curves that closely approximate the data with comparable fluctuations.
Supplementary Material
Supplementary Figure S1
Supplementary Figure S2
Supplementary Information: Material and Methods
Acknowledgments
We thank Kristian Helin, Jan Ellenberg and Iain Mattaj for sharing reagents and Frank Uhlmann for critically reading the manuscript. This work was supported by the Human Frontiers Science Program Organization and by short-term fellowships (to GX) from EMBO and Boehringer Ingelheim Fond.
References
- Aparicio OM, Weinstein DM, Bell SP (1997) Components and dynamics of DNA replication complexes in S. cerevisiae: redistribution of MCM proteins and Cdc45p during S phase. Cell 91: 59–69 [DOI] [PubMed] [Google Scholar]
- Arias EE, Walter JC (2006) PCNA functions as a molecular platform to trigger Cdt1 destruction and prevent re-replication. Nat Cell Biol 8: 84–90 [DOI] [PubMed] [Google Scholar]
- Ballabeni A, Melixetian M, Zamponi R, Masiero L, Marinoni F, Helin K (2004) Human Geminin promotes pre-RC formation and DNA replication by stabilizing CDT1 in mitosis. EMBO J 23: 3122–3132 [DOI] [PMC free article] [PubMed] [Google Scholar]
- Bastiaens PI, Squire A (1999) Fluorescence lifetime imaging microscopy: spatial resolution of biochemical processes in the cell. Trends Cell Biol 9: 48–52 [DOI] [PubMed] [Google Scholar]
- Bell SP, Dutta A (2002) DNA replication in eukaryotic cells. Annu Rev Biochem 71: 333–374 [DOI] [PubMed] [Google Scholar]
- Blow JJ, Dutta A (2005) Preventing re-replication of chromosomal DNA. Nat Rev Mol Cell Biol 6: 476–486 [DOI] [PMC free article] [PubMed] [Google Scholar]
- Cvetic CA, Walter JC (2006) Getting a grip on licensing: mechanism of stable Mcm2–7 loading onto replication origins. Mol Cell 21: 143–144 [DOI] [PubMed] [Google Scholar]
- Del Bene F, Tessmar-Raible K, Wittbrodt J (2004) Direct interaction of geminin and Six3 in eye development. Nature 427: 745–749 [DOI] [PubMed] [Google Scholar]
- Diffley JF (2004) Regulation of early events in chromosome replication. Curr Biol 14: R778–R786 [DOI] [PubMed] [Google Scholar]
- Dimitrova DS, Prokhorova TA, Blow JJ, Todorov IT, Gilbert DM (2002) Mammalian nuclei become licensed for DNA replication during late telophase. J Cell Sci 115: 51–59 [DOI] [PMC free article] [PubMed] [Google Scholar]
- Dundr M, Hoffmann-Rohrer U, Hu Q, Grummt I, Rothblum LI, Phair RD, Misteli T (2002) A kinetic framework for a mammalian RNA polymerase in vivo. Science 298: 1623–1626 [DOI] [PubMed] [Google Scholar]
- Farla P, Hersmus R, Trapman J, Houtsmuller AB (2005) Antiandrogens prevent stable DNA-binding of the androgen receptor. J Cell Sci 118: 4187–4198 [DOI] [PubMed] [Google Scholar]
- Ferenbach A, Li A, Brito-Martins M, Blow JJ (2005) Functional domains of the Xenopus replication licensing factor Cdt1. Nucleic Acids Res 33: 316–324 [DOI] [PMC free article] [PubMed] [Google Scholar]
- Festenstein R, Pagakis SN, Hiragami K, Lyon D, Verreault A, Sekkali B, Kioussis D (2003) Modulation of heterochromatin protein 1 dynamics in primary mammalian cells. Science 299: 719–721 [DOI] [PubMed] [Google Scholar]
- Gillespie PJ, Li A, Blow JJ (2001) Reconstitution of licensed replication origins on Xenopus sperm nuclei using purified proteins. BMC Biochem 2: 15. [DOI] [PMC free article] [PubMed] [Google Scholar]
- Higa LA, Mihaylov IS, Banks DP, Zheng J, Zhang H (2003) Radiation-mediated proteolysis of CDT1 by CUL4-ROC1 and CSN complexes constitutes a new checkpoint. Nat Cell Biol 5: 1008–1015 [DOI] [PubMed] [Google Scholar]
- Hoogstraten D, Nigg AL, Heath H, Mullenders LH, van Driel R, Hoeijmakers JH, Vermeulen W, Houtsmuller AB (2002) Rapid switching of TFIIH between RNA polymerase I and II transcription and DNA repair in vivo. Mol Cell 10: 1163–1174 [DOI] [PubMed] [Google Scholar]
- Houtsmuller AB (2005) Fluorescence recovery after photobleaching: application to nuclear proteins. Adv Biochem Eng Biotechnol 95: 177–199 [DOI] [PubMed] [Google Scholar]
- Houtsmuller AB, Rademakers S, Nigg AL, Hoogstraten D, Hoeijmakers JH, Vermeulen W (1999) Action of DNA repair endonuclease ERCC1/XPF in living cells. Science 284: 958–961 [DOI] [PubMed] [Google Scholar]
- Hu J, McCall CM, Ohta T, Xiong Y (2004) Targeted ubiquitination of CDT1 by the DDB1-CUL4A-ROC1 ligase in response to DNA damage. Nat Cell Biol 6: 1003–1009 [DOI] [PubMed] [Google Scholar]
- Ishimi Y (1997) A DNA helicase activity is associated with an MCM4, -6, and -7 protein complex. J Biol Chem 272: 24508–24513 [DOI] [PubMed] [Google Scholar]
- Kondo T, Kobayashi M, Tanaka J, Yokoyama A, Suzuki S, Kato N, Onozawa M, Chiba K, Hashino S, Imamura M, Minami Y, Minamino N, Asaka M (2004) Rapid degradation of Cdt1 upon UV-induced DNA damage is mediated by SCFSkp2 complex. J Biol Chem 279: 27315–27319 [DOI] [PubMed] [Google Scholar]
- Lee C, Hong B, Choi JM, Kim Y, Watanabe S, Ishimi Y, Enomoto T, Tada S, Kim Y, Cho Y (2004) Structural basis for inhibition of the replication licensing factor Cdt1 by geminin. Nature 430: 913–917 [DOI] [PubMed] [Google Scholar]
- Li X, Zhao Q, Liao R, Sun P, Wu X (2003) The SCF(Skp2) ubiquitin ligase complex interacts with the human replication licensing factor Cdt1 and regulates Cdt1 degradation. J Biol Chem 278: 30854–30858 [DOI] [PubMed] [Google Scholar]
- Liu E, Li X, Yan F, Zhao Q, Wu X (2004) Cyclin-dependent kinases phosphorylate human Cdt1 and induce its degradation. J Biol Chem 279: 17283–17288 [DOI] [PubMed] [Google Scholar]
- Luo L, Yang X, Takihara Y, Knoetgen H, Kessel M (2004) The cell-cycle regulator geminin inhibits Hox function through direct and polycomb-mediated interactions. Nature 427: 749–753 [DOI] [PubMed] [Google Scholar]
- Lutzmann M, Maiorano D, Mechali M (2006) A Cdt1–geminin complex licenses chromatin for DNA replication and prevents rereplication during S phase in Xenopus. EMBO J 25: 5764–5774 [DOI] [PMC free article] [PubMed] [Google Scholar]
- McGarry TJ (2002) Geminin deficiency causes a Chk1-dependent G2 arrest in Xenopus. Mol Biol Cell 13: 3662–3671 [DOI] [PMC free article] [PubMed] [Google Scholar]
- McGarry TJ, Kirschner MW (1998) Geminin, an inhibitor of DNA replication, is degraded during mitosis. Cell 93: 1043–1053 [DOI] [PubMed] [Google Scholar]
- McNairn AJ, Okuno Y, Misteli T, Gilbert DM (2005) Chinese hamster ORC subunits dynamically associate with chromatin throughout the cell-cycle. Exp Cell Res 308: 345–356 [DOI] [PMC free article] [PubMed] [Google Scholar]
- McNally JG, Muller WG, Walker D, Wolford R, Hager GL (2000) The glucocorticoid receptor: rapid exchange with regulatory sites in living cells. Science 287: 1262–1265 [DOI] [PubMed] [Google Scholar]
- Melixetian M, Ballabeni A, Masiero L, Gasparini P, Zamponi R, Bartek J, Lukas J, Helin K (2004) Loss of Geminin induces rereplication in the presence of functional p53. J Cell Biol 165: 473–482 [DOI] [PMC free article] [PubMed] [Google Scholar]
- Nishitani H, Lygerou Z (2002) Control of DNA replication licensing in a cell cycle. Genes Cells 7: 523–534 [DOI] [PubMed] [Google Scholar]
- Nishitani H, Lygerou Z, Nishimoto T (2004) Proteolysis of DNA replication licensing factor Cdt1 in S-phase is performed independently of geminin through its N-terminal region. J Biol Chem 279: 30807–30816 [DOI] [PubMed] [Google Scholar]
- Nishitani H, Sugimoto N, Roukos V, Nakanishi Y, Saijo M, Obuse C, Tsurimoto T, Nakayama KI, Nakayama K, Fujita M, Lygerou Z, Nishimoto T (2006) Two E3 ubiquitin ligases, SCF-Skp2 and DDB1-Cul4, target human Cdt1 for proteolysis. EMBO J 25: 1126–1136 [DOI] [PMC free article] [PubMed] [Google Scholar]
- Nishitani H, Taraviras S, Lygerou Z, Nishimoto T (2001) The human licensing factor for DNA replication Cdt1 accumulates in G1 and is destabilized after initiation of S-phase. J Biol Chem 276: 44905–44911 [DOI] [PubMed] [Google Scholar]
- Okuno Y, McNairn AJ, den Elzen N, Pines J, Gilbert DM (2001) Stability, chromatin association and functional activity of mammalian pre-replication complex proteins during the cell cycle. EMBO J 20: 4263–4277 [DOI] [PMC free article] [PubMed] [Google Scholar]
- Phair R, Scaffidi P, Elbi C, Vecerova J, Dey A, Ozato K, Brown DT, Hager G, Bustin M, Misteli T (2004) Global nature of dynamic protein–chromatin interactions in vivo: three-dimensional genome scanning and dynamic interaction networks of chromatin proteins. Mol Cell Biol 24: 6393–6402 [DOI] [PMC free article] [PubMed] [Google Scholar]
- Saxena S, Yuan P, Dhar SK, Senga T, Takeda D, Robinson H, Kornbluth S, Swaminathan K, Dutta A (2004) A dimerized coiled-coil domain and an adjoining part of geminin interact with two sites on Cdt1 for replication inhibition. Mol Cell 15: 245–258 [DOI] [PubMed] [Google Scholar]
- Senga T, Sivaprasad U, Zhu W, Park JH, Arias EE, Walter JC, Dutta A (2006) PCNA is a cofactor for Cdt1 degradation by CUL4/DDB1-mediated N-terminal ubiquitination. J Biol Chem 281: 6246–6252 [DOI] [PubMed] [Google Scholar]
- Seo S, Herr A, Lim JW, Richardson GA, Richardson H, Kroll KL (2005) Geminin regulates neuronal differentiation by antagonizing Brg1 activity. Genes Dev 19: 1723–1734 [DOI] [PMC free article] [PubMed] [Google Scholar]
- Shreeram S, Sparks A, Lane DP, Blow JJ (2002) Cell type-specific responses of human cells to inhibition of replication licensing. Oncogene 21: 6624–6632 [DOI] [PMC free article] [PubMed] [Google Scholar]
- Sugimoto N, Tatsumi Y, Tsurumi T, Matsukage A, Kiyono T, Nishitani H, Fujita M (2004) Cdt1 phosphorylation by cyclin A-dependent kinases negatively regulates its function without affecting geminin binding. J Biol Chem 279: 19691–19697 [DOI] [PubMed] [Google Scholar]
- Tada S, Li A, Maiorano D, Mechali M, Blow JJ (2001) Repression of origin assembly in metaphase depends on inhibition of RLF-B/Cdt1 by geminin. Nat Cell Biol 3: 107–113 [DOI] [PMC free article] [PubMed] [Google Scholar]
- Vaziri C, Saxena S, Jeon Y, Lee C, Murata K, Machida Y, Wagle N, Hwang DS, Dutta A (2003) A p53-dependent checkpoint pathway prevents rereplication. Mol Cell 11: 997–1008 [DOI] [PubMed] [Google Scholar]
- Verveer PJ, Squire A, Bastiaens PI (2000) Global analysis of fluorescence lifetime imaging microscopy data. Biophys J 78: 2127–2137 [DOI] [PMC free article] [PubMed] [Google Scholar]
- Wohlschlegel JA, Dwyer BT, Dhar SK, Cvetic C, Walter JC, Dutta A (2000) Inhibition of eukaryotic DNA replication by geminin binding to Cdt1. Science 290: 2309–2312 [DOI] [PubMed] [Google Scholar]
- Wohlschlegel JA, Kutok JL, Weng AP, Dutta A (2002) Expression of geminin as a marker of cell proliferation in normal tissues and malignancies. Am J Pathol 161: 267–273 [DOI] [PMC free article] [PubMed] [Google Scholar]
- Yanagi K, Mizuno T, You Z, Hanaoka F (2002) Mouse geminin inhibits not only Cdt1–MCM6 interactions but also a novel intrinsic Cdt1 DNA binding activity. J Biol Chem 277: 40871–40880 [DOI] [PubMed] [Google Scholar]
- Zhu W, Chen Y, Dutta A (2004) Rereplication by depletion of geminin is seen regardless of p53 status and activates a G2/M checkpoint. Mol Cell Biol 24: 7140–7150 [DOI] [PMC free article] [PubMed] [Google Scholar]
Associated Data
This section collects any data citations, data availability statements, or supplementary materials included in this article.
Supplementary Materials
Supplementary Figure S1
Supplementary Figure S2
Supplementary Information: Material and Methods