

Abstract
The β2-adrenergic receptors (β2ARs) play a role in renal Na+ regulation. Subjects homozygous for glycine at amino acid 16 (Gly16) of the β2AR have been shown to have enhanced β2-mediated vascular relaxation when compared to subjects homozygous for arginine (Arg16). However, Gly16 subjects have been shown to have higher blood pressure than Arg16 subjects. Given the dominant role of the kidneys in long-term blood pressure regulation, we sought to determine whether there were differences in renal Na+ handling between Gly16 (n = 17) and Arg16 (n = 14) subjects (Gly16: age, 30 ± 2 years; body mass index (BMI), 25 ± 11 kg m−2; Arg16: age, 30 ± 2 years; BMI, 25 ± 1 kg m−2). We measured urinary Na+ content before and for 3 h following rapid intravenous saline infusion (30 ml kg−1 in ∼16 min). Prior to the infusion, there were no differences in 24-h Na+ excretion between Gly16 and Arg16 subjects (Gly16, 183 ± 21 mmol; Arg16, 184 ± 20 mmol); however, systolic blood pressure (SBP) was significantly higher in Gly16 than Arg16 subjects with no differences observed in diastolic blood pressure (DBP) or mean arterial pressure (MAP) (SBP: Gly16, 117 ± 3 mmHg; Arg16, 109 ± 2 mmHg; DBP: Gly16, 78 ± 2 mmHg; Arg16, 77 ± 2 mmHg; MAP: Gly16, 90 ± 2 mmHg; Arg16, 89 ± 2 mmHg). With rapid saline infusion, MAP increased in both genotype groups (Gly16, 6.7%; Arg16, 3.4%; P > 0.05). In the 3 h following Na+ infusion, Na+ excretion was less in Gly16 when compared to Arg16 subjects, with a trend towards significance when expressed as total Na+ excreted (Gly16, 66 ± 7 mmol; Arg16, 85 ± 9 mmol; P = 0.07), and a significant difference when expressed as a fraction of the administered load (Gly16, 0.18 ± 0.02; Arg16, 0.28 ± 0.03; P < 0.01). These results suggest that the Arg16Gly polymorphism of the β2AR is associated with differences in natriuretic response to rapid saline infusion, which may influence long-term regulation of blood pressure.
The β2-adrenergic receptors (β2ARs) are located throughout the body including the heart, blood vessels and kidneys. In the heart, the β2ARs have been localized to the ventricular walls and primarily regulate ventricular contractility (Bristow et al. 1989; Brodde, 1991; Bittner et al. 1997; Grandy et al. 2004). The β2ARs have also been localized to the vascular tissue and are the primary adrenergic receptor causing vasodilatation upon stimulation with endogenous catecholamines (O'Donnell & Wanstall, 1984; Gaballa et al. 1998; Chruscinski et al. 1999; Iaccarino et al. 2002). The β2ARs are also located in the kidneys and enhance sodium reabsorption through increased renal epithelial sodium channel (ENaC) activity (Koepke & DiBona, 1986; Shimkets et al. 1994; DiBona & Kopp, 1997; Pradervand et al. 1999; Snyder, 2000; Wallace et al. 2001, 2004).
Several polymorphisms of the β2AR have been studied in humans. The most functional variant of the β2AR appears to be an isoleucine substitution for threonine at position 164; however, this occurs in less than 3% of Caucasians (Green et al. 1995). An arginine (Arg) to glycine (Gly) substitution at amino acid 16 and a glutamine to glutamate substitution at amino acid 27 have also been described and studied in detail (Green et al. 1993, 1994, 1995). Human studies suggest that subjects homozygous for Arg at amino acid 16 (Arg16) may have reduced β2AR function when compared to subjects homozygous for Gly at this position (Gly16) (Dishy et al. 2001; Garovic et al. 2003; Tang et al. 2003; Eisenach et al. 2005; Snyder et al. 2005a 2006).
Specifically, Arg16 subjects show attenuated vasodilatation during infusion of a β-agonist in the brachial artery and venous circulation when compared to Gly16 subjects (Dishy et al. 2001; Garovic et al. 2003). Although Arg16 subjects tend to have reduced vasodilatation when compared to Gly16 subjects, we have previously found that the Arg16 group had lower arterial blood pressure, which was not dependent on differences in cardiac output between the genotype groups (Bray et al. 2000; Snyder et al. 2005a). Therefore, our observed difference in blood pressure between the genotype groups might be attributed to differences in renal sodium handling (Snyder et al. 2005b).
In this context, we sought to determine whether there was an association between genetic variation of the β2AR at amino acid 16 and the natriuretic response to rapid fluid loading. We hypothesized that subjects homozygous for glycine at amino acid 16 of the β2AR would have greater sodium reabsorption and therefore less sodium excretion when compared to subjects homozygous for arginine at this position following rapid fluid loading.
Methods
Subjects
The protocol was reviewed and approved by the Mayo Clinic Institutional Review Board, all participants provided informed consent prior to participation, and all aspects of the study conformed to the Declaration of Helsinki. Caucasian subjects who were matched for age, sex and level of physical activity were recruited from a pool of subjects previously genotyped for the Arg16Gly polymorphism of the β2AR (Bray et al. 2000).
Protocol
The study involved two separate experimental sessions, one for screening and the second for rapid saline infusion. The screening tests included an incremental cycle ergometry test to exhaustion (to rule out cardiovascular abnormalities), a complete blood count (CBC, to rule out anaemia) and, in women, a pregnancy test. The maximal cycle ergometry test was performed while oxygen uptake ( ) and the elimination of carbon dioxide were measured continuously (Medical Graphics, St Paul, MN, USA). Two-minute increments were used for the cycle ergometry test until a perceived exertion rating of 18 (out of a possible 20) was achieved (Borg, 1982). Following the screening tests, the subjects were given a 24-h urine collection container for the assessment of urine Na+ and creatinine (Cr) levels prior to their saline infusion test. At the end of the screening session, the subjects were instructed by a dietician how to maintain their usual sodium intake until the completion of the study.
Saline infusion
The subjects were instructed to report to the laboratory in a fasting state and all saline infusions were performed between 07.00 and 09.00 h. An 18-gauge venous catheter was inserted into a prominent antecubital vein for the rapid saline infusion and for blood sampling. Baseline measurements of cardiac output (CO), heart rate (HR) and systolic (SBP) and diastolic blood pressure (DBP) were obtained prior to the infusion. The subjects were instructed to void their bladders immediately before the infusion, and warmed saline was then infused intravenously (30 ml kg−1 over ∼15 min). During the saline infusion, oxygen saturation (SaO2), blood pressure (BP), HR and physical symptoms were continuously monitored and recorded every 2 min. Catecholamine (adrenaline and noradrenaline) levels were measured before and immediately after saline infusion from samples collected via the venous catheter. Following the infusion, repeat measures of CO and HR were obtained. Urine was collected every hour for 3 h following the infusion for the assessment of Na+ and Cr levels.
Data collection
Assessment of cardiovascular function
CO was assessed with a previously validated 8- to 10-breath acetylene rebreath technique using a 5-l anaesthesia bag containing 0.7% C2H2 and 9% He (Johnson et al. 2000; Bell et al. 2003). Briefly, a pneumotachograph was connected to a non-rebreathing Y-valve (Hans Rudolph, KC, MO) with the inspiratory port connected to a pneumatic switching valve (Hans Rudolph) which allowed for rapid switching from room air to the test gas mixture. Gases were sampled using a mass spectrometer (Perkin-Elmer) which was integrated with custom-made analysis software for the assessment of CO.
Blood pressure was recorded using the auscultation technique with the same technician performing all measures. Mean arterial pressure (MAP) was calculated using the equation: MAP = DBP + 1/3(SBP − DBP). Systemic vascular resistance (SVR) was calculated from MAP using the equation: SVR = MAP/CO. Heart rate was assessed using 12-lead electrocardiography (Marquette Electronics, Milwaukee, WI, USA).
Urine and plasma sodium and creatinine levels
Urinary Na+ and Cr levels were determined with a 24-h collection prior to the saline infusion and a 3-h collection immediately following the saline infusion. For each urine collection, the time of collection and the volume and amount of Na+ and Cr were recorded and assessed. In addition, plasma Na+ and Cr levels were determined prior to the saline infusion. Both urine and plasma Na+ and Cr levels were assessed using ion-selective electrodes on a Hitachi 911 analyser (Roche, Indianapolis, IN, USA). The fractional excretion of sodium (FENa) was determined using the following equation:
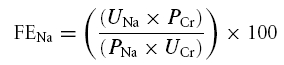 |
where UNa and UCr are the urinary sodium and creatinine concentrations, respectively, and the PNa and PCr are the plasma sodium and creatinine concentrations, respectively.
Catecholamines
Adrenaline (ADR) and noradrenaline (NA) levels were assessed according to methods developed in the Mayo Clinic General Clinical Research Center immunochemical core laboratory and the methods of Sealey (1991). For ADR, our intra-assay coefficients of variation were 12.2% and 3.6% at 13.8 and 242 pg ml−1. Inter-assay coefficients of variation were 8.5% and 6.3% at 179 and 390 pg ml−1.
Data analysis
All statistical comparisons were performed using the SPSS statistical software package (v. 12.0, Chicago, IL, USA). Group demographics were compared using an independent samples Student's t test with an α level of 0.05 to determine significance. A repeated measures ANOVA was performed to determine within group responses to rapid saline infusion, also with an α level of 0.05 to determine significance. An independent samples t test was used to compare group differences in HR, BP and the natriuretic response to saline infusion with an α level of 0.05 to determine significance for each. Before each t test and ANOVA, a Levene's test was performed to determine the homogeneity of the data. All data are presented as means ± s.e.m., unless otherwise stated.
Results
Subjects
Individuals who were homozygous for Arg16 (n = 14) and Gly16 (n = 17) agreed to participate in the study and had no exclusion criteria. All subjects were healthy non-smokers, and not on medications. There were no differences between the genotype groups in age, weight, body mass index, body surface area or cardiovascular fitness; however, the Gly16 group was taller than the Arg16 group (Table 1).
Table 1.
Subject characteristics
| Characteristic | Arg16 (n = 14) | Gly16 (n = 17) |
|---|---|---|
| Sex (female/male) | 4/10 | 3/14 |
| Age (year) | 30 ± 2 | 30 ± 2 |
| Height (cm) | 174 ± 2 | 180 ± 2* |
| Weight (kg) | 75 ± 4 | 82 ± 3 |
| Body mass index (kg m−2) | 25 ± 1 | 25 ± 1 |
| Body surface area (m2) | 21 ± 1 | 22 ± 1 |
 Peak (ml kg−1 min−1) Peak (ml kg−1 min−1) |
37 ± 2 | 40 ± 2 |
Values are means ± s.e.m.
P < 0.05 Arg16 versus Gly16.
Physiological response to rapid saline infusion
At baseline, the Gly16 group had a higher systolic blood pressure than the Arg16 group but there were no significant differences in DBP, MAP, HR or SaO2 (Table 2). In addition, the Gly16 group had a higher CO and a lower SVR compared to the Arg16 group at baseline (Fig. 1). Rapid saline infusion resulted in an increase in ADR and NA levels but there were no differences between the genotype groups in these responses (baseline ADR: Arg16, 20 ± 4 3 pg ml−1; Gly16, 16 ± 3 pg ml−1; post-saline ADR: Arg16, 56 ± 13 3 pg ml−1; Gly16, 33 ± 7 pg ml−1; baseline NA: Arg16, 150 ± 15 3 pg ml−1; Gly16, 192 ± 27 pg ml−1, post-saline NA: Arg16, 329 ± 64 3 pg ml−1; Gly16, 325 ± 49 pg ml−1). Both groups exhibited increases in HR, SBP and MAP with saline infusion (as a percentage increase relative to the baseline level), but there were no differences between the genotype groups in these responses (HR: Arg16, 24 ± 7%; Gly16, 18 ± 4%; SBP: Arg16, 10 ± 3%; Gly16, 8 ± 3%, MAP: Arg16, 4 ± 2%; Gly16, 6 ± 3%). Both groups showed an increase in CO and decrease in SVR with rapid saline infusion, and at the end of the infusion, CO remained higher and SVR lower in the Gly16 group compared to the Arg16 group.
Table 2.
Physiological response to rapid saline infusion
| Baseline | Fluid challenge | |||
|---|---|---|---|---|
| Arg16 | Gly16 | Arg16 | Gly16 | |
| n | 14 | 17 | 14 | 17 |
| Infusion amount (ml) | — | — | 2083 ± 233 (15.5 min) | 2430 ± 171 (17.1 min) |
| Sodium infused (mmol) | — | — | 321 ± 24 | 374 ± 13* |
| HR (beats min−1) | 62 ± 3 | 58 ± 2 | 76 ± 4† | 66 ± 3† |
| SBP (mmHg) | 109 ± 2 | 117 ± 3* | 121 ± 4† | 126 ± 3† |
| DBP (mmHg) | 78 ± 2 | 76 ± 2 | 78 ± 3 | 79 ± 2 |
| MAP (mmHg) | 89 ± 2 | 90 ± 2 | 92 ± 3 | 96 ± 3† |
| O2 saturation (%) | 97 ± 1 | 98 ± 1 | 98 ± 1 | 98 ± 1 |
| Chest tightness (out of 4) | 0 | 0 | 0.8 ± 0.3† | 1.2 ± 0.3† |
| Shortness of breath (out of 4) | 0 | 0 | 0.6 ± 0.4† | 0.9 ± 0.3† |
Values are means ± s.e.m.
P < 0.05 Arg16 versus Gly16
P < 0.05 compared to baseline. HR, heart rate; SBP, systolic blood pressure; DBP, diastolic blood pressure; MAP, mean arterial pressure.
Figure 1. Change in mean arterial pressure, cardiac output and calculated systemic vascular resistance in response to rapid saline infusion.
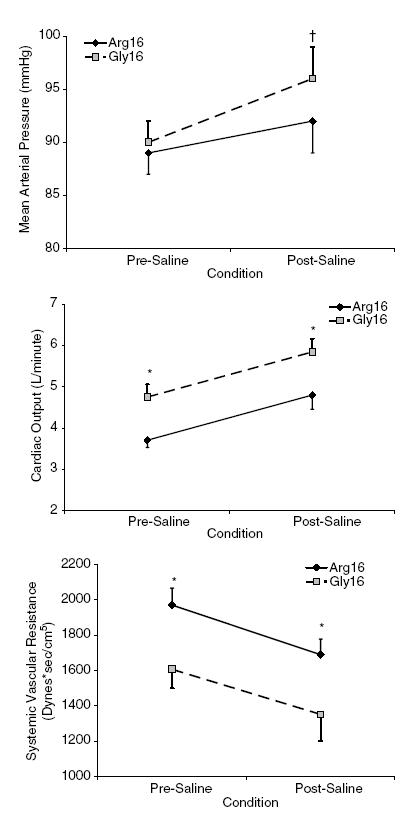
Mean arterial pressure (top panel), cardiac output (middle panel) and systemic vascular resistance (bottom panel) for Arg16 subjects (n = 14; ▒—▒) and Gly16 subjects (n = 17; ♦—♦). *P < 0.05 Arg16 versus Gly16; †P < 0.05 versus baseline.
Natriuretic response to rapid saline infusion
There were no differences in 24-h Na+ excretion between the Gly16 and Arg16 groups in the collection that was completed just prior to the infusion (Gly16, 183 ± 21 mmol; Arg16, 184 ± 20 mmol). On average, 2083 ml saline was infused in the Arg16 subjects over 16 min, while 2430 ml saline was infused in the Gly16 subjects over 17 min. The amount of Na+ infused averaged 321 mmol for the Arg16 subjects and 374 mmol for the Gly16 group, because the Gly16 group was slightly heavier (Arg16, 75 ± 4 kg; Gly16, 82 ± 3 kg; P = 0.16). Within 3 h after the infusion, the Arg16 group excreted 29% more Na+ than the Gly16 group, but the difference did not reach statistical significance (Fig. 2). The amount of Na+ excreted relative to the amount of Na+ infused was greatest in the Arg16 group (Arg16, 0.28 ± 0.03; Gly16, 0.18 ± 0.02, P < 0.01, Fig. 3). There were no differences in FENa during the 24-h urine collection or following rapid saline infusion; however, there was a trend towards increased FENa in the Arg16 group (Fig. 4).
Figure 2. Urinary sodium excretion following rapid saline infusion according to genotype.
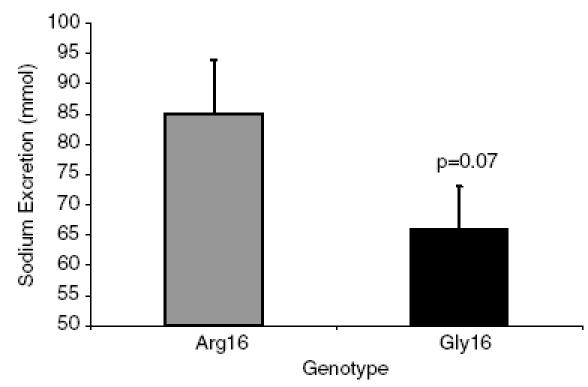
Na+ excretion (mmol) for the 3 h following rapid saline infusion in the Arg16 group (▒) and the Gly16 group (▪).
Figure 3. Urinary sodium excretion relative to sodium load with rapid saline infusion according to genotype.
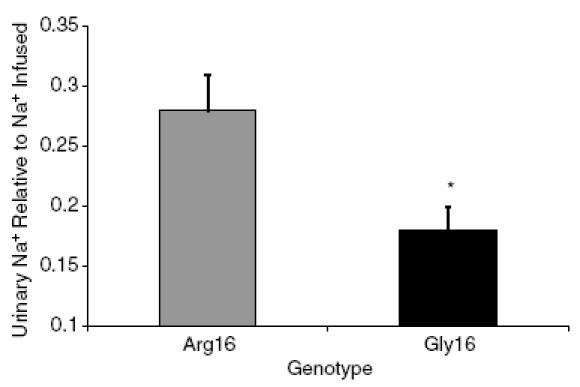
relative Na+ excretion for the 3 h following rapid saline infusion in the Arg16 group (▒) and the Gly16 group (▪). *P < 0.01 Arg16 versus Gly16.
Figure 4. Fractional excretion of sodium according to genotype.
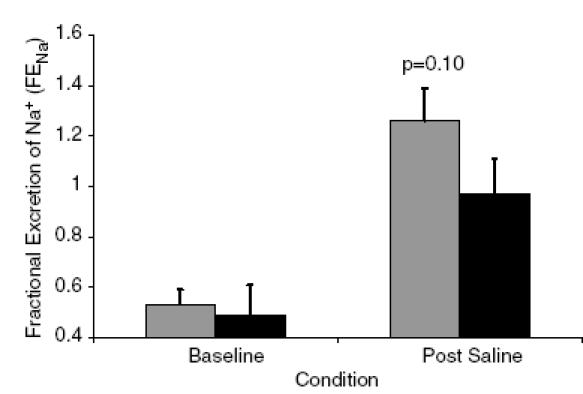
Fractional excretion of Na+ in the Arg16 group (▒) and the Gly16 group (▪).
Discussion
We found that the Arg16 group had a greater natriuretic response to rapid saline infusion when compared to the Gly16 group. Of interest, we also found that the Gly16 group had higher CO and SBP, and lower SVR at baseline and following rapid saline infusion. This is similar to previous results by our group and others demonstrating that CO, and vasodilatation are greater in the Gly16 group when compared to the Arg16 group (Garovic et al. 2003; Tang et al. 2003; Eisenach et al. 2004, 2005; Snyder et al. 2005a, 2006). It is interesting that there were differences in urinary Na+ content following rapid saline infusion but not at baseline, possibly suggesting an increase in catecholamine levels (as were seen in the present study) are necessary to induce these differences between the genotype groups. This difference following catecholamine stimulation may reflect differences in receptor desensitization and/or density between these genotype groups (Snyder et al. 2006).
Epithelial Na+ channels
The ENaCs are found throughout the body including the lungs and the kidneys (Ciampolillo et al. 1996; Wallace et al. 2001, 2004; Planes et al. 2002). In the lungs the ENaCs are located on type-II alveolar cells and act to move Na+ and water from the alveolar airspace into the interstitium (Planes et al. 2002). In the kidneys, the ENaCs have been localized to the distal nephron and are thought to play a role in Na+ and blood pressure regulation (Koepke & DiBona, 1986; Snyder, 2000; Wallace et al. 2001, 2004). The importance of the ENaCs in renal sodium regulation and long-term blood pressure control is seen in psuedohypoaldosteronism type-1 and Liddle's syndrome. Psuedohypoaldosteronism type-1 is a loss-of-function mutation of the renal ENaCs which results in salt-wasting, whereas Liddle's syndrome is a gain-of-function mutation of the renal ENaC which results in increased salt-sensitivity and hypertension in humans (Shimkets et al. 1994; Kerem et al. 1999; Pradervand et al. 1999; Snyder, 2000). Although the renal ENaCs are primarily regulated by aldosterone, recent evidence has suggested that the β2ARs also play an important role in renal Na+ regulation (Wallace et al. 2001, 2004).
β2-Adrenergic control of renal ENaCs
In the kidneys, the β2ARs have been localized to the inner-medullary collecting duct (IMCD) and influence sodium reabsorption both locally in response to circulating ADR as well as through central nervous system-mediated mechanisms (Koepke & DiBona, 1986; DiBona & Kopp, 1997; Wallace et al. 2004). Stimulation of the β2ARs results in an increase in cAMP which increases the number of ENaCs on cell surfaces, or the probability that an ENaC will be open (Chen et al. 2001; Xi-Juan et al. 2002). Wallace et al. (2004) have recently elucidated three important facts that relate to β2AR control of sodium reabsorption: (1) the β2ARs are located on IMCD cells; (2) stimulation of the β2ARs on these cells leads to an increase in cAMP; and (3) stimulation of the β2ARs on IMCD cells augments anion secretion which is nearly abolished with β-blockade.
In the present study we attempted to minimize the catecholamine response by warming the saline to body temperature just prior to the infusion; however, there was an increase in ADR and NA levels with the rapid fluid loading. This increase in catecholamine levels is most probably a result of mental stress caused by the infusion (and the discomfort associated with the infusion, i.e. chest tightness and shortness of breath).
Genetic variation of the β2AR and blood pressure regulation
Previous research has suggested an association between the Gly16 allele of the β2AR and elevated blood pressure in humans (Gratze et al. 1999; Bray et al. 2000; Snyder et al. 2005a). However, other studies have suggested a lack of relationship between genetic variation of the β2AR and hypertension (Herrmann et al. 2002) or have associated the Arg16 allele with elevated blood pressure (Gratze et al. 1999). The findings of the present study confirm previous work from our laboratory showing that the Gly16 group has elevated blood pressure when compared to the Arg16 group (Snyder et al. 2006). Because of the contribution of Na+ reabsorption, CO and SVR to blood pressure regulation, the observed difference in blood pressure could be the result of differences in CO, although we have previously found that this does not fully explain the genotype related-differences (Snyder et al. 2005a). Genotype-related differences in SVR would also not explain why the Gly16 group has previously been shown to have elevated blood pressure. Previous work by us (Snyder et al. 2006) and others (Tang et al. 2003) suggests that the Gly16 group has enhanced receptor function, which would lower SVR as a result of peripheral vasodilatation, and lead to lower blood pressure.
Interestingly, we observed genotype-related differences in the natriuretic response to rapid saline infusion. Urinary Na+ excretion and FENa were borderline significant (P = 0.07 and 0.10, respectively); however, the amount of Na+ excreted relative to the amount of Na+ infused did reach statistical significance (P < 0.01). These findings of differences in the natriuretic response to saline infusion suggest that the genotype-related difference in blood pressure may be related to not only augmented CO but also increased Na+ reabsorption in the Gly16 group.
Limitations
A possible limitation to this study is the use of variation at one site of the β2AR for comparison, rather than several sites. Although the use of single nucleotide polymorphisms (SNPs) is falling out of favour, we and others have been able to repeatedly reject the null hypothesis when examining phenotypic variation according to position 16. Of interest, recently Lanfear et al. (2005) found that Arg16 subjects had higher mortality rates when compared to Gly16 subjects following acute coronary syndrome when discharged with β-blockade; however a specific reason for this difference was unclear. This larger clinical study underscores the importance of smaller mechanistic studies using SNPs to explain phenotypic differences which become particularly important in the clinical setting.
Implications
In a companion paper in this issue by Eisenach et al. (2006) salt restriction modified the genotype effect on vascular function, in agreement with previous observations (Garovic et al. 2003; Eisenach et al. 2004). Specifically, Eisenach et al. found that salt restriction increased SVR in Gly16 subjects and found that this intervention eliminated the previously observed augmentation in forearm blood flow in the Gly16 subjects relative to the Arg16 subjects (Garovic et al. 2003). This is an important finding and is probably related to the results of the present study. One could hypothesize that, under conditions of normal Na+ intake, Gly16 subjects have enhanced vascular relaxation which acts as a protective mechanism due to the higher Na+ reabsorption compared to Arg16 subjects. In contrast, with Na+ restriction, the Gly16 subjects have a reduction in vascular relaxation because of an attenuation in Na+ reabsorption. This hypothesis is supported by the work of Naslund et al. (1990), who found that Na+ restriction decreased forearm blood flow in response to addition of isoprenaline (isoproterenol), which was related to β2AR function in vitro. The study by Eisenach and colleagues and the present study add to the growing body of evidence that common polymorphisms of the β2AR influence BP regulation.
Conclusion
We found that subjects homozygous for glycine at amino acid 16 of the β2AR had an attenuated natriuretic response to rapid saline infusion when compared to subjects homozygous for arginine at this position. In addition, we found that the Gly16 group had higher baseline SBP when compared to the Arg16 group. These findings suggest that the elevated blood pressure observed in the Gly16 group in this and previous studies may be a result of increased renal Na+ reabsorption due to enhanced β2AR function and increased renal ENaC activity.
Acknowledgments
This work was supported by National Institutes of Health Grants HL71478, HL54464, HL63328 and DK073537, and American Heart Association(AHA) Grant 56051Z. We would like to Kathy O'Malley, Angela Heydman and Minelle Hulsebus for their help with data collection, as well as the efforts of the study participants. We would also like to thank the staff of the General Clinical Research Center (GCRC) for their assistance throughout this study. The Mayo Clinic GCRC is supported by US Public Health Service grant M01-RR00585.
References
- Bell C, Monahan KD, Donato AJ, Hunt BE, Seals DR, Beck KC. Use of acetylene breathing to determine cardiac output in young and older adults. Med Sci Sports Exerc. 2003;35:58–64. doi: 10.1097/00005768-200301000-00010. [DOI] [PubMed] [Google Scholar]
- Bittner HB, Chen EP, Milano CA, Lefkowitz RJ, Van Trigt P. Functional analysis of myocardial performance in murine hearts overexpressing the human beta 2-adrenergic receptor. J Mol Cell Cardiol. 1997;29:961–967. doi: 10.1006/jmcc.1996.0339. [DOI] [PubMed] [Google Scholar]
- Borg GAV. A category scale with ratio properties for intermodal and interindividual comparisons. In: Geissler HG, Petzold P, editors. Psychophysial Judgement and the Process of Perception. Berlin: Veb Deutsche Verlag Wissen Schaften; 1982. pp. 25–34. [Google Scholar]
- Bray MS, Krushkal J, Li L, Ferrell R, Kardia S, Sing CF, Turner ST, Boerwinkle E. Positional genomic analysis identifies the beta2-adrenergic receptor gene as a susceptibility locus for human hypertension. Circulation. 2000;101:2877–2882. doi: 10.1161/01.cir.101.25.2877. [DOI] [PubMed] [Google Scholar]
- Bristow MR, Hershberger RE, Port JD, Minobe W, Rasmussen R. Beta 1- and beta 2-adrenergic receptor-mediated adenylate cyclase stimulation in nonfailing and failing human ventricular myocardium. Mol Pharmacol. 1989;35:295–303. [PubMed] [Google Scholar]
- Brodde OE. Beta 1- and beta 2-adrenoceptors in the human heart: properties, function, and alterations in chronic heart failure. Pharmacol Rev. 1991;43:203–242. [PubMed] [Google Scholar]
- Chen X, Eaton DC, Jain L. Alveolar epithelial ion and fluid transport B-adrenergic regulation of amiloride-sensitive lung sodium channels. Am J Physiol Lung Cell Mol Physiol. 2001;282:L609–L620. doi: 10.1152/ajplung.00356.2001. [DOI] [PubMed] [Google Scholar]
- Chruscinski AJ, Rohrer DK, Schauble E, Desai KH, Bernstein D, Kobilka BK. Targeted disruption of the beta2 adrenergic receptor gene. J Biol Chem. 1999;274:16694–16700. doi: 10.1074/jbc.274.24.16694. [DOI] [PubMed] [Google Scholar]
- Ciampolillo F, McCoy DE, Green RB, Karlson KH, Dagenais A, Molday RS, Stanton BA. Cell-specific expression of amiloride-sensitive, Na+-conducting ion channels in the kidney. Am J Physiol. 1996;271:C1303–C1315. doi: 10.1152/ajpcell.1996.271.4.C1303. [DOI] [PubMed] [Google Scholar]
- DiBona GF, Kopp UC. Neural control of renal function. Physiol Rev. 1997;77:75–197. doi: 10.1152/physrev.1997.77.1.75. [DOI] [PubMed] [Google Scholar]
- Dishy V, Sofowora GG, Xie HG, Kim RB, Byrne DW, Stein CM, Wood AJ. The effect of common polymorphisms of the beta2-adrenergic receptor on agonist-mediated vascular desensitization. N Engl J Med. 2001;345:1030–1035. doi: 10.1056/NEJMoa010819. [DOI] [PubMed] [Google Scholar]
- Eisenach JH, Barnes SA, Pike TL, Sokolnicki LA, Masuki S, Dietz NM, Rehfeldt KH, Turner ST, Joyner MJ. The Arg16/Gly beta2-adrenergic receptor polymorphism alters the cardiac output response to isometric exercise. J Appl Physiol. 2005;99:1776–1781. doi: 10.1152/japplphysiol.00469.2005. [DOI] [PubMed] [Google Scholar]
- Eisenach JH, Darrell RS, Pike TL, Johnson CP, Snyder ER, et al. Dietary sodium restriction and β2-adrenergic receptor polymorphism modulate cardiovascular function in humans. J Physiol. 2006;574:955–965. doi: 10.1113/jphysiol.2006.112102. [DOI] [PMC free article] [PubMed] [Google Scholar]
- Eisenach JH, McGuire AM, Schwingler RM, Turner ST, Joyner MJ. The Arg16/Gly beta2-adrenergic receptor polymorphism is associated with altered cardiovascular responses to isometric exercise. Physiol Genomics. 2004;16:323–328. doi: 10.1152/physiolgenomics.00152.2003. [DOI] [PubMed] [Google Scholar]
- Gaballa MA, Peppel K, Lefkowitz RJ, Aguirre M, Dolber PC, Pennock GD, Koch WJ, Goldman S. Enhanced vasorelaxation by overexpression of beta 2-adrenergic receptors in large arteries. J Mol Cell Cardiol. 1998;30:1037–1045. doi: 10.1006/jmcc.1998.0668. [DOI] [PubMed] [Google Scholar]
- Gavoric VD, Joyner MJ, Dietz NM, Boerwinkle E, Turner ST. Beta2-adrenergic receptor polymorphism and nitric oxide-dependent forearm blood flow responses to isoproterenol in humans. J Physiol. 2003;546:583–589. doi: 10.1113/jphysiol.2002.031138. [DOI] [PMC free article] [PubMed] [Google Scholar]
- Grandy SA, Denovan-Wright EM, Ferrier GR, Howlett SE. Overexpression of human beta2-adrenergic receptors increases gain of excitation-contraction coupling in mouse ventricular myocytes. Am J Physiol Heart Circ Physiol. 2004;287:H1029–H1038. doi: 10.1152/ajpheart.00814.2003. [DOI] [PubMed] [Google Scholar]
- Gratze G, Fortin J, Labugger R, Binder A, Kotanko P, Timmermann B, Luft FC, Hoehe MR, Skrabal F. Beta-2 adrenergic receptor variants affect resting blood pressure and agonist-induced vasodilation in young adult Caucasians. Hypertension. 1999;33:1425–1430. doi: 10.1161/01.hyp.33.6.1425. [DOI] [PubMed] [Google Scholar]
- Green SA, Cole G, Jacinto M, Innis M, Liggett SB. A polymorphism of the human beta 2-adrenergic receptor within the fourth transmembrane domain alters ligand binding and functional properties of the receptor. J Biol Chem. 1993;268:23116–23121. [PubMed] [Google Scholar]
- Green SA, Turki J, Hall IP, Liggett SB. Implications of genetic variability of human beta 2-adrenergic receptor structure. Pulm Pharmacol. 1995;8:1–10. doi: 10.1006/pulp.1995.1001. [DOI] [PubMed] [Google Scholar]
- Green SA, Turki J, Innis M, Liggett SB. Amino-terminal polymorphisms of the human beta 2-adrenergic receptor impart distinct agonist-promoted regulatory properties. Biochemistry. 1994;33:9414–9419. doi: 10.1021/bi00198a006. [DOI] [PubMed] [Google Scholar]
- Herrmann SM, Nicaud V, Tiret L, Evans A, Kee F, Ruidavets JB, Arveiler D, Luc G, Morrison C, Hoehe MR, Paul M, Cambien F. Polymorphisms of the beta2-adrenoceptor (ADRB2) gene and essential hypertension: the ECTIM and PEGASE studies. J Hypertens. 2002;20:229–235. doi: 10.1097/00004872-200202000-00012. [DOI] [PubMed] [Google Scholar]
- Iaccarino G, Cipolletta E, Fiorillo A, Annecchiarico M, Ciccarelli M, Cimini V, Koch WJ, Trimarco B. Beta2-adrenergic receptor gene delivery to the endothelium corrects impaired adrenergic vasorelaxation in hypertension. Circulation. 2002;106:349–355. doi: 10.1161/01.cir.0000022690.55143.56. [DOI] [PubMed] [Google Scholar]
- Johnson BD, Beck KC, Proctor DN, Miller J, Dietz NM, Joyner MJ. Cardiac output during exercise by the open circuit acetylene washin method: comparison with direct Fick. J Appl Physiol. 2000;88:1650–1658. doi: 10.1152/jappl.2000.88.5.1650. [DOI] [PubMed] [Google Scholar]
- Kerem E, Bistritzer T, Hanukoglu A, Hofmann T, Zhou Z, Bennett W, MacLaughlin E, Barker P, Nash M, Quittell L, Boucher R, Knowles MR. Pulmonary epithelial sodium-channel dysfunction and excess airway liquid in pseudohypoaldosteronism. N Engl J Med. 1999;341:156–162. doi: 10.1056/NEJM199907153410304. [DOI] [PubMed] [Google Scholar]
- Koepke JP, Dibona GF. Central adrenergic receptor control of renal function in conscious hypertensive rats. Hypertension. 1986;8:133–141. doi: 10.1161/01.hyp.8.2.133. [DOI] [PubMed] [Google Scholar]
- Lanfear DE, Jones PG, Marsh S, Cresci S, McLeod HL, Spertus JA. Beta2-adrenergic receptor genotype and survival among patients receiving beta-blocker therapy after an acute coronary syndrome. JAMA. 2005;294:1526–1533. doi: 10.1001/jama.294.12.1526. [DOI] [PubMed] [Google Scholar]
- Naslund T, Silberstein DJ, Merrell WJ, Nadeau JH, Wood AJ. Low sodium intake corrects abnormality in beta-receptor-mediated arterial vasodilation in patients with hypertension: correlation with beta-receptor function in vitro. Clin Pharmacol Ther. 1990;48:87–95. doi: 10.1038/clpt.1990.121. [DOI] [PubMed] [Google Scholar]
- O'Donnell SR, Wanstall JC. Beta-1 and beta-2 adrenoceptor-mediated responses in preparations of pulmonary artery and aorta from young and aged rats. J Pharmacol Exp Ther. 1984;228:733–738. [PubMed] [Google Scholar]
- Planes C, Blot-Chabaud M, Matthay MA, Couette S, Uchida T, Clerici C. Hypoxia and beta 2-agonists regulate cell surface expression of the epithelial sodium channel in native alveolar epithelial cells. J Biol Chem. 2002;277:47318–47324. doi: 10.1074/jbc.M209158200. [DOI] [PubMed] [Google Scholar]
- Pradervand S, Barker PM, Wang Q, Ernst SA, Beermann F, Grubb BR, Burnier M, Schmidt A, Bindels RJ, Gatzy JT, Rossier BC, Hummler E. Salt restriction induces pseudohypoaldosteronism type 1 in mice expressing low levels of the beta-subunit of the amiloride-sensitive epithelial sodium channel. Proc Natl Acad Sci U S A. 1999;96:1732–1737. doi: 10.1073/pnas.96.4.1732. [DOI] [PMC free article] [PubMed] [Google Scholar]
- Sealey JE. Plasma renin activity and plasma prorenin assays. Clin Chem. 1991;37:1811–1819. [PubMed] [Google Scholar]
- Shimkets RA, Warnock DG, Bositis CM, Nelson-Williams C, Hansson JH, Schambelan M, et al. Liddle's syndrome: heritable human hypertension caused by mutations in the beta subunit of the epithelial sodium channel. Cell. 1994;79:407–414. doi: 10.1016/0092-8674(94)90250-x. [DOI] [PubMed] [Google Scholar]
- Snyder EM, Beck KC, Dietz NM, Eisenach JH, Joyner MJ, Turner ST, Johnson BD. Arg16Gly polymorphism of the beta-2 adrenergic receptor is associated with differences in cardiovascular function at rest and during exercise in humans. J Physiol. 2005a;571:121–130. doi: 10.1113/jphysiol.2005.098558. [DOI] [PMC free article] [PubMed] [Google Scholar]
- Snyder EM, Joyner MJ, Turner ST, Johnson BD. Blood pressure variation in healthy humans: a possible interaction with beta-2 adrenergic receptor genotype and renal epithelial sodium channels. Med Hypotheses. 2005b;65:296–299. doi: 10.1016/j.mehy.2004.12.031. [DOI] [PubMed] [Google Scholar]
- Snyder EM, Hulsebus ML, Turner ST, Joyner MJ, Johnson BD. Genotype related differences in beta-2 adrenergic receptor density influence cardiac function. Med Sci Sports Exerc. 2006;38(5):882–886. doi: 10.1249/01.mss.0000218144.02831.f6. [DOI] [PubMed] [Google Scholar]
- Snyder PM. Liddle's syndrome mutations disrupt cAMP-mediated translocation of the epithelial Na+ channel to the cell surface. J Clin Invest. 2000;105:45–53. doi: 10.1172/JCI7869. [DOI] [PMC free article] [PubMed] [Google Scholar]
- Tang W, Devereux RB, Kitzman DW, Province MA, Leppert M, Oberman A, Hopkins PN, Arnett DK. The Arg16Gly polymorphism of the beta2-adrenergic receptor and left ventricular systolic function. Am J Hypertens. 2003;16:945–951. doi: 10.1016/s0895-7061(03)01001-x. [DOI] [PubMed] [Google Scholar]
- Wallace DP, Reif G, Hedge AM, Thrasher JB, Pietrow P. Adrenergic regulation of salt and fluid secretion in human medullary collecting duct cells. Am J Physiol Renal Physiol. 2004;287:F639–F648. doi: 10.1152/ajprenal.00448.2003. [DOI] [PubMed] [Google Scholar]
- Wallace DP, Rome LA, Sullivan LP, Grantham JJ. cAMP-dependent fluid secretion in rat inner medullary collecting ducts. Am J Physiol Renal Physiol. 2001;280:F1019–F1029. doi: 10.1152/ajprenal.2001.280.6.F1019. [DOI] [PubMed] [Google Scholar]