

Abstract
We have examined the function of a conserved serine residue (Ser670) in the S2 ligand-binding region of the NR2A N-methyl-d-aspartate (NMDA) receptor subunit, using recombinant NR1/NR2A receptors expressed in Xenopus laevis oocytes. Mutation of Ser670 to glycine (S670G) in NR2A reduced the potency of glutamate by 124-fold. Single-channel conductance and the duration of apparent open periods of NR2A(S670G) receptor mutants were, however, indistinguishable from wild-type NMDA receptors. NR1/NR2A(S670G) shut-time distributions were best described by a mixture of six exponential components, and the four shortest shut intervals of each distribution were considered to occur within a channel activation (burst). Bursts of single-channel openings were fitted with a mixture of four exponential components. The longest two components carried the majority of the charge transfer and had mean durations of 9.6 ± 0.5 and 29.6 ± 1.5 ms. The overall channel open probability during a burst was high (mean, 0.83 ± 0.06). Consistent with a shortening of NMDA receptor-channel burst lengths was the observation of an increased deactivation rate of macroscopic currents evoked by brief applications of glutamate to outside-out membrane patches. Correlations between shut times and adjacent open times were observed in all data records. Noticeably, shorter than average openings tended to occur next to long closed periods, whereas longer than average openings tended to occur next to short closings. Our single-channel data, together with modelling using a kinetic scheme to describe channel activations, support our hypothesis that the S670G point mutation reduces the dwell time of glutamate in its binding site.
Most ‘fast’ excitatory synapses in the mammalian central nervous system (CNS) involve l-glutamate acting at three classes of ion channel: α-amino-3-hydroxy-5-methyl-4-isoxazolepropionic acid (AMPA), kainate and NMDA receptor-channels. Of these, NMDA receptors are privileged in regulating postsynaptic calcium entry that triggers both normal and pathophysiological intracellular signalling (reviewed by Hardingham & Bading, 2003). NMDA receptors are thought to exist as hetero-oligomers of NR1 and NR2 subunits. The NR1 subunit is expressed ubiquitously in the CNS, exists in different splice isoforms, and binds the NMDA receptor co-agonist, glycine. Glutamate binds to the NR2 subunits, of which there are four subunits (termed NR2A–D). NR2 subunits underlie much of the functional diversity among NMDA receptors by regulating single-channel properties and gating kinetics (reviewed by Erreger et al. 2004; Chen & Wyllie, 2006). NMDA channel gating kinetics underlie the slow time course of glutamatergic excitatory postsynaptic currents (EPSCs). This feature contributes to the slow depolarization of a neurone following synaptic activation, synaptic integration, coincidence detection in Hebbian-type plasticity, and the temporal characteristics of calcium rises in postsynaptic neurones. Thus, the dwell time of glutamate on the NMDA receptor is pivotal to its function.
Crystallographic and structure–function studies have identified two domains in both NR1 and NR2 NMDA subunits that control the potency of glycine and glutamate (Williams et al. 1996; Laube et al. 1997, 2004; Anson et al. 1998, 2000; Furukawa & Gouaux, 2003; Chen et al. 2004, 2005; Furukawa et al. 2005; Hansen et al.; 2005 reviewed by Chen & Wyllie, 2006). The S1 domain, located upstream of the M1 region, and the S2 domain, between M3 and M4 regions, form a clamshell-like pocket in both NR1 and NR2 NMDA receptor subunits (see Fig. 1A). Previously, we identified one residue in the S2 domain of the NR2A subunit (Thr671) as contributing to glutamate potency and single-channel activation durations (Anson et al. 1998, 2000). In this study, we extend our analyses of this region at the level of macroscopic and single-channel current analyses, by mutating the neighbouring serine residue (Ser670). Ser670 is conserved in all NR2 NMDA receptor subunits and, like Thr671, is predicted to H-bond with the γ-carboxylate group of bound glutamate (Fig. 1B and C; Furukawa et al. 2005). Our data show that while the NR2A(S670G) mutation reduces glutamate potency to a lesser extent than the NR2A(T671A) mutation, the effects at the single-channel level are very similar.
Figure 1. Location of Ser670 in the NR2A NMDA receptor subunit and the effect of the S670G mutation on glutamate potency.

A, structure of the S1S2 ligand-binding pocket for the NR2A NMDA receptor subunit. The S1 and S2 binding domains form a hinged clamshell-like structure with the ligand-binding cavity nested between both regions. NR2A co-ordinates obtained from Furukawa et al. (2005; PDB accession code, 2A5S) and visualized using RasMol software. B, expanded view of the pocket with glutamate occupying its binding site. The residues Ser670 and Thr671, which are thought to form H-bonds with the γ-carboxyl group of the side-chain of glutamate, are illustrated. C, upper panel, linear representation of the structure of an NMDA receptor, showing the amino terminal domain (ATD), the two ligand-binding domains (S1 and S2), the four membrane-associated regions (M1–M4) and the carboxy terminal domain (CTD). Lower panel, partial amino acid alignments of the S2 domain of GluR2 AMPA receptors, the NR1 glycine-binding subunit and the four NR2 (A–D) glutamate-binding subunits. The conserved Ser and Thr residues in each of the subunits that bind glutamate are illustrated. D, glutamate concentration–response curves obtained from two-electrode voltage-clamp (TEVC) recordings obtained from oocytes expressing either NR2A(WT) (▪) or NR2A(S670G) NMDA receptor-channels (•) (n = 16 for each construct).
Methods
Plasmid constructs, cRNA synthesis and receptor expression in oocytes
The pSP64T-derived expression plasmids for rat NR1-1a (excluding exon 5, including exons 21 and 22, which we will refer to as ‘NR1’) and wild-type (WT) NR2A and NR2A(S670G) NMDA receptor subunits have been previously described (Chen et al. 2005). Complementary RNA (cRNA) was synthesized as run-off transcripts from Mlu I linearized plasmid DNA using the SP6 polymerase RiboMax RNA synthesis kit (Promega, Madison, WI, USA). Reactions were supplemented with 0.75 mm capping nucleotide, m 7G(5′)ppp(5′)G (Promega) in the presence of 1.6 mm GTP. Integrity and yield of each synthesized cRNA was verified by fluorescence intensity in ethidium bromide-stained agarose gels. For recombinant NMDA receptor expression, NR1 and one of either the NR2A or NR2A(S670G) cRNAs were mixed at a nominal ratio of 1:1 and diluted with nuclease-free water to 5 ng μl−1, prior to injection.
Following administration of a lethal dose of anaesthetic (immersion in a 0.5% solution of 3-amino-benzoic acid ethyl ester, followed by injection of sodium pentobarbitone), oocytes were removed from Xenopus laevis (in accordance with current UK Home Office requirements). The follicular membranes of the oocytes were removed, oocytes injected with cRNAs, and individual oocytes were placed in separate wells of 24-well plates containing a modified Barth's solution with composition (mm): NaCl, 88; KCl, 1; NaHCO3, 2.4; MgCl2, 0.82; CaCl2, 0.77; and Tris-Cl, 15; adjusted to pH 7.35 with NaOH (Sigma-Aldrich, UK). This solution was supplemented with 50 IU ml−1 penicillin and 50 mg ml−1 streptomycin (Invitrogen, Paisley, UK). Oocytes were placed in an incubator (19°C) for 24–48 h to allow for receptor expression and then stored at 4°C until they were used for electrophysiological measurements.
Two-electrode voltage-clamp recordings
Whole-cell responses to glutamate were measured with a two-electrode voltage-clamp amplifier (Geneclamp 500, Axon Instruments) at −60 mV. Current and voltage electrodes were made from thin-walled borosilicate glass (GC150TF-7.5, Harvard Apparatus,, Edenbridge, UK) using a PP-830 electrode puller (Narashige Instruments, Tokyo, Japan) and, when filled with 3 m KCl, possessed resistances of between 0.5 and 1.5 MΩ. Oocytes were perfused in a modified frog Ringer solution that contained (in mm): NaCl, 115; KCl, 2.5; Hepes, 10 and BaCl2, 1.8; pH adjusted to 7.3 with NaOH (Anson et al. 1998; Chen et al. 2004). All glutamate-containing solutions were supplemented with glycine (20 μm). Application of solutions was controlled manually, and data were filtered at 10 Hz, digitized at 100 Hz. Concentration–response curves were fitted individually for each oocyte with the Hill equation:
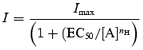 |
where nH is the Hill coefficient, Imax is the maximum current, [A] is the concentration of agonist, and EC50 is the concentration of agonist that produces a half-maximal response. Each data point was then normalized to the fitted maximum of the concentration–response curve. The normalized values were then pooled and averaged and refitted with the Hill equation (see Chen et al. 2005).
Single-channel recording, concentration jumps and simulation of NMDA receptor-mediated currents
Single-channel recordings were made from outside-out membrane patches excised from oocytes. Outside-out patches were held at −100 mV, and recordings were made in an external solution containing (mm): NaCl, 125; KCl, 3; NaH2PO4, 1.25; Hepes, 20; CaCl2 0.85; and 20 μm glycine (pH adjusted to 7.4 with NaOH). Patch pipettes contained (mm): potassium gluconate, 141; NaCl, 2.5; Hepes, 10; and EGTA, 11; pH adjusted to 7.4 with KOH. Single-channel activity was evoked by glutamate (20–100 μm), recorded with an Axopatch-1D amplifier (Axon Instruments), and stored on digital audio tape (Biologic DTR 1205, Biologic Instruments, Claix, France). Single-channel currents were replayed from digital audio tape, filtered at 2 kHz and digitized at 20 kHz, and their amplitudes and durations were measured using the SCAN program and analysed using the EKDIST program (Colquhoun & Sigworth, 1995; http://www.ucl.ac.uk/Pharmacology/dc.html). A resolution of 40 μs was imposed on both openings and closings in each data record. Distributions of fitted amplitudes that had durations greater than 415 μs were fitted with a mixture of two Gaussian components using the method of maximum likelihood. Bursts of single-channel openings were defined by a critical gap length (tcrit) that was calculated to give equal numbers of misclassified events (see Magleby & Pallotta, 1983; Clapham & Neher, 1984). Correlations between open times and adjacent shut intervals were also examined (see Gibb & Colquhoun, 1992; Schorge et al. 2005). Fast concentration jumps were achieved by the rapid switching, across the tip of a patch pipette, of two solutions flowing from either side of a piece of theta glass (see Wyllie et al. 1998). The control solution was supplemented with 20 μm glycine, and the test solution contained 10 mm glutamate (plus 20 μm glycine). Outside-out patches, held at −100 mV, were exposed to glutamate for 10 ms, and jumps were made every 20 s. The macroscopic agonist-evoked currents were filtered at 2 kHz and sampled at 10 kHz onto a computer hard disk via a CED 1401 Plus interface (CED Instruments, Cambridge, UK) using the computer program CJUMP. Individual jumps were averaged, and the resulting mean current fitted (least squares) with a single exponential curve using the CJFIT program (available from http://www.ucl.ac.uk/Pharmacology/dc.html). Measurement of liquid junction potentials at the end of experiments indicated that the exchange of control and test solutions occurred within 500 μs.
Simulation of NMDA receptor-mediated currents evoked by glutamate (10 mm for 10 ms, equivalent to the stimulus used in our concentration jump experiments) was performed using Channelab (http://www.pharm.emory.edu/straynelis/Downloads). The kinetic scheme (and rate constants) used to model NR1/NR2A NMDA receptor currents were as described by Schorge et al. (2005). Monte Carlo simulations were used to predict the action of glutamate on a population of 500 NR1/NR2A(WT) or NR1/NR2A(S670G) NMDA receptors (at a resolution of 50 kHz, filtered at 2 kHz for display purposes). Numerical integration (4th order Runga Kutta with a step size of 2.5 μs) was also used to evaluate the occupancies of each state in the kinetic scheme.
All results are expressed as means ± s.e.m.
Results
Ser670 influences glutamate potency but not single-channel conductance or individual open periods
Ser670 is conserved in all NR2 NMDA receptor subunits and is next to Thr671, which we showed previously to regulate glutamate potency (Fig. 1C; Anson et al. 1998, 2000; Chen et al. 2005). NR1/NR2A(S670G) NMDA receptors, when expressed in Xenopus oocytes, also display reduced sensitivity to glutamate. In Fig. 1D we compare mean glutamate concentration–response curves for NR1/NR2A(WT) and NR1/NR2A(S670G) NMDA receptors. Mean glutamate EC50 values were 2.8 ± 0.2 μm (n = 16; WT) and 347 ± 42 μm (n = 16; S670G). Hill slopes were not significantly different between S670G and wild-type receptors (being 1.25 ± 0.1 for both receptor combinations), consistent with a parallel right-shift in the glutamate dose–response curve. Average maximal currents were also not significantly different between S670G and wild-type receptors, in experiments where we carefully controlled cRNA levels of wild-type and mutant receptor subunits (Chen et al. 2005). This suggests that the main effect of the S670G mutation is to affect glutamate binding and not channel gating (see Anson et al. 1998; Colquhoun, 1998). To analyse the impact of the S670G mutation in more depth, we carried out single-channel recordings in outside-out patches.
Single-channel activity of NR1/NR2A(S670G) NMDA receptors was compared to data obtained previously from NR2A(WT)-containing NMDA receptors and NR1/NR2A(T671A) NMDA receptors (Wyllie et al. 1998; Anson et al. 2000). Figure 2A shows examples of single-channel currents recorded in an outside-out patch excised from an oocyte expressing NR1/NR2A(S670G) NMDA receptors. Individual amplitudes of all events recorded in this patch (with durations greater than 415 μs) are shown in Fig. 2B. Two discrete amplitude levels are evident. Amplitude histograms of NR1/NR2A(S670G) single-channel currents (Fig. 2C) were fitted with a mixture of two Gaussian components, and the means (and relative areas) for each amplitude level were: 5.5 ± 0.1 pA (0.83 ± 0.04) and 4.3 ± 0.2 pA (0.17 ± 0.04; n = 6 patches). Thus, amplitudes for NR1/NR2A(S670G) receptors were similar to those for NR1/NR2A(WT) NMDA receptors recorded under similar conditions, supporting our previous observations that single-channel conductance is not affected by mutations in the ligand-binding site (see Stern et al. 1992; Anson et al. 1998, 2000).
Figure 2. Single-channel amplitudes and open periods of NR1/NR2A(S670G) NMDA receptor-channels.

A, examples of single-channel currents evoked by 100 μm glutamate (plus 20 μm glycine) and recorded from an outside-out membrane patch excised from an oocyte expressing NR1/NR2A(S670G) NMDA receptors. Patch potential was –100 mV. B, amplitude stability plot showing the individual amplitudes of events (with durations greater than 415 μs). The dashed lines indicate the mean values of the two Gaussian components shown in C. C, amplitude histogram of data shown in B. The distribution is fitted with a mixture of two Gaussian components with means and relative areas as indicated. D, open period distribution fitted with a mixture of three exponential components with means and relative areas as indicated. The distribution contains 4899 events and the fit predicts 5218 events and has an overall mean of 2.12 ms.
Distributions of open periods for NR1/NR2A(S670G) NMDA receptors were well described by three exponential components with means (and relative areas) of 93 ± 18 μs (0.14 ± 0.06), 1.34 ± 0.18 ms (0.32 ± 0.07) and 3.82 ± 0.35 ms (0.54 ± 0.07; n = 6 patches; Fig. 2D). The overall mean apparent length of NR1/NR2A(S670G) channel open periods was 2.55 ± 0.41 ms. These values agree well with estimates obtained from wild-type NR1/NR2A NMDA receptors (Wyllie et al. 1998). Similarly, the NR2A(T671A) mutation does not affect the duration of open periods (Anson et al. 1998). We next examined how the S670G mutation affected individual activations of NR1/NR2A(S670G) NMDA receptors.
Shut-time distributions and properties of NR1/NR2A(S670G) bursts
Figure 3 shows, for comparison, steady-state channel activity (20 s in duration) recorded in an outside-out patch excised from an oocyte expressing either NR1/NR2A(WT) (Fig. 3A) or NR1/NR2A(S670G) NMDA receptors (Fig. 3B). Channel activity was evoked by glutamate concentrations that were considerably less than the respective EC50 values for each receptor combination (100 nm for NR1/NR2A and 20 μm for NR1/NR2A(S670G)). This allowed us to separate individual receptor activations (bursts). Even with limited temporal resolution, there are hints that the structure of single-channel activations of NR1/NR2A(S670G) NMDA receptors differs from their wild-type counterparts. To quantify these differences, we carried out single-channel burst analysis. We defined individual bursts of NR1/NR2A(S670G) NMDA receptor activations as clusters of openings separated by closed times longer than a critical shut time (tcrit).
Figure 3. Steady-state NR1/NR2A(WT) and NR1/NR2A(S670G) NMDA receptor activity evoked by low concentrations of glutamate.

A, example of a continuous (20 s in duration) single-channel recording obtained from an outside-out membrane patch excised from an oocyte expressing NR2A(WT) NMDA receptor-channels. The patch was held at −100 mV, and channel activity was evoked by 100 nm glutamate (plus 20 μm glycine). B, continuous (20 s in duration) single-channel recording obtained from an outside-out membrane patch (−100 mV) excised from an oocyte expressing NR2A(S670G) NMDA receptor-channels. In this example, channel activity was elicited by 20 μm glutamate (plus 20 μm glycine).
Figure 4A shows a typical shut-time distribution fitted with a mixture of six exponential components. Mean values (and relative areas) for NR1/NR2A(S670G) NMDA receptor shut times are given in Table 1. The fifth and sixth components within each distribution showed a high degree of variability among patches; τ5 values ranging between 71 and 397 ms and τ6 between 195 and 1163 ms. This degree of variability suggests that these two longest components represent shut times that occur between individual channel activations or bursts (see Anson et al. 2000). Nevertheless, if we assume that the association rate constant for glutamate is in the region of 1 × 10⁷m−1 s−1, the mean durations of τ5 and τ6 are much longer than are expected for the mean lifetime of an unliganded receptor for the range of glutamate concentrations (20–100 μm) used in this study. As has been suggested previously (Anson et al. 2000), this might indicate the existence of additional long-lived shut states in channels carrying mutations within their ligand-binding sites. The existence of four shut states within channel activations of NR1/NR2A(S670G) NMDA receptors is in contrast to that seen with either NR1/NR2A(WT) or NR1/NR2A(T671A) channels, which contain only three ‘within activation’ shut states. Notably, we observe a component (τ4) with a mean duration of approximately 7 ms with the NR2A(S670G) mutation that is completely absent in shut-time distributions of NR1/NR2A(T671A) NMDA receptors.
Figure 4. Distribution of shut times and burst length properties of NR1/NR2A(S670G) NMDA receptors.

A, example of a shut-time distribution obtained from a recording of NR1/NR2A(S670G) NMDA receptor-channel activity elicited by 100 μm glutamate (plus 20 μm glycine). The distribution is fitted with a mixture of six exponential components with means and relative areas as indicated. Four thousand nine hundred and eight events are included in the distribution, while the fit predicts 11998 events. The tcrit used to separate the fourth and fifth components of the distribution was 12.5 ms. B, burst length distribution for data shown in A and in Fig. 2D. The distribution is fitted with a mixture of four exponential components with means and relative areas as indicated. One thousand four hundred and fifty-seven events are included in the distribution, while the fit predicts 1569 events. The dashed line shows the fit of the equivalent overall mean distribution for NR1/NR2A(WT) NMDA receptors (as reported by Wyllie et al. 1998). C, distribution of total open time per burst for data shown in B. The distribution is fitted with a mixture of four exponential components and contains 1457 events (1564 events are predicted). Again the dashed line shows the fit of the equivalent overall mean distribution for NR1/NR2A(WT) NMDA receptors (as reported by Wyllie et al. 1998).
Table 1.
Mean kinetic parameters for NR1/NR2A(S670G) NMDA receptor single-channel currents (n = 6 patches)
| τ1 (μs) | τ2 (ms) | τ3 (ms) | τ4 (ms) | τ5 (ms) | τ6 (ms) | Distribution mean (ms) | |
|---|---|---|---|---|---|---|---|
| Open period | 93 ± 18 | 1.34 ± 0.18 | 3.82 ± 0.35 | — | — | — | 2.55 ± 0.41 |
| (14 ± 6%) | (32 ± 7%) | (54 ± 7%) | — | — | — | — | |
| Shut time | 17 ± 1 | 0.144 ± 0.021 | 1.45 ± 0.8 | 7.16 ± 0.46 | 161 ± 30 | 800 ± 139 | 57.7 ± 10.5 |
| (62 ± 4%) | (8 ± 1%) | (14 ± 2%) | (2 ± 1%) | (7 ± 2%) | (7 ± 2%) | — | |
| Burst length | 179 ± 26 | 2.73 ± 0.73 | 9.61 ± 0.49 | 29.6 ± 1.5 | — | — | 10.2 ± 2.3 |
| (21 ± 2%) | (17 ± 6%) | (41 ± 9%) | (21 ± 8) | — | — | — | |
| Open time per burst | 167 ± 23 | 1.89 ± 0.22 | 7.89 ± 1.02 | 30.3 ± 6.9 | — | — | 8.7 ± 2.1 |
| (22 ± 2%) | (15 ± 3%) | (31 ± 7%) | (32 ± 9%) | — | — | — | |
| Burst Popen | 0.83 ± 0.06 | — | — | — | — | — | — |
Time constants for each component (τ1 to τ6) are given as means ± s.e.m., together with their percentage areas. Single-channel activity was evoked by glutamate (20–100 μm) in the presence of a saturating concentration of glycine (20 μm).
Burst length is determined, in part, by the duration that an agonist occupies its binding site. A tcrit was calculated as the gap most likely to separate the shut times contained within the fourth and fifth components of each distribution and thus allow us to identify individual bursts of channel openings. The overall mean tcrit calculated by the method of misclassifying equal numbers of events from each component of the distribution (Magleby & Pallotta, 1983; Clapham & Neher, 1984) was 9.2 ± 0.1 ms. In the distribution shown in Fig. 4A, the tcrit is 12.5 ms.
Burst lengths were calculated from each data set to generate burst length distributions (Fig. 4B) that were best fitted with a mixture of four exponential components. Mean values obtained from all experiments are given in Table 1. Typical burst lengths of wild-type NR1/NR2A NMDA receptors (expressed in oocytes) exhibit long openings that generate a slow component with a time constant of approximately 200 ms (see Wyllie et al. 1998). In contrast, the slowest burst length time constant observed in our analyses of NR1/NR2A(S670G) NMDA channel activity had a mean of 29.6 ± 1.5 ms. This approximately sixfold reduction in the slowest burst length time constant is consistent with the effect of the NR2A(T671A) mutation (Anson et al. 2000). Distributions of total open time per burst were best described by a mixture of four exponential components and had an overall mean of 8.7 ± 2.1 ms. From this, we calculated that the probability that a channel was open during a burst was 0.83 ± 0.06 (Fig. 4C shows this sort of distribution for the data illustrated in Fig. 4B). This value is again similar to that calculated in previous analyses of NR1/NR2A(T671A) NMDA receptor-channel properties (Anson et al. 2000) and is significantly higher than for wild-type NR1/NR2A NMDA receptors (see Wyllie et al. 1998). The number of exponential components contained within distributions of total open time per burst is expected to reflect the number of open states of the receptor. Clearly, our observations in this respect do not agree, since distributions of open periods suggest only three components. However, in neither sort of distribution did we take into consideration the conductance levels of the open periods and therefore it is likely that the number of components within these distributions underestimates the total number of open states of the channel. The total number of openings contained within a NR1/NR2A(S670G) NMDA receptor-channel burst were described by a mixture of three geometric components that were similar to those calculated from previous analyses of the T671A mutant; means were 1.26 ± 0.06 (33 ± 4%), 3.27 ± 0.46 (49 ± 5%) and 8.81 ± 2.29 (18 ± 5%). The overall mean number of openings per burst for NR1/NR2A(S670G) NMDA receptors was 3.34 ± 0.48. For comparison, the equivalent values for NR2A(WT)-containing and NR2A(T671A)-containing NMDA receptors are 6.84 ± 1.11 and 3.19 ± 0.25, respectively (see Wyllie et al. 1998; Anson et al. 2000).
Correlations between open and shut times
Open times and shut times for a variety of ligand-gated ion channels, including nicotinic acetylcholine receptors (Colquhoun & Sakmann, 1985; Hatton et al. 2003), glycine receptors (Beato et al. 2002, 2004) and NMDA receptors (Gibb & Colquhoun, 1992; Schorge et al. 2005) are correlated. We investigated whether NMDA receptors carrying the S670G point mutation displayed correlations between their open and shut times. These data are summarized in Fig. 5, which also contains, for comparison, equivalent data sets for NR1/NR2A(WT) and NR1/NR2A(T671A) NMDA receptors (analysis of data reported by Wyllie et al. 1998; Anson et al. 2000). We calculated mean open periods for openings that occurred adjacent to (either preceding or following) a specified shut-time interval. These shut-time intervals were as follows: 40–300 μs, 300 μs to 1 ms, 1–3 ms, 3–30 ms, 30–300 ms, 300–3000 ms and intervals greater than 3000 ms. The mean open period for all events for a particular receptor combination is indicated by a dashed line. Correlations are evident for each receptor combination, indicating that longer than average openings tend to occur next to short shut periods, while shorter openings tend to occur adjacent to long shut periods. Thus, for example, open periods of NR1/NR2A(WT) NMDA receptors adjacent to shut-time intervals in the range of 40–300 μs are 128 ± 2% (n = 6242 events, from 10 recordings) of the overall mean open period value of 2.32 ms, while those adjacent to shut-time intervals in the range 300–3000 ms are only 64 ± 3% (n = 1150 events). Corresponding values for NR1/NR2A(S670G) NMDA receptors, using the same shut-time intervals, are 129 ± 1% (n = 15968 events; n = 6 recordings) and 77 ± 2% (n = 4806 events) and for NR1/NR2A(T671A) NMDA receptors, 115 ± 1% (n = 31038 events, from 15 recordings) and 62 ± 1% (n = 10522 events). Similar correlations have been reported previously for both native (Gibb & Colquhoun, 1992) and recombinant NMDA receptors (Schorge et al. 2005).
Figure 5. Correlations between open periods and shut times.

A, pooled data showing the correlation between mean open periods and adjacent shut-time intervals for events recorded from outside-out patches (n = 10) excised from oocytes expressing NR1/NR2A(WT) NMDA receptors. The dashed line indicates the overall mean open period for all events. Longer than average open periods occur adjacent to brief shut-time intervals, whereas shorter than average open periods occur adjacent to long shut-time intervals. B, pooled data showing correlations between open and shut times for NR2A(S670G)-containing NMDA receptors (n = 6). C, as B, but for NR2A(T671A)-containing NMDA receptors (n = 15).
Glutamate concentration jumps with NR1/NR2A(S670G) NMDA receptors
The decrease in NR1/NR2A(S670G) NMDA receptor burst length durations compared to those of wild-type NMDA receptors predicts an increase in the deactivation rate of macroscopic currents elicited by a brief concentration jump. Figure 6A shows examples of NR1/NR2A(S670G) NMDA receptor currents recorded in outside-out membrane patches in response to a 10 ms application of 10 mm glutamate. In these examples, approximately 20 channels open simultaneously at the peak of the current, and individual channel openings and closings can clearly be seen during the decay phase of the current. The mean current recorded in this experiment is shown in Fig. 6B. The deactivation of the current is well described by a single exponential component (dashed line). On average, NR1/NR2A(S670G) NMDA receptor-mediated currents evoked by brief applications of glutamate decayed with a time constant of 52.1 ± 6.5 ms (n = 6). For comparison, a macroscopic current scaled to equivalent peak response and recorded from a patch containing NR1/NR2A(WT) NMDA receptor-channels, is superimposed on the NR1/NR2A(S670G) trace (originally published as Fig. 6B of Wyllie et al. 1998). This superimposition highlights the different deactivation kinetics of NR2A(S670G)-containing compared to wild-type NMDA receptors. In contrast to NR1/NR2A(WT) NMDA receptor-mediated responses, but consistent with data from receptors carrying the NR2A(T671A) mutation, we could find no evidence for a second slower component to the deactivation of the macroscopic response mediated by NR1/NR2A(S670G) NMDA receptors. In addition, it is to be expected that the time constants describing both burst lengths and the macroscopic response following a concentration jump should be the same if each is made up from events that represent single activations of the receptor (see Wyllie et al. 1998). However, there is a discrepancy between the mean duration of the longest component in the NR1/NR2A(S670G) NMDA receptor burst length distribution and the deactivation time course, the reasons for which are unclear.
Figure 6. NR1/NR2A(S670G) NMDA receptor-mediated currents evoked by brief applications of glutamate.

A, examples of two macroscopic currents recorded from an outside-out patch excised from an oocyte expressing NR1/NR2A(S670G) NMDA receptors. Currents were evoked by exposing the patch to glutamate (10 mm) for a duration of 10 ms. B, average of 30 such sweeps as shown in A fitted with a single exponential decay component (dashed white line). Superimposed on the NR2A(S670G) trace is an example of a mean macroscopic current recorded from a patch containing NR1/NR2A(WT) NMDA receptors to highlight the difference in the decay kinetics of the two receptor types.
Discussion
The dwell time of glutamate on the NR2 receptor subunit is critical for regulating its potency at NMDA receptors. Our results demonstrate that Ser670 has a central role in determining the duration that glutamate remains bound to NR2A NMDA receptor subunits. Ser670 is conserved in all but two ionotropic glutamate receptor subunits, the exceptions being the kainate receptor subunits GluR6 and GluR7, which contain alanine residues in the equivalent position. Interestingly, the point mutation NR2A(S670A) causes a less than twofold reduction in glutamate potency (Anson et al. 1998), suggesting that an alanine substitution at this site does not cause drastic changes in the nature of glutamate binding. However, such a subtle substitution in certain binding cavities, e.g. kainate receptor subunits, may be enough to reduce the stability of glutamate binding within the GluR6 binding pocket compared to their GluR5 counterpart and may partly explain their differing glutamate potencies (Mayer, 2005; Chen & Wyllie, 2006). Ser670 is next to Thr671, which has been shown in previous studies similarly to regulate the dwell time of glutamate on the NR2A receptor subunit. The recent crystal structure of the binding site of the NR2A NMDA receptor subunit (Furukawa et al. 2005) places Ser670 in the glutamate binding site and shows it H-bonds with both the α- and γ-carboxyl groups of glutamate. This is consistent with our hypothesis that the major effect of the NR2A(S670G) point mutation is to reduce the ability of glutamate to remain bound to its ligand-binding site. All channel parameters measured in this study, namely a reduction in single-channel burst lengths, an associated increase in open probability during a burst, and an increase in the deactivation rate of macroscopic currents following a concentration jump, are consistent with reduced glutamate binding to its receptor (the reader is referred to previous publications for further details: Anson et al. 1998; Chen et al. 2004, 2005). Below we discuss two of the observations we have made on the NR2A(S670G) mutant in more detail.
Correlations between open and shut times in steady-state single-channel recordings
Correlations between the durations of channel open times and closed times occur in a variety of types of ligand-gated ion channels. Commonly, longer than average open times occur more frequently adjacent to shorter than average closed times, and shorter openings occur adjacent to longer shuttings (for example, see Colquhoun & Sakmann, 1985; Gibb & Colquhoun, 1992; Beato et al. 2002, 2004; Hatton et al. 2003; Schorge et al. 2005). The underlying interpretation of such correlations differs for nicotinic and glycine receptors compared to NMDA receptors. Brief-duration openings of nicotinic and glycine receptors are predicted to arise from partially liganded receptors, which tend to be more frequent when low agonist concentrations are used to activate the receptor. In the case of NMDA receptors, there is little evidence that these receptors can open when they are mono-liganded by glutamate and, consistent with this, correlations are observed over a range of agonist concentrations (Gibb & Colquhoun, 1992; Schorge et al. 2005). Correlations between open and shut times of NMDA receptors are therefore more likely to arise from fully occupied receptors. NMDA receptors exist in multiple open and closed states and, while this does not exclude the stated hypothesis, it follows that these states must be connected such that it is not possible to separate all open states from all shut states by removing only one open or closed state (see Schorge et al. 2005 and references therein).
Correlations between open and closed times of both NR1/NR2A(S670G) and NR1/NR2A(T671A) NMDA receptors were similar to those reported for wild-type NMDA receptors (Fig. 5), and these in turn agree with the nature of correlations reported previously for native and recombinant NMDA receptors (Gibb & Colquhoun, 1992; Schorge et al. 2005). If correlations in NMDA receptors arise from fully liganded receptors, the presence of correlations in channels that contain mutations in the ligand-binding site lends support to the notion that the S670G and T671A mutations do not affect channel ‘pregating’ and ‘gating’ kinetics that lie downstream of agonist binding.
Reduced agonist potency and increased deactivation rates following agonist concentration jumps
The NMDA receptor-mediated component of the glutamatergic EPSC decays slowly relative to the AMPA receptor component. This is due, in part, to slow dissociation of glutamate from its binding site on NR2 receptor subunits. We used concentration jump experiments to mimic the brief exposure to glutamate that receptors experience during synaptic neurotransmission. The nature of the NR2 receptor subunit influences the deactivation rate of NMDA receptor complexes (for example see Monyer et al. 1994; Vicini et al. 1998; Wyllie et al. 1998), and we have shown previously that a conserved threonine residue in the NR2A and NR2D receptor subunits plays a key role in slowing the rate of NMDA receptor current deactivation, when studied using brief agonist concentration jumps (Anson et al. 1998, 2000; Chen et al. 2004). Our results with the NR2A(S670G) mutant similarly show that Ser670 contributes to the slow deactivation properties of NMDA receptor currents. Interestingly, deactivation kinetics of the NR2A(T671A) mutant are similar to those of S670G, but the T671A mutation induced a significantly greater shift in glutamate potency (approximately 1000-fold increase in the EC50 value of glutamate compared to wild type) compared to the NR2A(S670G) mutation (124-fold increase in the EC50 value). This feature seems to be conserved among NMDA receptor subtypes. In NR2D-containing receptors (which, in contrast to NR2A, display characteristically more long-lasting activations), the NR2D(T692A) mutation produced approximately a 1600-fold reduction in glutamate potency compared to wild-type NR2D-containing receptors but produced similar deactivation rates to those seen in the equivalent mutation in NR2A-containing receptors (NR2A(T671A)) and here with NR2A(S670G) (Chen et al. 2004). We therefore used simulations to determine whether the changes observed in deactivation rates with the NR2A(S670G) mutant described in our studies are consistent with proposed kinetic schemes of NMDA receptor activation.
Several schemes of NR1/NR2A NMDA receptor activation have been published recently (for example, see Popescu & Auerbach, 2003; Popescu et al. 2004; Erreger et al. 2005a,b). These have been derived from data obtained from studies of NMDA receptors expressed in mammalian cell lines. However, NMDA receptor-mediated currents deactivate with faster kinetics in mammalian cells compared to the same receptor subtypes expressed in Xenopus oocytes. For our purposes, the scheme proposed by Schorge et al. (2005; Fig. 7A) incorporates many features of NMDA receptor activation and is derived from studies of recombinant NMDA receptors expressed in Xenopus oocytes using similar experimental conditions to those described here. Nevertheless, this scheme does not account fully for all our experimental observations. For example, it models only two open states, whereas our data suggest a minimum of three open states in both wild-type and S670G NMDA receptor recordings; it does not contain long-lived shut states to account for the longest components seen in our shut-time distributions; and it does not show desensitization in response to a prolonged application of agonist.
Figure 7. Simulating the effect of the NR2A(S670G) mutation by increasing the dissociation rate constant for glutamate.

A, kinetic scheme described by Schorge et al. (2005) to account for single-channel activations of NR1/NR2A NMDA receptors expressed in Xenopus laevis oocytes. The rate constants indicated are those proposed by Schorge et al. (2005) and are given in units of m−1 s−1 or s−1, as appropriate. In the scheme, R denotes the unliganded receptor and AR the mono-liganded receptor. There are five doubly liganded shut states (denoted A2RC1–C5) and two open states (denoted A2RO1 and A2RO2). The dashed box indicates the reactions which occur independently of binding and which, for our purposes, we have assumed to be unaltered by the S670G mutation. For our simulations of NR1/NR2A(S670G) NMDA receptor activations, we multiplied the value of the dissociation rate constant for wild-type receptors by a factor of 124. Note that we have omitted from the kinetic scheme reaction rates describing glycine binding (and unbinding) because, under our recording conditions, we assume that the glycine binding site on the NR1 subunit was fully occupied. B, Monte Carlo simulation of a macroscopic current response generated from the kinetic scheme described in A using the rate constants shown with the microscopic dissociation rate constant for glutamate set to 3261 s−1. The simulated response was generated from a population of 500 receptors exposed to glutamate (10 mm) for 10 ms. C, Monte Carlo simulation of the activation of 500 channels using the rate constants as described for NR1/NR2A(WT) NMDA receptors by Schorge et al. (2005). D, comparison of the time course and magnitude (in terms of Popen(glut, 10 ms)) of NR1/NR2A(S670G) (continuous line; maximum Popen(glut, 10 ms) = 0.267) and NR1/NR2A(WT) responses (dashed line; maximum Popen(glut, 10 ms) = 0.38) obtained from numerical integration (4th order Runga Kutta). Fitting the decays of these simulated responses with a single exponential gives τdecay values of 41 ms for NR1/NR2A(S670G) responses and 109 ms for NR1/NR2A(WT) responses. E, comparison of the time course and magnitude (in terms of Popen(glut, 10 ms)) of NR1/NR2A(S670G) (continuous line) and NR1/NR2A(WT) responses (dashed line) obtained when the duration of the glutamate pulse is reduced to 1 ms. In this case, the maximum Popen is reduced for both NR1/NR2A(S670G) and NR1/NR2A(WT) NMDA receptors to 0.041 and 0.293, respectively.
Clearly, changes in EC50 values cannot normally be easily ascribed to alterations in binding and/or unbinding rates constants because the EC50 is determined by all the rate constants that describe the interaction of an agonist with its receptor (see Colquhoun, 1998). However, our single-channel data in this study, together with our previous studies, strongly support the notion that the major effect of the mutations we have studied in the S2 ligand-binding domain is to reduce glutamate binding to its receptor (Anson et al. 1998, 2000; Chen et al. 2004). Thus, for the discussion that follows we have assumed that the S670G mutation affects only the microscopic dissociation rate constant.
In Figs 7B and C, we compare the ‘response’ (Monte Carlo simulation) of 500 NR1/NR2A(S670G) or NR1/NR2A(WT) NMDA channels to a 10 ms pulse of 10 mm glutamate. The microscopic dissociation rate constant (k−) for glutamate unbinding from the NR2A(S670G) mutant was 124-fold greater compared to wild type, to account for the difference in their EC50 values. The simulated current deactivates along a single exponential with a time constant of 41 ms. In contrast, Schorge et al. (2005) reported that the decay of wild-type current is well described by a single exponential component with a time constant of approximately 100 ms. An increase in the microscopic dissociation rate constant beyond 124-fold does not lead to any further increase in the deactivation rate, since this is limited by ‘pregating’ and ‘gating’ reactions within the kinetic scheme that are independent of unbinding (or binding) events (i.e. those reactions denoted by the dashed box).
The predicted steady-state maximum open probability at saturating glutamate concentrations is not altered by changes in the dissociation rate constant and, using the scheme proposed by Schorge et al. (2005), is approximately 0.5; clearly, we see an increase in the open probability of a burst with the NR2A(S670G) mutation and this is not accounted for by this scheme. However, the predicted EC50 (and Hill Slope values) from the scheme, as published and after altering the dissociation rate by a factor of 124, are in good agreement with our observations, being 2.67 (nH = 1.42) and 336 μm(nH = 1.41) for wild-type and S670G NMDA receptors, respectively. Thus, changes in macroscopic measurements, such as EC50 values and deactivation rates, appear to be well accounted for by simply altering the dissociation rate constant. As pointed out above, however, several single-channel observations from NR1/NR2A(S670G) NMDA receptors cannot so readily be accounted for by this particular scheme.
A change in the dissociation rate constant does affect the magnitude of the peak response when the duration of application of glutamate is reduced. As shown in Fig. 7D, under non-equilibrium conditions the peak open probability of the macroscopic response is reduced for both NR1/NR2A(WT) and NR1/NR2A(S670G) NMDA receptors when a saturating concentration of glutamate is applied for 10 ms (wild-type Popen(glut, 10 ms) = 0.38; S670G Popen(glut, 10 ms) = 0.267). Indeed, if rather than using a 10 ms pulse of 10 mm glutamate in our simulation we use a 1 ms pulse of 10 mm then there is a considerable reduction in the peak Popen(glut, 10 ms) values for NR1/NR2A(S670G) NMDA receptors in particular (wild-type Popen(glut, 1 ms) = 0.293; S670G Popen(glut, 1 ms) = 0.041; Fig. 7E). Thus, if in our recordings of macroscopic current responses we had used such brief durations of agonist application, the number of channels open at the peak of the response would considerably underestimate the true number of receptors contained within the membrane patch.
Conclusion
From our functional analysis, we have demonstrated that Ser670, like Thr671, plays a central role in co-ordinating the binding of glutamate when it occupies the ligand-binding site of the NR2A NMDA receptor subunit. Such a conclusion is consistent with the role suggested for this residue in a recently published crystal structure of the NR2A ligand-binding domain (Furukawa et al. 2005). Additionally, it appears that the nature of the single-channel activations mediated by either NR2A(S670G)- or NR2A(T671A)-containing NMDA receptors is similar. Thus, while the magnitude of the shifts in potency of glutamate for these two mutants are different, being 124-fold for NR2A(S670G) versus the 1000-fold shift seen with NR2A(T671A) (see Anson et al. 1998), the effect at the single-channel level is similar. This might indicate that the single-channel activations we observe for these two NR2A mutations and indeed those of the NR2D(T692A) mutation (see Chen et al. 2004) represent a minimum activation length reflecting the durations of both ‘pregating’ and ‘gating’ reactions that occur even when the microscopic dissociation rate for glutamate is very large.
Acknowledgments
We thank our colleagues in the Cognition, Learning and Synaptic Plasticity Group at the University of Edinburgh and members of the D.J.A.W. laboratory for helpful discussions during the course of this project. This work was supported by grants from the Biotechnology and Biological Sciences Research Council (15/C16800; D.J.A.W.) and the National Institutes of Health (NIH NS29967; D.L.).
References
- Anson LC, Chen PE, Wyllie DJA, Colquhoun D, Schoepfer R. Identification of amino acid residues of the NR2A subunit that control glutamate potency in recombinant NR1/NR2A NMDA receptors. J Neurosci. 1998;18:581–589. doi: 10.1523/JNEUROSCI.18-02-00581.1998. [DOI] [PMC free article] [PubMed] [Google Scholar]
- Anson LC, Schoepfer R, Colquhoun D, Wyllie DJA. Single-channel analysis of an NMDA receptor possessing a mutation in the region of the glutamate binding site. J Physiol. 2000;527:225–237. doi: 10.1111/j.1469-7793.2000.00225.x. [DOI] [PMC free article] [PubMed] [Google Scholar]
- Beato M, Groot-Kormelink PJ, Colquhoun D, Sivilotti LG. Openings of the rat recombinant alpha 1 homomeric glycine receptor as a function of the number of agonist molecules bound. J Gen Physiol. 2002;119:443–466. doi: 10.1085/jgp.20028530. [DOI] [PMC free article] [PubMed] [Google Scholar]
- Beato M, Groot-Kormelink PJ, Colquhoun D, Sivilotti LG. The activation mechanism of alpha1 homomeric glycine receptors. J Neurosci. 2004;24:895–906. doi: 10.1523/JNEUROSCI.4420-03.2004. [DOI] [PMC free article] [PubMed] [Google Scholar]
- Chen PE, Geballe MT, Stansfeld PJ, Johnston AR, Yuan H, Jacob AL, Snyder JP, Traynelis SF, Wyllie DJA. Structural features of the glutamate binding site in recombinant NR1/NR2A N-methyl-d-aspartate receptors determined by site-directed mutagenesis and molecular modeling. Mol Pharmacol. 2005;67:1470–1484. doi: 10.1124/mol.104.008185. [DOI] [PubMed] [Google Scholar]
- Chen PE, Johnston AR, Mok MH, Schoepfer R, Wyllie DJA. Influence of a threonine residue in the S2 ligand binding domain in determining agonist potency and deactivation rate of recombinant NR1a/NR2D NMDA receptors. J Physiol. 2004;558:45–58. doi: 10.1113/jphysiol.2004.063800. [DOI] [PMC free article] [PubMed] [Google Scholar]
- Chen PE, Wyllie DJA. Pharmacological insights obtained from structure-function studies of ionotropic glutamate receptors. Br J Pharmacol. 2006;147:839–853. doi: 10.1038/sj.bjp.0706689. [DOI] [PMC free article] [PubMed] [Google Scholar]
- Clapham DE, Neher E. Substance P reduces acetylcholine-induced currents in isolated bovine chromaffin cells. J Physiol. 1984;347:255–277. doi: 10.1113/jphysiol.1984.sp015065. [DOI] [PMC free article] [PubMed] [Google Scholar]
- Colquhoun D. Binding, gating, affinity and efficacy. The interpretation of structure- activity relationships for agonists and of the effects of mutating receptors. Br J Pharmacol. 1998;125:923–948. doi: 10.1038/sj.bjp.0702164. [DOI] [PMC free article] [PubMed] [Google Scholar]
- Colquhoun D, Sakmann B. Fast events in single channel currents activated by acetylcholine and its analogues at the frog muscle end-plate. J Physiol. 1985;369:501–555. doi: 10.1113/jphysiol.1985.sp015912. [DOI] [PMC free article] [PubMed] [Google Scholar]
- Colquhoun D, Sigworth FJ. Fitting and statistical analysis of single-channel records. In: Sakmann B, Neher E, editors. Single Channel Recording. 2. New York: Plenum Press; 1995. pp. 483–587. [Google Scholar]
- Erreger K, Chen PE, Wyllie DJA, Traynelis SF. Glutamate receptor gating. Crit Rev Neurobiol. 2004;16:187–224. doi: 10.1615/critrevneurobiol.v16.i3.10. [DOI] [PubMed] [Google Scholar]
- Erreger K, Dravid SM, Banke TG, Wyllie DJA, Traynelis SF. Subunit specific gating controls rat recombinant NR1/NR2A and NR1/NR2B channel kinetics and synaptic signalling profiles. J Physiol. 2005a;563:345–358. doi: 10.1113/jphysiol.2004.080028. [DOI] [PMC free article] [PubMed] [Google Scholar]
- Erreger K, Geballe MT, Dravid SM, Snyder JP, Wyllie DJA, Traynelis SF. Mechanism of partial agonism at NMDA receptors for a conformationally restricted glutamate analog. J Neurosci. 2005b;25:7858–7866. doi: 10.1523/JNEUROSCI.1613-05.2005. [DOI] [PMC free article] [PubMed] [Google Scholar]
- Furukawa H, Gouaux E. Mechanisms of activation, inhibition and specificity: crystal structures of the NMDA receptor NR1 ligand-binding core. EMBO J. 2003;22:2873–2885. doi: 10.1093/emboj/cdg303. [DOI] [PMC free article] [PubMed] [Google Scholar]
- Furukawa H, Singh SK, Mancussco R, Gouaux E. Subunit arrangement of and function in NMDA receptors. Nature. 2005;438:185–192. doi: 10.1038/nature04089. [DOI] [PubMed] [Google Scholar]
- Gibb AJ, Colquhoun D. Activation of N-methyl-d-aspartate receptors by l-glutamate in cells dissociated from adult rat hippocampus. J Physiol. 1992;456:143–179. doi: 10.1113/jphysiol.1992.sp019331. [DOI] [PMC free article] [PubMed] [Google Scholar]
- Hansen KB, Clausen RP, Bjerrum EJ, Bechmann C, Greenwood JR, Christensen C, Kristensen JL, Egebjerg J, Brauner-Osborne H. Tweaking agonist efficacy at NMDA receptors by site-directed mutagenesis. Mol Pharmacol. 2005;68:1510–1523. doi: 10.1124/mol.105.014795. [DOI] [PubMed] [Google Scholar]
- Hardingham GE, Bading H. The Yin and Yang of NMDA receptor signalling. Trends Neurosci. 2003;26:81–89. doi: 10.1016/S0166-2236(02)00040-1. [DOI] [PubMed] [Google Scholar]
- Hatton CJ, Shelley C, Brydson M, Beeson D, Colquhoun D. Properties of the human muscle nicotinic receptor, and of the slow-channel myasthenic syndrome mutant eL221F, inferred from maximum likelihood fits. J Physiol. 2003;547:729–760. doi: 10.1113/jphysiol.2002.034173. [DOI] [PMC free article] [PubMed] [Google Scholar]
- Laube B, Hirai H, Sturgess M, Betz H, Kuhse J. Molecular determinants of agonist discrimination by NMDA receptor subunits: analysis of the glutamate binding site on the NR2B subunit. Neuron. 1997;18:493–503. doi: 10.1016/s0896-6273(00)81249-0. [DOI] [PubMed] [Google Scholar]
- Laube B, Schemm R, Betz H. Molecular determinants of ligand discrimination in the glutamate-binding pocket of the NMDA receptor. Neuropharmacology. 2004;47:994–1007. doi: 10.1016/j.neuropharm.2004.07.041. [DOI] [PubMed] [Google Scholar]
- Magleby KL, Pallotta BS. Burst kinetics of single calcium-activated potassium channels in cultured rat muscle. J Physiol. 1983;344:605–623. doi: 10.1113/jphysiol.1983.sp014958. [DOI] [PMC free article] [PubMed] [Google Scholar]
- Mayer ML. Crystal structures of the GluR5 and GluR6 ligand binding cores: molecular mechanisms underlying kainate receptor selectivity. Neuron. 2005;45:539–552. doi: 10.1016/j.neuron.2005.01.031. [DOI] [PubMed] [Google Scholar]
- Monyer H, Burnashev N, Laurie DJ, Sakmann B, Seeburg PH. Developmental and regional expression in the rat brain and functional properties of four NMDA receptors. Neuron. 1994;12:529–540. doi: 10.1016/0896-6273(94)90210-0. [DOI] [PubMed] [Google Scholar]
- Popescu G, Auerbach A. Modal gating of NMDA receptors and the shape of their synaptic current. Nat Neurosci. 2003;6:476–483. doi: 10.1038/nn1044. [DOI] [PubMed] [Google Scholar]
- Popescu G, Robert A, Howe JR, Auerbach A. Reaction mechanism determines the NMDA receptor response to repetitive stimulation. Nature. 2004;430:790–793. doi: 10.1038/nature02775. [DOI] [PubMed] [Google Scholar]
- Schorge S, Elenes S, Colquhoun D. Maximum likelihood fitting of single channel NMDA activity with a mechanism composed of independent dimers of subunits. J Physiol. 2005;569:395–418. doi: 10.1113/jphysiol.2005.095349. [DOI] [PMC free article] [PubMed] [Google Scholar]
- Stern P, Behe P, Schoepfer R, Colquhoun D. Single-channel conductances of NMDA receptors expressed from cloned cDNAs: comparison with native receptors. Proc Biol Sci. 1992;250:271–277. doi: 10.1098/rspb.1992.0159. [DOI] [PubMed] [Google Scholar]
- Vicini S, Wang JF, Li JH, Zhu WJ, Wang YH, Luo JH, Wolfe BB, Grayson DR. Functional and pharmacological differenes between recombinant N-methyl-D-aspartate receptors. J Neurophysiol. 1998;79:555–566. doi: 10.1152/jn.1998.79.2.555. [DOI] [PubMed] [Google Scholar]
- Williams K, Chao J, Kashiwagi K, Masuko T, Igarashi K. Activation of N-methyl-d-aspartate receptors by glycine: role of an aspartate residue in the M3–M4 loop of the NR1 subunit. Mol Pharmacol. 1996;50:701–708. [PubMed] [Google Scholar]
- Wyllie DJA, Béhé P, Colquhoun D. Single-channel activations and concentration jumps: comparison of recombinant NR1/NR2A and NR1/NR2D NMDA receptors. J Physiol. 1998;510:1–18. doi: 10.1111/j.1469-7793.1998.001bz.x. [DOI] [PMC free article] [PubMed] [Google Scholar]