

Abstract
The analysis of molecular signatures of antigen-driven affinity selection of B cells is of immense use in studies on normal and abnormal B cell development. Most of the published literature compares the expected and observed frequencies of replacement (R) and silent (S) mutations in the complementarity-determining regions (CDRs) and the framework regions (FRs) of antibody genes to identify the signature of antigenic selection. The basic assumption of this statistical method is that antigenic selection creates a bias for R mutations in the CDRs and for S mutations in the FRs. However, it has been argued that the differences in intrinsic mutability among different regions of an antibody gene can generate a statistically significant bias even in the absence of any antigenic selection. We have modified the existing statistical method to include the effects of intrinsic mutability of different regions of an antibody gene. We used this method to analyse sequences of several B cell-derived monoclonals against T-dependent antigens, T-independent antigens, clones derived from lymphoma and amyloidogenic clones. Our sequence analysis indicates that even after correcting for the intrinsic mutability of antibody genes, statistical parameters fail to reflect the role of antigen-driven affinity selection in maturation of many clones. We suggest that, contrary to the basic assumption of such statistical methods, selection can act both for and against R mutations in the CDR as well as in the FR regions. In addition we have identified different methodological difficulties in the current uses of such statistical analysis of antibody genes.
Keywords: immunoglobulin variable regions, somatic mutation, sequence analysis
Introduction
The hallmark of cellular immunity is the development of a very large antibody repertoire using a handful of germline antibody genes. The diversity is generated by the combinatorial association of V, D and J genes with additional junctional diversity arising due to imprecise joining and N-region nucleotide insertion.1 Further antigen-driven affinity maturation by somatic mutations across the antibody V regions leads to increased affinity and specificity.1,2 As per the clonal selection theory, recombination of antibody genes provides the initial templates, which are further optimized by somatic mutations to increase affinity and specificity by an antigen-driven process, in which high affinity clones are positively selected and further amplified.3,4 Although the exact molecular mechanism of somatic mutations of antibody genes is not elucidated clearly, it is known that the rate of mutations in antibody genes is 105−106 times more than the normal mutational drift of somatic cells. The mutations are restricted to the V region and its immediate 5′ and 3′ flanks, extending to about 1·5 kb from the start of the V gene, and decaying exponentially from the 5′ end.5,6 Different sequence motifs for hypermutation, such as RGYW and TAA, have also been identified, both in human and in mouse immunoglobulin genes.7 Each variable region of an antibody can be divided into complementarity-determining regions (CDRs) and framework regions (FRs). CDRs of antibody variable regions are structurally more plastic than the beta-sheeted FRs and are involved directly in affinity and specificity. It is evident that mutations in critical locations in the FR regions are more likely to be structurally destructive than those in the CDR regions. However, mutations in the CDRs are more likely to alter the antigen-binding properties. Therefore, it is usually assumed that somatic hypermutations during antigenic selection tend to result in the accumulation of replacement mutations (R) over silent mutations (S) in the CDRs, whereas the opposite is true for FRs.8
It is of importance to determine whether a particular antibody sequence has been subjected to antigenic selection, or is the result of random mutation. The pattern of distribution of R and S mutations in the CDRs and FRs usually forms the basis of such analysis. Shlomchik et al.9 proposed a binomial distribution model to identify the bias in distribution of R mutations over S mutations in CDRs. This model considers that mutations could take place randomly in any portion of the antibody gene with equal chance; an R/S ratio > 2·925 in the case of CDR regions was considered as the signature of antigenic selection. Subsequently Chang and Casali10 showed that human antibody heavy chain variable region genes have a codon bias so that the CDR regions are more prone to replacement mutation than framework regions. They also used the binomial distribution model to verify whether a clone has undergone antigenic selection or not. Lossos et al.11 countered this binomial model and proposed a multinomial model for analysis of replacement mutations in antibody genes to detect the antigenic selection pressure.
According to the recent scientific literature, sequence analysis of antibody genes using Chang and Casali's method10 is utilized most widely to ascertain the involvement of antigenic selection in disease pathogenesis in cases of different autoimmune disorders12–17 and lymphomas.18–25 However, Chang and Casali's method does not consider the differences in the intrinsic mutability of various regions of antibody genes. Dunn-Walters and Spencer26 have shown that CDR regions of human germline antibody genes tend intrinsically to accumulate more R mutations over S mutations. They argued that such intrinsic bias could interfere in statistical analysis of antibody genes.
In the present work we have modified Chang and Casali's method to include the effects of intrinsic mutatibility of different regions of an antibody gene. We used statistical methods both as originally stated10 and after modification, to analyse sequences of several clones against T-dependent and T-independent antigens. Our results show that even after correcting for intrinsic mutability, statistical analysis of biased distribution of replacement mutations is too simplistic to ascertain the role of antigenic selection in maturation of a clone. We have used detailed sequence analysis, molecular models and information from existing literature to identify the limitations of such statistical analyses.
Materials and methods
Antibody sequences used for analysis
B cells producing antibodies against thymus dependent antigens usually undergo affinity maturation involving somatic hypermutations and antigenic selection. We have analysed sequences of several monoclonal antibodies against hepatitis B surface antigen, rabies and staphylococcal alpha-toxin as representatives of antibodies against T-dependent antigens. Details of these clones are given in Table 1. We have reported previously a high-affinity anti-HBs mouse monoclonal 5S.27 This antibody was obtained after repeated immunization with recombinant hepatitis B surface antigen (HBsAg). All other sequences have been collected from sequence databases and literature.28–32 An anti-lipopolysaccharide (LPS) mouse monoclonal 1F633 and an anti-meningococcal serogroup C polysaccharide (MCPS) mouse monoclonal 78·234 were used as representatives of antibodies against T-independent antigens, which usually do not undergo antigen-driven affinity maturation process. The existing method of sequence analysis is utilized widely in studies related to abnormal B cell development. We have analysed a few sequences of antibody chains of human marginal zone lymphoma and human amyloidogenic light chains, collected from the published literature.35,36 Authors of both these studies have analysed the sequences using Chang and Casali's method.10 All the sequences were numbered as per Kabat convention37 to identify the CDR and FR regions.
Table 1.
Particulars of antibody clones analysed
| Type | Specificity | Name | Human (H)/ mouse (M) | NCBI GenBank Accession no(s) | Reference |
|---|---|---|---|---|---|
| Against T-dependent antigen | Anti-HBsAg | 5S | M | AJ549501† | 27 |
| 5C3 | M | AF110503/AF110502 | 28 | ||
| H67 | M | L25333/L25332 | 29 | ||
| C6-9-1 | M | AF410257/AF410258 | – | ||
| T6J | H | AF027158/AF027159 | – | ||
| CL4MAb | H | AB012910/AB012909 | – | ||
| 23HN | H | U66190/U66189 | 30 | ||
| Anti-rabies | SOJA | H | AY172959/AY172961 | 31 | |
| SOJB | H | AY172958/AY172962 | 31 | ||
| Anti-staphylococcal alpha-toxin | CB STL-1 | H | S75627/S75625 | 32 | |
| Against T-independent antigen | Anti-LPS | 1F6 | M | U20144/U20143 | 33 |
| Anti-MCPS | 78·2 | M | AY229968/AY229967 | 34 | |
| Amyloidogenic light chains | MAR | H | AF026924 | 35 | |
| PAP | H | AF026932 | 35 | ||
| Marginal zone lymphoma | U86366 | H | U86366 | 36 | |
| AF004935 | H | AF004935 | 36 |
Sequence of the scFv derived from 5S.
Identification of germline sequences
Germline sequences of mouse antibodies were identified by searching the International ImMunoGeneTics database (using v-quest; http://imgt.cines.fr/textes/vquest/).38 Germline sequences of human antibodies were retrieved either from the v base database (using dnaplot, Center for Protein Engineering, MRC, Cambridge) or from the imgt database. All antibody sequences were compared with corresponding germline sequences to identify R- and S-type mutations in different FRs and CDRs. All further analyses were performed over those germline sequences. In all analyses, regions beyond FR3 were not considered as they form the junction region and the origin of junctions cannot be predicted conclusively.
Analysis of the intrinsic mutability of germline genes
Shapiro et al.39 have analysed a set of non-productively rearranged human VH genes to estimate the intrinsic mutability of a nucleotide in the context of two adjacent nucleotides. They proposed a mutability index (MI) of a base, in an antibody germline gene, which is the normalized mutability of that base when considered in the context of its adjacent bases irrespective of reading frames. Therefore, this mutability index is independent of the frame of translation and of the antigenic selection process. If the mutability index of a base is higher than 1, it is considered as a mutational hot spot, whereas MI < 1 indicates a cold spot for mutation. We have used this mutability matrix to calculate the mutability index (i.e. average of mutability indices in all three possible reading frames) of each base in a region and this was further used to calculate the average mutational propensity of a region (such as FR1 or CDR2). The MI of the total framework region of a germline antibody gene was calculated as:
 |
when m = 1–3 (considering three framework regions).
The average MI of the total CDR of a germline gene was calculated in the same fashion (here m = 1 and 2, as CDR3 was not considered for analysis).
Analysis of R and S mutations in V regions
Chang and Casali's10 method with the modification of Lossos et al.11 was used to analyse the pattern of distribution of mutations. As per this method, in the absence of any selection pressure, mutations can arise randomly across the germline gene. Therefore, the number of mutations in a particular region (such as FR or CDR) depends only upon the relative length (RL) of that region.
The probability of R mutations (Rf) that may arise due to a single base change in a particular region depends upon the codon usage in that region. For every germline sequence, Rf values for each FR and CDR were calculated. These values were averaged to obtain the average Rf values for the total FR (RfFR) and total CDR (RfCDR) of a germline gene. So:
When the total number of observed mutations is N, the expected number of R mutations in FR = N × P(RFR). The expected number of R and S mutations in the CDR can also be calculated in the same fashion.
The probability that an excess or scarcity of R mutations in CDR or FR occurred by chance was calculated by using the multinomial distribution function.11 The method is briefly as follows. Let the observed numbers of R mutations in FR and CDR be r1 and r2, respectively. Similarly, s1 and s2 are the observed numbers of S mutations in FR and CDR, respectively, and r1 + s1 + r2 + s2 = N.
The probability of observing r2 or more R mutations in CDR is:
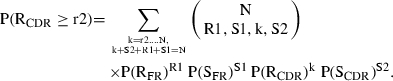 |
The likelihood value for R mutations in CDR was calculated as: P = P(RCDR > r2) + 0·5 × P(RCDR = r2). When P = 0·05, it was considered that the differences in observed and expected numbers of R mutations in CDR are not by chance but due to the antigenic selection of R mutations in CDR.
Similarly, the probability of observing r1 or fewer R mutations in FR is:
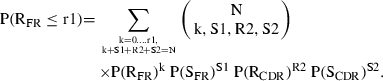 |
The likelihood value for R mutations in FR is: P = P(RFR < r1) + 0·5 × P(RFR = r1). When P = 0·05, it was considered that the antigenic selection has acted against R mutations in FR.
Modification of Chang and Casali's method
The basic assumption of Chang and Casali's method is that an antibody V region gene becomes somatically mutated randomly across its length. However, it is well known that certain regions of an antibody gene are intrinsically more susceptible to mutations, whereas some are mutational cold spots. To make the estimation more reliable we modified Chang and Casali's method to include the intrinsic differential mutability of different regions. We used the intrinsic mutability of bases in a V region gene as estimated above to calculate the relative mutational propensity (RM) of different regions. So the probability of a mutation in FR,
 |
When all bases are equally mutable (as considered by Chang and Casali), RMFR = RLFR.
Similarly, the probability of a mutation in CDR,
 |
so the modified expected frequencies of R and S mutations are:
In our modified method the probability of an R mutation depends upon the length, the codon usage as well as the intrinsic mutability of bases of that region. We reanalysed all sequences and modified frequencies were used to calculate the likelihood values using the multinomial distribution function. Inferences on antigenic selection of R mutations were drawn using those likelihood estimates as stated in the original method.
Molecular modelling of variable regions
Molecular models of the variable regions of the anti-HBs antibody 5S and its germline counterpart were generated by molecular modelling using the web-based antibody modeling software wam (http://antibody.bath.ac.uk/index.html).40 We used the ‘dead end elimination’ algorithm41 for side chain building and VFF screen42 for final screening.
Results
Distribution of R and S mutations
The germline genes for different antibodies considered in this work are shown in Table 2, along with the number of expected and observed values of R and S mutations in the FRs and CDRs as calculated by Chang and Casali's method. The same sequences were analysed by our modified method and the results are shown in Table 3. Although there are differences in numerical values of likelihood estimates obtained by these two methods, in most cases the inferences are similar. However, we preferred to use our modified method, as it incorporates the effects of intrinsic mutability of residues in an antibody germline gene.
Table 2.
Analysis of distribution of somatic mutations in different antibodies
| Clone | Chain | Germline gene | Expected R/S in FR† | Observed R/S in FR | P for FR | Expected R/S in CDR† | Observed R/S in CDR | P for CDR |
|---|---|---|---|---|---|---|---|---|
| 5S | VL | IGKV1-117*02 | 6·14/2·07 | 3/1 | 0·031 | 2·16/0·62 | 4/3 | 0·093 |
| VH | J558·42 | 11·01/3·67 | 9/3 | 0·180 | 3·48/0·83 | 4/3 | 0·365 | |
| 5C3 | VL | IGKV3-1*01 | 5·16/1·63 | 4/4 | 0·228 | 1·72/0·48 | 1/0 | 0·694 |
| VH | IGHV2S4*01 | 6·42/2·12 | 7/3 | 0·626 | 1·89/0·57 | 1/0 | 0·730 | |
| H67 | VL | IGKV3-2*01 | 1·16/0·36 | 1/0 | 0·418* | 0·38/0·1 | 1/0 | 0·191* |
| VH | IGHV1S8*01 | 7·65/2·43 | 2/7 | 0·001 | 2·41/0·5 | 4/0 | 0·143 | |
| C6-9-1 | VL | IGKV8-30*01 | 1·12/0·37 | 1/0 | < 0·001* | 0·41/0·10 | 1/0 | 0·205* |
| VH | IGHV1S133*01 | 8·13/2·73 | 5/7 | 0·132 | 2·49/0·65 | 2/0 | 0·838 | |
| T6J | VL | IGKV3-15*01 | 1·79/0·59 | 0/1 | 0·033* | 0·46/0·15 | 1/1 | 0·229* |
| VH | IGHV3-30*04 | 9·18/3·23 | 4/2 | 0·005 | 2·86/0·74 | 7/3 | 0·009 | |
| CL4MAb | VL | IGKV3-15*01 | 2·39/0·79 | 0/2 | 0·013* | 0·62/0·2 | 2/0 | 0·064* |
| VH | IGHV3-30*04 | 12·05/4·23 | 7/2 | 0·015 | 3·75/0·97 | 10/2 | 0·001 | |
| 23HN | VL | IGKV3-20*01 | 4·72/1·57 | 4/2 | 0·309 | 1·32/0·39 | 1/1 | 0·576 |
| VH | IGHV3-33*01 | 12·65/4·44 | 5/8 | 0·001 | 3·97/0·93 | 7/2 | 0·062 | |
| SOJA | VL | IGKV3-11*01 | 4·77/1·60 | 2/2 | 0·031 | 1·27/0·36 | 4/0 | 0·015 |
| VH | IGHV3-23*01 | 4·03/1·4 | 0/0 | 0·001 | 1·23/0·35 | 6/1 | < 0·001 | |
| SOJB | VL | IGLV3-21*03 | 8·13/2·98 | 6/2 | 0·133 | 2·27/0·63 | 5/1 | 0·039 |
| VH | IGHV2-5*10 | 11·96/4·16 | 9/9 | 0·068 | 3·75/1·31 | 2/2 | 0·851 | |
| CB STL-1 | VL | IGLV3-25*03 | 12·59/4·52 | 10/6 | 0·138 | 3·78/1·12 | 6/0 | 0·117 |
| VH | IGHV1-46*03 | 19·72/6·64 | 13/8 | 0·011 | 6·22/1·41 | 9/4 | 0·117 | |
| 1F6 | VL | IGKV1-110*01 | 1·13/0·38 | 1/0 | 0·435* | 0·38/0·11 | 0/1 | 0·674* |
| VH | IGHV1S137*01 | 4·69/1·49 | 2/5 | 0·034 | 1·48/0·33 | 1/0 | 0·630 | |
| 78·2 | VL | IGKV5-43*01 | 0/0 | 0/0 | – | 0/0 | 0/0 | – |
| VH | IGHV8S7*01 | 6·16/2·17 | 1/2 | 0·009 | 2·16/0·50 | 6/2 | 0·006 | |
| MAR | VL | 2b2 (lambda II) | 10·25/3·54 | 9/5 | 0·278 | 3·14/1·06 | 4/0 | 0·289 |
| PAP | VL | lambda III.1 | 11·77/4·09 | 7/4 | 0·018 | 3·21/0·93 | 9/0 | 0·001 |
| U86366 | VH | DP 65 | 9·63/3·38 | 8/7 | 0·228 | 4·81/1·17 | 2/2 | 0·933 |
| AF004935 | VH | COS 16 | 9·15/2·79 | 5/3 | 0·024 | 3·94/1·11 | 9/0 | 0·005 |
Calculated using Chang and Casali's method. P = 0·05 are shown in bold type.
Cases where the total number of mutations is very low (≤ 4) and a multinomial distribution model (with a cut-off value of P = 0·05) cannot be used. Germline sequences retrieved from the imgt database are shown in imgt format (i.e. gene name * allele number).
Table 3.
Analysis of distribution of somatic mutations in different antibodies using the modified method
| R/S in FR | R/S in CDR | ||||||||
|---|---|---|---|---|---|---|---|---|---|
| Clone | Chain | Expected | Observed | P for FR | Selection against R in FR | Expected | Observed | P for CDR | Selection for R in CDR |
| 5S | VL | 5·71/1·93 | 3/1 | 0·058 | No | 2·61/0·75 | 4/3 | 0·173 | No |
| VH | 10·44/3·54 | 9/3 | 0·257 | No | 3·89/1·13 | 4/3 | 0·457 | No | |
| 5C3 | VL | 4·89/1·56 | 4/4 | 0·284 | No | 1·99/0·56 | 1/0 | 0·759 | No |
| VH | 6·04/1·99 | 7/3 | 0·708 | No | 2·28/0·69 | 1/0 | 0·810 | No | |
| H67 | VL | 1·1/0·34 | 1/0 | 0·451* | NA | 0·45/0·11 | 1/0 | 0·224* | NA |
| VH | 7·31/2·32 | 2/7 | 0·002 | Yes | 2·79/0·58 | 4/0 | 0·211 | No | |
| C6-9-1 | VL | 1·08/0·36 | 1/0 | 0·462* | NA | 0·45/0·11 | 1/0 | 0·226* | NA |
| VH | 7·67/2·57 | 5/7 | 0·083 | No | 2·98/0·78 | 2/0 | 0·715 | No | |
| T6J | VL | 1·77/0·55 | 0/1 | 0·034* | NA | 0·54/0·14 | 1/1 | 0·268* | NA |
| VH | 8·68/2·75 | 4/2 | 0·012 | Yes | 3·78/0·79 | 7/3 | 0·04 | Yes | |
| CL4MAb | VL | 2·36/0·73 | 0/2 | 0·014* | NA | 0·72/0·19 | 2/0 | 0·086* | NA |
| VH | 11·39/3·61 | 7/2 | 0·03 | Yes | 4·96/1·04 | 10/2 | 0·009 | Yes | |
| 23HN | VL | 4·42/1·48 | 4/2 | 0·386 | No | 1·62/0·48 | 1/1 | 0·671 | No |
| VH | 11·76/4·14 | 5/8 | 0·002 | Yes | 4·94/1·26 | 7/2 | 0·153 | No | |
| SOJA | VL | 4·52/1·57 | 2/2 | 0·045 | Yes | 1·49/0·42 | 4/0 | 0·026 | Yes |
| VH | 3·74/1·3 | 0/0 | 0·002 | Yes | 1·53/0·43 | 6/1 | < 0·001 | Yes | |
| SOJB | VL | 8·04/2·94 | 6/2 | 0·144 | No | 2·36/0·65 | 5/1 | 0·046 | Yes |
| VH | 12·03/4·18 | 9/9 | 0·102 | No | 4·45/1·34 | 2/2 | 0·902 | No | |
| CB STL-1 | VL | 12·5/4·48 | 10/6 | 0·147 | No | 3·88/4·48 | 6/0 | 0·127 | No |
| VH | 18·04/6·08 | 13/8 | 0·044 | Yes | 8·05/1·83 | 9/4 | 0·343 | No | |
| 1F6 | VL | 1·07/0·35 | 1/0 | 0·467* | NA | 0·45/0·13 | 0/1 | 0·700* | NA |
| VH | 4·39/1·4 | 2/5 | 0·054 | No | 1·81/0·4 | 1/0 | 0·719 | No | |
| 78·2 | VL | 0/0 | 0/0 | – | NA | 0/0 | 0/0 | – | NA |
| VH | 5·91/2·08 | 1/2 | 0·002 | Yes | 2·44/0·57 | 6/2 | 0·012 | Yes | |
| MAR | VL | 9·95/3·43 | 9/5 | 0·329 | No | 3·45/1·17 | 4/0 | 0·358 | No |
| PAP | VL | 11·47/3·99 | 7/4 | 0·025 | Yes | 3·52/1·02 | 9/0 | 0·003 | Yes |
| U86366 | VH | 9·21/3·19 | 8/7 | 0·296 | No | 5·31/1·29 | 2/2 | 0·958 | No |
| AF004935 | VH | 8·8/2·65 | 5/3 | 0·036 | Yes | 4·33/1·22 | 9/0 | 0·009 | Yes |
P-values = 0·05 are shown in bold type.
Cases where the total number of mutations is very low (≤4). Inferences drawn from the statistics are given as yes/no. NA = not applicable.
The basic assumption of these statistical analyses is that the biased accumulation of R mutations in CDRs is the signature of the process of antigenic selection of a clone. We analysed sequences of clones raised against T-dependent antigens after repeated immunization, expecting that they would have the signature of antigenic selection. However, the inferences from statistical analyses of these sequences are rather ambiguous (Table 3). Among all the anti-HBs clones analysed here, only the heavy chains of T6J and CL4MAb have the signature of antigenic selection, both in the CDRs and FRs (Table 3). Of the two anti-rabies human antibodies considered here, only SOJA has the signature of antigenic selection in both the chains. For the anti-staphylococcal antibody CB STL-1, another member of the T-dependent group, only the heavy chain FR has the signature of antigenic selection against R mutations.
The mouse monoclonal 1F6, against the T-independent antigen LPS, does not show any significant biased accumulation of R mutations over S mutations in the CDR (Table 3). This indicates that the antibody is not antigen-selected as expected in the case of a T-independent response. However the heavy chain of a mouse antibody 78·2, against the T-independent antigen MCPS, has the signature of antigenic selection. The light chain of this clone does not have any somatic mutations at all.
Intrinsic mutability and antigenic selection
The expected frequencies of R mutations, due to a single base change in CDRs and FRs of all the germline genes analysed here, are shown in Fig. 1a. It is evident from Fig. 1a that the CDRs of these germline genes have a higher tendency to obtain R mutations than their respective FRs due to the codon usage pattern (mean RfCDR/RfFR = 1·055 ± 0·026).
Figure 1.

CDRs are intrinsically more prone to R mutations in comparison to FRs. (a) Frequencies of R mutations (Rf) as expected for a single base change for the CDRs and FRs of germline sequences of clones analysed. The mean RfCDR/RfFR = 1·055 ± 0·026. (b) Average mutability index (MI) of the CDRs and FRs of germline sequences of these clones. The mean MICDR/MIFR = 1·226 ± 0·097. Legends of germline genes, which are discussed in detail, are shown here and all other germline genes are shown as (•).
Figure 1b shows the intrinsic mutability indices of the CDRs and FRs of all these germline sequences. CDRs of all these germline sequences are intrinsically more susceptible to mutations than FR regions (mean MICDR/MIFR = 1·226 ± 0·097). It is worth noting that there is no particular pattern of MICDR/MIFR for germline genes of clones that have biased distribution of R mutations. For example, MICDR/MIFR of the germline gene of U86366 is 1·167 and that of the germline for AF004935 is 1·1817. The RfCDR/RfFR values are 1·087 and 1·018, respectively. Although CDRs of both the germlines are more prone to R mutations than FRs, the observed number of R mutations is significantly higher than expected only in the case of AF004935.
Evidence of antigenic selection in the VH gene of the clone 78·2 would not be expected, as this antibody was raised against the T-independent antigen MCPS. However, the statistical analysis shows the evidence of selection both in CDR and FR (Table 3). We therefore analysed the intrinsic mutability of the germline gene of this chain. Usually a mutation at the 1st- or 2nd-base position of a codon generates an R mutation and a mutation at the 3rd-base position is likely to generate an S mutation due to the redundancy in the genetic code. We found that the 1st- and 2nd-base positions of codons in the CDRs of this germline gene have a mutability index (MI) greater than 1, thus indicating they are mutational hot spots (Fig. 2a). In addition, the 1st- and 2nd-base positions in FRs are mutational cold spots (MI < 1). This biased intrinsic mutability could cause a biased distribution of mutations, normally indicative of antigenic selection, even in the absence of such selection.
Figure 2.

MI of bases in codons of FRs and CDRs of VH germline sequences of four different clones are plotted with respective expected and observed number of R mutations. (a) 78·2, (b) 5S, (c) AF004935 and (d) U86366. MI > 1 indicates a mutational hot spot and MI < 1 indicates a mutational cold spot. (a) and (c): high MI, of bases in CDRs, correlates with the presence of higher number of R mutations in CDRs. (b) and (d): although the residues of CDRs have high MI values, the observed numbers of R mutations in CDRs are not significantly higher than expected. Selection against R mutations in CDRs may be one of the reasons for such patterns of distribution of R mutations.
In contrast, the anti-HBs antibody 5S would be expected to show the evidence of antigenic selection, but does not (Table 3). The 1st- and 2nd-base positions of CDRs, of the VH germline gene of 5S are mutational hot spots (Fig. 2b). Analysis of codon usage indicates that the expected R/S ratio for CDR1 and CDR2 of this chain are 1·127/0·116 (= 9·7) and 2·945/0·834 (= 3·53), respectively. However, the observed R/S ratio for these regions are less than expected (2/2 and 2/1, respectively). Therefore antigen-driven selection against R mutations may be considered as one of the causes of the lower number of observed R mutations in CDR.
Tierens et al.36 used Chang and Casali's method to analyse antibody sequences of two marginal zone lymphoma clones AF004935 and U86366. As the analysis indicated a biased distribution of R mutations, the authors concluded that the clone AF004935 was antigen-selected. The clone U86366 was not considered as an antigen-selected one, as there was no such bias in distribution of R mutations. However, our analysis indicates that such conclusions may not be valid. Sequence analysis shows that average mutability indices for the 1st- and 2nd-base positions of codons in FRs of the germline VH gene of AF004935 are low and these base positions in CDRs are intrinsically mutational hot spots (Fig. 2c). Such an intrinsic mutability pattern, along with a codon bias for more R mutations in CDR (RfCDR/RfFR = 1·018) indicates that the hypermutation process must have preferentially distributed R mutations in favour of CDRs over FRs, and such mutations were either positively selected in the antigen-driven selection process or retained as ‘neutral’ mutations.
In the germline VH gene of the clone U86366, the 2nd-base positions in codons of CDRs are mutational hot spots (Fig. 2d) and the CDRs of this germline have a codon bias to accumulate more R mutations over FRs (RfCDR/RfFR = 1·087). Therefore, it can be expected that the hypermutation process should preferentially generate more R mutations in CDRs over FRs. However, the number of observed R mutations in CDRs of this clone is lower than expected. Therefore, it is possible that the antigen-driven selection against R mutations may be one of the causes of the lower number of observed R mutations in CDRs of the mature clone (U86366). Similar observations were made in the case of the human amyloidogenic light chains MAR and PAP (data not shown).
Structural significance of somatic mutations
The variable regions of the anti-HBs mouse monoclonal 5S and its germline counterpart were modelled to understand the structural significance of somatic mutations. These models were discussed in detail in one of our earlier articles.27Table 4 lists the somatic replacement mutations, their structural positions and average mutability index of nucleotides in those positions in germline genes.
Table 4.
Structural positions of replacement mutations in mouse monoclonal 5S
| Position | Mutational motif | Mutability index | Probability of R | |
|---|---|---|---|---|
| Light chain | ||||
| Binding site | ||||
| Asn L28 to Tyr | CDR1 | 1·98 | 0·88 | |
| Asn L30 to Asp | CDR1 | 1·28 | 0·88 | |
| VH/VL interface | ||||
| Tyr L36 to His | FR2 | TAC | 1·78 | 0·85 |
| Leu L55 to Phe | CDR2 | 0·86 | 0·88 | |
| Solvent exposed, away from binding site | ||||
| Asp L70 to Glu | FR3 | 0·88 | 0·89 | |
| Tyr L87 to Phe | FR3 | 1·92 | 0·88 | |
| Solvent inaccessible, away from binding site | ||||
| Ser L25 to Ala | CDR1 | 1·22 | 0·66 | |
| Heavy chain | ||||
| Binding site | ||||
| Glu H50 to Thr | CDR2 | RGYW | 2·10 | 0·66 |
| Asn H54 to Ile | CDR2 | 0·89 | 0·88 | |
| Solvent exposed, away from binding site | ||||
| Val H12 to Ala | FR1 | 0·36 | 0·66 | |
| Lys H13 to Thr | FR1 | AANB | 1·52 | 0·87 |
| Thr H28 to Ser | FR1 | 0·93 | 0·66 | |
| Thr H30 to Ser | FR1 | WDCH | 1·40 | 0·66 |
| Ser H31 to Thr | CDR1 | RGYW | 1·39 | 0·88 |
| Gln H43 to Arg | FR2 | 0·78 | 0·87 | |
| Gln H81 to His | FR3 | DGHD | 0·91 | 0·87 |
| Ser H82a to Asn | FR3 | RGYW | 0·94 | 0·88 |
| Solvent inaccessible, away from binding site | ||||
| Val H18 to Leu | FR1 | DGHD | 0·94 | 0·66 |
| Met H34 to Ile | CDR1 | DGHD | 0·91 | 1·00 |
| Met H80 to Leu | FR3 | 1·34 | 1·00 | |
Residues up to FR3 are shown here.
In the light chain there are two R mutations at the binding site and two R mutations at the VH/VL interface, which are usually considered critical for interchain packing. Although mutability index of the interface residue L55 is low, it is a specificity-determining residue as per Padlan et al.43 Ramirez-Benitez et al.44 have found that this residue is frequently mutated, although not in contact with the antigen. Therefore, it can be assumed that the mutation at L55 has been selected as it helps in better interchain packing. FRs of the germline light chain have positions with very high mutability indices (such as Lys L45, MI = 1·84). Absence of replacement mutation in these positions indicates clearly that such mutations were not selected, as they could be destructive. All the four silent mutations in the light chain are in the 3rd-base positions and all these nucleotides have high mutability indices.
In the heavy chain of 5S, two R mutations are at the binding site. Ile H54 is at the tip of the rim created by CDR H2. An R mutation, from a charged residue to a non-charged residue, along with the low mutability index of this position in the germline sequence indicates that antigen-driven affinity maturation has selected this replacement mutation for optimized affinity and specificity. Most of the R mutations in the heavy chain are at positions away from the binding site. A majority of these residues are solvent-exposed and are at positions where mutations are well tolerated in the antibody structure. Although the average mutability indices of the FRs are low (1·02, 0·92, 0·99 for FR1, FR2 and FR3, respectively) there are also a few mutational hot spots in the FRs (e.g. H37, H38). The absence of R mutations at those positions coincides with their structural importance in the beta-sheeted structure. All observed S mutations are at the 3rd-base position in the respective codons and except H7; in all other cases such positions have a high mutability index in the germline sequence.
Discussion
This is the first statistical analysis of antigenic selection taking into account the intrinsic mutability of residues of antibody germline genes. We have utilized our modified method, which incorporates this intrinsic mutability, along with the original statistical method10 to analyse sequences of several clones against both T-dependent and T-independent antigens. It is usually assumed that the sequence of an antibody, selected by a T-dependent antigen, would have the expected signature of antigenic selection, while a clone not subjected to this process would not. However, both the methods failed to accurately identify the clones that were clearly derived through maturation in the presence of T-dependent antigens.
We observed that CDRs of all the germline sequences analysed here are intrinsically more mutable than FRs (Fig. 1b). All the CDRs were more prone to accumulate R mutations over S mutations due to codon usage (Fig. 1a). These intrinsic biases in the germline gene can generate a statistically significant biased distribution of R mutations, even in the absence of antigenic selection. Such a situation was observed in case of the mouse monoclonal 78·2 which was raised against the T-independent antigen MCPS (Table 3 and Fig. 2a).
One of the assumptions made during the statistical analyses is that only positive selection of R mutations occurs in CDRs in comparison to selection against R mutations in FRs. In fact, positive effects of R mutations in CDRs are over-emphasized in the scientific literature in comparison to the deleterious effects of such mutations because of the difficulties in obtaining evidences for B-cell wastage during in vivo somatic hypermutations. Based on the variability of amino acids in VH and VL sequences present in the Kabat database and the ratios of replacement-to-silent mutations, it has been estimated that ∼25–50% of potential mutations are absent from the database.45In vitro mutagenesis studies have also indicated that excess mutations at CDRs can destroy binding, change specificity and may alter secretion of antibody molecules.45,46
The 1st- and 2nd-base positions of CDRs of the germline gene for the heavy chain of 5S are mutational hot spots (Fig. 2b). However, the number of observed R mutations in CDR H2 is less than expected. Selection against the R mutations in CDRs that decrease the binding affinity can be one of the reasons for such a pattern of distribution of R mutations. By in vitro mutagenesis, Wiens et al.45 has shown that accumulation of excess mutations in CDR-H2 reduced the affinity of approximately 50% of the mutants. In contrast, all mutations in the FRs may not be deleterious to the structural scaffold of an antibody molecule. We observed that in the case of the heavy chain of 5S, the number of observed R mutations in the FRs is not significantly low. Molecular modelling of the variable regions of this mouse monoclonal antibody indicates that all such R mutations in FRs are away from the binding site and at positions where replacement mutations can be structurally tolerated, e.g. in the solvent-exposed surfaces. Five of eight such mutations are present at known hypermutation motifs. It is possible that these mutations are not involved directly in antigen binding and they may have originated as background mutations during repeated antigenic selection. Gonzalez-Fernandez et al.47 have shown that low-dose immunization favours the selection of a more focused mutational pattern with a low mutational background, and high-dose immunization or repeated immunization favours high background mutations. Such background mutations are either conservative mutations, or away from the binding site and are well tolerated.
Another problem associated with these statistical methods is that they compare sequences of just one clone with the germline sequences to detect antigen-driven selection pressure above random mutational drift, which is akin to tossing a coin only a few times to detect any bias in it. Analysis of the distribution pattern of R and S mutations are used extensively to analyse the evolution of a gene under selection pressure. Sequence analyses of HIV-1 and influenza virus genes to detect directional evolution in response to the host immune system are worth noting here.48–51 However, all such studies involve analysis of a large number of sequences, clustering by phylogenic analysis and analysis of R/S ratio at different codon positions. Such studies are not performed for the analysis of antibody genes. Similar detailed studies of multiple clones against a particular antigen would provide a clearer idea of the effects of antigen-driven selection pressure.
Chang and Casali's method calculates the likelihood estimates for the observed distribution of R mutations in different regions of an antibody gene. However, such likelihood estimates depend essentially upon the total number of mutations observed. When the total number of mutations is very low (less than 4), the likelihood that all R mutations are in the CDRs may be greater than 0·05 (Fig. 3a). Such a situation can lead us to a wrong conclusion. As multinomial probability distribution is used to calculate the likelihood values, the chances of observing events having likelihood values = 0·05 become very high, with an increase in the total number of mutations (Fig. 3b). Therefore, when the total mutational load is very high, more stringent constraints (i.e. a cut-off value considerably less than 0·05) may need to be used to obtain a biologically meaningful conclusion.
Figure 3.

Dependence of likelihood estimate (P) on total number of mutations. (a) Simulation of cases, with different numbers of mutations, considering all R mutations in CDR. As per the statistical analyses, such a situation is an extreme case of antigenic selection. For very low mutational loads, the likelihood (P) of all R mutations being in the CDRs is > 0·05. (b) Simulation of cases, where R in the CDR is greater than expected and R in FR is less than expected, for different mutational loads. The percentage of cases with P ≤ 0·05 is plotted against the total number of mutations. When the mutational load is very high, the chance of obtaining cases with P ≤ 0·05 is also very high.
Analysis of molecular signatures of antigen-driven affinity selection is of immense use in the studies of normal and abnormal B cell development. Extensive work has already been conducted to simulate the general behaviour of the antibody repertoire during the affinity maturation process.52–56 It is evident from such studies that the emergence of an affinity mature clone is the net result of a stochastic process which depends upon time, dose and the number of exposures to the antigen. Comparison of V-region sequences of a single clone with germline sequences cannot provide meaningful information of such a history-dependent process. Rather, clonal analysis of a large panel of clones collected over a period of time may provide a clearer picture about the involvement of antigenic selection. However, such an analysis is not always possible, particularly in cases of human immune disorders due to lack of samples.
The process of somatic hypermutation has an intrinsic bias for accumulating replacement mutations in CDRs over FRs. The process of selection could act either for or against such mutations, depending upon their relative contribution to affinity and structural integrity. A few critical replacement mutations in CDRs may be sufficient to increase the affinity by a large extent, thereby providing a selective advantage to the clone. However, the increase in affinity may not occur beyond a point. There is also a possibility that some R mutations in the CDRs may actually decrease the affinity while those in the FRs may be well tolerated. Hence, with repeated exposure to the antigen, a pattern different from the expected one may arise. The increase in the total mutational load, without significantly affecting the binding characteristics of the clone, may alter differentially the number and distribution of R/S mutations in various regions of an antibody molecule. Therefore, we suggest that simple statistical analysis of the distribution pattern of somatic mutations in a clone cannot be utilized as a reliable tool to state whether or not an antibody is a product of antigen-driven selection. In view of the complexity of factors involved, the analysis of sequences from a population of clones reflecting multiple markers of an antigen-driven humoral response might be more reliable for reaching a valid conclusion.
Acknowledgments
We are thankful to Dr Tapan Nayak and Dushyanth Krishnamurthy for their valuable suggestions. We wish to thank Dr Srinivas G. Mathur, Dr Rahul Pal and Dr Satyajit Rath for critical reading of this article. This work was funded by a grant to S. Sinha from the Department of Biotechnology, India.
Abbreviations
- CDR
complementarity-determining region
- FR
framework region
- LPS
lipopolysaccharide
- MCPS
meningococcal serogroup C polysaccharide
- MI
mutability index
- R
replacement
- S
silent
- HBsAg
hepatitis B surface antigen
- anti-HBs
anti-hepatitis B surface antigen antibody
References
- 1.Tonegawa S. Somatic generation of antibody diversity. Nature. 1983;302:575–81. doi: 10.1038/302575a0. [DOI] [PubMed] [Google Scholar]
- 2.French DL, Laskov R, Scharff MD. The role of somatic hypermutation in the generation of antibody diversity. Science. 1989;244:1152–7. doi: 10.1126/science.2658060. [DOI] [PubMed] [Google Scholar]
- 3.Lederberg J. Genes and antibodies. Science. 1959;129:1649–53. doi: 10.1126/science.129.3364.1649. [DOI] [PubMed] [Google Scholar]
- 4.Berek C. The development of B cells and the B-cell repertoire in the microenvironment of the germinal center. Immunol Rev. 1992;126:5–19. doi: 10.1111/j.1600-065x.1992.tb00628.x. [DOI] [PubMed] [Google Scholar]
- 5.Storb U. The molecular basis of somatic hypermutation of immunoglobulin genes. Curr Opin Immunol. 1996;8:206–14. doi: 10.1016/s0952-7915(96)80059-8. [DOI] [PubMed] [Google Scholar]
- 6.Rada C, Milstein C. The intrinsic hypermutability of antibody heavy and light chain genes decays exponentially. EMBO J. 2001;20:4570–6. doi: 10.1093/emboj/20.16.4570. [DOI] [PMC free article] [PubMed] [Google Scholar]
- 7.Rogozin IB, Kolchanov NA. Somatic hypermutagenesis in immunoglobulin genes. II. Influence of neighbouring base sequences on mutagenesis. Biochim Biophys Acta. 1992;1171:11–8. doi: 10.1016/0167-4781(92)90134-l. [DOI] [PubMed] [Google Scholar]
- 8.Ikematsu W, Kobarg J, Ikematsu H, Ichiyoshi Y, Casali P. Clonal analysis of a human antibody response. III. Nucleotide sequences of monoclonal IgM, IgG, and IgA to rabies virus reveal restricted V kappa gene utilization, junctional V kappa J kappa and V lambda J lambda diversity, and somatic hypermutation. J Immunol. 1998;161:2895–905. [PubMed] [Google Scholar]
- 9.Shlomchik MJ, Aucoin AH, Pisetsky DS, Weigert MG. Structure and function of anti-DNA autoantibodies derived from a single autoimmune mouse. Proc Natl Acad Sci USA. 1987;84:9150–4. doi: 10.1073/pnas.84.24.9150. [DOI] [PMC free article] [PubMed] [Google Scholar]
- 10.Chang B, Casali P. The CDR1 sequences of a major proportion of human germline Ig VH genes are inherently susceptible to amino acid replacement. Immunol Today. 1994;15:367–73. doi: 10.1016/0167-5699(94)90175-9. [DOI] [PMC free article] [PubMed] [Google Scholar]
- 11.Lossos IS, Tibshirani R, Narasimhan B, Levy R. The inference of antigen selection on Ig genes. J Immunol. 2000;165:5122–6. doi: 10.4049/jimmunol.165.9.5122. [DOI] [PubMed] [Google Scholar]
- 12.Behrendt M, Partridge LJ, Griffiths B, Goodfield M, Snaith M, Lindsey NJ. The role of somatic mutation in determining the affinity of anti-DNA antibodies. Clin Exp Immunol. 2003;131:182–9. doi: 10.1046/j.1365-2249.2003.02026.x. [DOI] [PMC free article] [PubMed] [Google Scholar]
- 13.Jury KM, Loeffler D, Eiermann TH, Ziegler B, Boehm BO, Richter W. Evidence for somatic mutation and affinity maturation of diabetes associated human autoantibodies to glutamate decarboxylase. J Autoimmun. 1996;9:371–7. doi: 10.1006/jaut.1996.0050. [DOI] [PubMed] [Google Scholar]
- 14.Lieby P, Soley A, Knapp AM, Cerutti M, Freyssinet JM, Pasquali JL, Martin T. Memory B cells producing somatically mutated antiphospholipid antibodies are present in healthy individuals. Blood. 2003;102:2459–65. doi: 10.1182/blood-2003-01-0180. [DOI] [PubMed] [Google Scholar]
- 15.Lopez Bergami P, Mateos P, Hoebeke J, Levin MJ, Baldi A. Sequence analysis, expression, and paratope characterization of a single-chain Fv fragment for the eukaryote ribosomal P proteins. Biochem Biophys Res Commun. 2003;301:819–24. doi: 10.1016/s0006-291x(02)03074-7. [DOI] [PubMed] [Google Scholar]
- 16.Giles IP, Haley JD, Nagl S, Isenberg DA, Latchman DS, Rahman A. A systematic analysis of sequences of human antiphospholipid and anti-beta2-glycoprotein I antibodies: the importance of somatic mutations and certain sequence motifs. Semin Arthritis Rheum. 2003;32:246–65. doi: 10.1053/sarh.2003.49994. [DOI] [PubMed] [Google Scholar]
- 17.Li Z, Schettino EW, Padlan EA, Ikematsu H, Casali P. Structure–function analysis of a lupus anti-DNA autoantibody. central role of the heavy chain complementarity-determining region 3 Arg in binding of double- and single-stranded DNA. Eur J Immunol. 2000;30:2015–26. doi: 10.1002/1521-4141(200007)30:7<2015::AID-IMMU2015>3.0.CO;2-5. [DOI] [PMC free article] [PubMed] [Google Scholar]
- 18.Aiello A, Du MQ, Diss TC, et al. Simultaneous phenotypically distinct but clonally identical mucosa-associated lymphoid tissue and follicular lymphoma in a patient with Sjogren's syndrome. Blood. 1999;94:2247–51. [PubMed] [Google Scholar]
- 19.Matolcsy A, Schattner EJ, Knowles DM, Casali P. Clonal evolution of B cells in transformation from low- to high-grade lymphoma. Eur J Immunol. 1999;29:1253–64. doi: 10.1002/(SICI)1521-4141(199904)29:04<1253::AID-IMMU1253>3.0.CO;2-8. [DOI] [PMC free article] [PubMed] [Google Scholar]
- 20.Capello D, Cerri M, Muti G, et al. Molecular histogenesis of posttransplantation lymphoproliferative disorders. Blood. 2003;102:3775–85. doi: 10.1182/blood-2003-05-1683. [DOI] [PubMed] [Google Scholar]
- 21.Miklos JA, Swerdlow SH, Bahler DW. Salivary gland mucosa-associated lymphoid tissue lymphoma immunoglobulin V (H) genes show frequent use of V1–69 with distinctive CDR3 features. Blood. 2000;95:3878–84. [PubMed] [Google Scholar]
- 22.Endo S, Zhang SJ, Saito T, Kouno M, Kuroiwa T, Washiyama K, Kumanishi T. Primary malignant lymphoma of the brain: mutation pattern of rearranged immunoglobulin heavy chain gene. Jpn J Cancer Res. 2002;93:1308–16. doi: 10.1111/j.1349-7006.2002.tb01239.x. [DOI] [PMC free article] [PubMed] [Google Scholar]
- 23.Chapman CJ, Zhou JX, Gregory C, Rickinson AB, Stevenson FK. VH and VL gene analysis in sporadic Burkitt's lymphoma shows somatic hypermutation, intraclonal heterogeneity, and a role for antigen selection. Blood. 1996;88:3562–8. [PubMed] [Google Scholar]
- 24.Sahota SS, Leo R, Hamblin TJ, Stevenson FK. Myeloma VL and VH gene sequences reveal a complementary imprint of antigen selection in tumor cells. Blood. 1997;89:219–26. [PubMed] [Google Scholar]
- 25.Degan M, Rupolo M, Bo MD, et al. Mutational status of IgVH genes consistent with antigen-driven selection but not percent of mutations has prognostic impact in B-cell chronic lymphocytic leukemia. Clin Lymphoma. 2004;5:123–6. doi: 10.3816/clm.2004.n.019. [DOI] [PubMed] [Google Scholar]
- 26.Dunn-Walters DK, Spencer J. Strong intrinsic biases towards mutation and conservation of bases in human IgVH genes during somatic hypermutation prevent statistical analysis of antigen selection. Immunology. 1998;95:339–45. doi: 10.1046/j.1365-2567.1998.00607.x. [DOI] [PMC free article] [PubMed] [Google Scholar]
- 27.Bose B, Chugh DA, Kala M, Acharya SK, Khanna N, Sinha S. Characterization and molecular modeling of a highly stable anti-hepatitis B surface antigen scFv. Mol Immunol. 2003;40:617–31. doi: 10.1016/j.molimm.2003.07.002. [DOI] [PubMed] [Google Scholar]
- 28.zu Putlitz J, Skerra A, Wands JR. Intracellular expression of a cloned antibody fragment interferes with hepatitis B virus surface antigen secretion. Biochem Biophys Res Commun. 1999;255:785–91. doi: 10.1006/bbrc.1999.0149. [DOI] [PubMed] [Google Scholar]
- 29.Ryu CJ, Jin BR, Chung HK, Han MH, Hong HJ. Cloning and characterization of cDNAs coding for heavy and light chains of a monoclonal antibody specific for the S antigen of hepatitis B virus. Gene. 1994;144:313–14. doi: 10.1016/0378-1119(94)90398-0. [DOI] [PubMed] [Google Scholar]
- 30.Ryu CJ, Chung HK, Hong HJ. Cloning and sequence analysis of cDNAs encoding the heavy and light chain variable regions of a human monoclonal antibody with specificity for hepatitis B surface antigen. Biochim Biophys Acta. 1998;1380:151–5. doi: 10.1016/s0304-4165(98)00006-3. [DOI] [PubMed] [Google Scholar]
- 31.Prosniak M, Faber M, Hanlon CA, Rupprecht CE, Hooper DC, Dietzschold B. Development of a cocktail of recombinant-expressed human rabies virus-neutralizing monoclonal antibodies for postexposure prophylaxis of rabies. J Infect Dis. 2003;188:53–6. doi: 10.1086/375247. [DOI] [PubMed] [Google Scholar]
- 32.Heveker N, Hansen A, Hungerer KD, von Baehr R, Glaser RW. A human monoclonal antibody with the capacity to neutralize Staphylococcus aureus alpha-toxin. Hum Antibodies Hybridomas. 1994;5:18–24. [PubMed] [Google Scholar]
- 33.Pollack M, Koles NL, Preston MJ, Brown BJ, Pier GB. Functional properties of isotype-switched immunoglobulin M (IgM) and IgG monoclonal antibodies to Pseudomonas aeruginosa lipopolysaccharide. Infect Immun. 1995;63:4481–8. doi: 10.1128/iai.63.11.4481-4488.1995. [DOI] [PMC free article] [PubMed] [Google Scholar]
- 34.Rubinstein LJ, Stein KE. Murine immune response to the Neisseria meningitidis group C capsular polysaccharide. II. Specificity. J Immunol. 1988;141:4357–62. [PubMed] [Google Scholar]
- 35.Perfetti V, Ubbiali P, Vignarelli MC, et al. Evidence that amyloidogenic light chains undergo antigen-driven selection. Blood. 1998;91:2948–54. [PubMed] [Google Scholar]
- 36.Tierens A, Delabie J, Pittaluga S, Driessen A, DeWolf-Peeters C. Mutation analysis of the rearranged immunoglobulin heavy chain genes of marginal zone cell lymphomas indicates an origin from different marginal zone B lymphocyte subsets. Blood. 1998;91:2381–6. [PubMed] [Google Scholar]
- 37.Kabat EA, Wu TT, Perry HM, Gottesman KS, Foeller C. Sequences of Proteins of Immunological Interest. 5. Bethesda, MD: US Department of Health and Human Services, NIH; 1991. [Google Scholar]
- 38.Lefranc MP. imgt, the international ImMunoGeneTics database. Nucleic Acids Res. 2001;29:207–9. doi: 10.1093/nar/29.1.207. [DOI] [PMC free article] [PubMed] [Google Scholar]
- 39.Shapiro GS, Aviszus K, Murphy J, Wysocki LJ. Evolution of Ig DNA sequence to target specific base positions within codons for somatic hypermutation. J Immunol. 2002;168:2302–6. doi: 10.4049/jimmunol.168.5.2302. [DOI] [PubMed] [Google Scholar]
- 40.Whitelegg NR, Rees AR. wam: an improved algorithm for modelling antibodies on the WEB. Protein Eng. 2000;13:819–24. doi: 10.1093/protein/13.12.819. [DOI] [PubMed] [Google Scholar]
- 41.De Maeyer M, Desmet J, Lasters I. The dead-end elimination theorem. mathematical aspects, implementation, optimizations, evaluation, and performance. Meth Mol Biol. 2000;143:265–304. doi: 10.1385/1-59259-368-2:265. [DOI] [PubMed] [Google Scholar]
- 42.Dauber-Osguthorpe P, Roberts VA, Osguthorpe DJ, Wolff J, Genest M, Hagler AT. Structure and energetics of ligand binding to proteins: Escherichia coli dihydrofolate reductase-trimethoprim, a drug-receptor system. Proteins. 1988;4:31–47. doi: 10.1002/prot.340040106. [DOI] [PubMed] [Google Scholar]
- 43.Padlan EA, Abergel C, Tipper JP. Identification of specificity-determining residues in antibodies. FASEB J. 1995;9:133–9. doi: 10.1096/fasebj.9.1.7821752. [DOI] [PubMed] [Google Scholar]
- 44.Ramirez-Benitez MC, Almagro JC. Analysis of antibodies of known structure suggests a lack of correspondence between the residues in contact with the antigen and those modified by somatic hypermutation. Proteins. 2001;45:199–206. doi: 10.1002/prot.1140. [DOI] [PubMed] [Google Scholar]
- 45.Wiens GD, Roberts VA, Whitcomb EA, O'Hare T, Stenzel-Poore MP, Rittenberg MB. Harmful somatic mutations: lessons from the dark side. Immunol Rev. 1998;162:197–209. doi: 10.1111/j.1600-065x.1998.tb01442.x. [DOI] [PubMed] [Google Scholar]
- 46.Casson LP, Manser T. Evaluation of loss and change of specificity resulting from random mutagenesis of an antibody VH region. J Immunol. 1995;155:5647–54. [PubMed] [Google Scholar]
- 47.Gonzalez-Fernandez A, Milstein C. Low antigen dose favours selection of somatic mutants with hallmarks of antibody affinity maturation. Immunology. 1998;93:149–53. doi: 10.1046/j.1365-2567.1998.00423.x. [DOI] [PMC free article] [PubMed] [Google Scholar]
- 48.Fitch WM, Leiter JM, Li XQ, Palese P. Positive Darwinian evolution in human influenza A viruses. Proc Natl Acad Sci USA. 1991;88:4270–4. doi: 10.1073/pnas.88.10.4270. [DOI] [PMC free article] [PubMed] [Google Scholar]
- 49.Bush RM, Fitch WM, Bender CA, Cox NJ. Positive selection on the H3 hemagglutinin gene of human influenza virus A. Mol Biol Evol. 1999;16:1457–65. doi: 10.1093/oxfordjournals.molbev.a026057. [DOI] [PubMed] [Google Scholar]
- 50.Zanotto PM, Kallas EG, de Souza RF, Holmes EC. Genealogical evidence for positive selection in the nef gene of HIV-1. Genetics. 1999;153:1077–89. doi: 10.1093/genetics/153.3.1077. [DOI] [PMC free article] [PubMed] [Google Scholar]
- 51.Stewart JJ, Watts P, Litwin S. An algorithm for mapping positively selected members of quasi species-type viruses. BMC Bioinf. 2001;2:1. doi: 10.1186/1471-2105-2-1. [DOI] [PMC free article] [PubMed] [Google Scholar]
- 52.Kepler TB, Perelson AS. Modeling and optimization of populations subject to time-dependent mutation. Proc Natl Acad Sci USA. 1995;92:8219–23. doi: 10.1073/pnas.92.18.8219. [DOI] [PMC free article] [PubMed] [Google Scholar]
- 53.Shannon M, Mehr R. Reconciling repertoire shift with affinity maturation: the role of deleterious mutations. J Immunol. 1999;162:3950–6. [PubMed] [Google Scholar]
- 54.Celada F, Seiden PE. Affinity maturation and hypermutation in a simulation of the humoral immune response. Eur J Immunol. 1996;26:1350–8. doi: 10.1002/eji.1830260626. [DOI] [PubMed] [Google Scholar]
- 55.Pierre DM, Goldman D, Bar-Yam Y, Perelson AS. Somatic evolution in the immune system: the need for germinal centers for efficient affinity maturation. J Theoret Biol. 1997;186:159–71. doi: 10.1006/jtbi.1996.0350. [DOI] [PubMed] [Google Scholar]
- 56.Kleinstein SH, Singh JP. Why are there so few key mutant clones? The influence of stochastic selection and blocking on affinity maturation in the germinal center. Int Immunol. 2003;15:871–84. doi: 10.1093/intimm/dxg085.sgm. [DOI] [PubMed] [Google Scholar]