

Abstract
Inhibition of glutamine synthesis reduces astrocyte swelling and associated physiological abnormalities during acute ammonium acetate infusion in anesthetized rats. We tested the hypothesis that inhibition of glutamine accumulation during more prolonged ammonium acetate infusion in unanesthetized rats reduces cortical astrocyte swelling and immunohistochemical changes in astrocytic proteins. Rats received a continuous i.v. infusion of either sodium acetate or ammonium acetate for 24 h to increase plasma ammonia from about 30–400 μmol/l. Cohorts were pretreated with vehicle or L-methionine-S-sulfoximine (MSO; 0.83 mmol/kg). MSO reduced glutamine synthetase activity by 57% and glutamine synthetase immunopositive cell number by 69%, and attenuated cortical glutamine accumulation by 71%. Hyperammonemia increased the number of swollen astrocytes in cortex and MSO reduced this increase to control values. The number of glial fibrillary acidic protein immunopositive cells in cortex was greater in hyperammonemic rats and the increase in superficial cortical layers was attenuated by MSO. Immunoreactivity for the gap junction protein connexin-43 in the neuropil, assessed by optical density, was greater in the hyperammonemic group compared with controls, but this increase was not attenuated by MSO. No changes in the optical density of GLT1 glutamate transporter immunoreactivity in cortex were detected in any group. We conclude that glutamine synthetase inhibition reduces astrocyte swelling and ameliorates some of the reactive astroglial cytoskeletal alterations seen at 24 h of hyperammonemia, but that gap junction changes in astrocytes occur independently of glutamine accumulation and swelling.
Keywords: ammonia, astrocyte, connexin, cerebral edema, glial fibrillary acidic protein, glutamine
Astrocyte swelling is a distinctive feature of the histological finding in humans who die from severe liver disease or urea cycle disorders. Experimental models of liver dysfunction and hyperammonemia are also marked by watery swelling of astrocytes and cellular hypertrophy of astrocyte cell bodies without necessarily presenting with overt neuronal pathology. Thus, hyperammonemia is considered to be a major factor contributing to the cellular changes seen in severe hepatic encephalopathy (Norenberg, 1998).
Tracer studies reveal that blood-borne ammonia is rapidly incorporated into brain glutamine, and that this process is markedly slowed in vivo by inhibiting glutamine synthetase (GS) with methionine sulfoximine (MSO), thereby disrupting compartmentation of nitrogen metabolism (Cooper et al., 1979). Based on the observations 1) that increased brain glutamine concentration is one of the most consistent biochemical change seen both clinically and experimentally with liver disease, urea cycle disorders or pure hyperammonemia (Cooper, 2001), and 2) that GS is enriched in astrocytes (Norenberg and Martinez-Hernandez, 1979), we postulated that glutamine accumulated in astrocytes may act as an osmolyte that contributes to astrocyte swelling (Brusilow and Traystman, 1986). In support of this hypothesis, we found that inhibiting glutamine synthesis by pretreating rats with MSO prevented increases in cortical water content (Takahashi et al., 1991) and intracranial pressure (Takahashi et al., 1992) during 6 h of hyperammonemia. Electron microscopy revealed diminished watery swelling of astrocyte processes and less enlargement of the nucleus with MSO treatment, although other aspects of cell hypertrophy were still present (Willard-Mack et al., 1996). Functionally, astrocytic control of extracellular K+ activity (Sugimoto et al., 1997) and cerebrovascular reactivity to CO2 (Hirata et al., 1996, 1999) were improved by MSO pretreatment. Others have shown that MSO attenuates cerebral edema and intracranial hypertension induced by a 3-h infusion of ammonium acetate (NH4Ac) in portacaval shunted rats (Blei et al., 1994), and that MSO increases cerebral glucose consumption in portacaval-shunted rats (Hawkins et al., 1993). Thus, some aspects of astrocyte morphological and functional changes during acute hyperammonemia are related to glutamine accumulation rather than direct effects of ammonia.
Existing studies of MSO treatments in hyperammonemic rats have caveats. One limitation of these studies with MSO treatment in hyperammonemic rats is that a relatively short period of NH4Ac infusion was used. Effects of MSO may not be sustained with longer periods. Another limitation in some of these studies was the use of pentobarbital anesthesia, which could have influenced the results through its depressant effects on energy metabolism or its alteration of GABAergic neurotransmission. To overcome these limitations in the present study, we used a more prolonged, 24 h infusion of NH4Ac in the absence of anesthesia. We tested the hypothesis that pretreatment with MSO will attenuate ammonia-induced increases in glutamine concentration, astrocyte swelling and tissue water content over a 24 h period of hyperammonemia. In addition, we determined whether changes in astrocyte markers were evident by 24 h of hyperammonemia and if these changes could be ameliorated by MSO pretreatment. Specifically, we evaluated immunoreactivity for GS, the intermediate filament glial fibrillary acidic protein (GFAP), connexin-43 present in astrocyte gap junctions (Rash et al., 2001), and the astroglial glutamate transporter GLT1. Immunohistochemistry was used to localize changes in these proteins on a cortical laminar basis.
EXPERIMENTAL PROCEDURES
Experimental protocol
All procedures on rats were approved by the institutional animal care and use committee and conform to the principles of laboratory animal research outlined by the American Physiological Society. Pain was reduced by the use of anesthetics, and the number of animals was minimized to that necessary for sufficient statistical power. Male Wistar rats weighing approximately 400 g were chronically catheterized. Anesthesia was induced with 4% halothane and maintained with approximately 1.5% halothane by face mask. The right femoral vein was exposed and cannulated with a sterile polyethylene catheter. The catheter was routed s.c. to the back of the rat and exited through a metal swivel device sutured to the skin near the scapula. Incisions were sutured closed and anesthesia was discontinued. Rats were placed in individual cages with food and water and were usually able to start moving about the cage within 10 min of discontinuing anesthesia.
At approximately 2 h after surgery, rats received a continuous i.v. infusion of 3 mmol/kg/h of either sodium acetate (NaAc) or NH4Ac for 24 h. The salt concentration of the sterile solutions was 1.2 mol/l and the infusion rate was 2.5 ml/kg/h. To prevent metabolic alkalosis, the NaAc was dissolved in equimolar hydrochloric acid. Three hours before the start of the salt infusion, rats received an i.p. injection of either 0.83 mmol/kg of MSO (Sigma-Aldrich, St. Louis, MO, USA) or sterile saline vehicle (2.5 ml/kg). L-Methionine (6.7 mmol/kg) was co-injected with MSO at a molar ratio of 8:1 to prevent seizures associated with high doses of MSO (Sellinger et al., 1968, 1984; Schatz and Sellinger, 1975). L-Methionine was dissolved in 100 mmol/l NaOH and titrated to a pH of 7.6 with HCl. The final concentration of methionine was 40 mg/ml. Rats receiving the vehicle for MSO also received the vehicle for methionine. Thus four treatment groups were studied: 1) vehicle pretreatment plus NaAc infusion (n=12), 2) MSO and methionine pretreatment plus NaAc infusion (n=11), 3) vehicle pretreatment plus NH4Ac infusion (n=13), and 4) MSO and methionine pretreatment plus NH4Ac infusion (n=12). Within each treatment group approximately half of the rats were used for brain amino acid analysis and half were used for histological and immunocytochemical analysis.
Chemical analysis
Plasma ammonia concentration was measured on 50 μl samples by a cation exchange–visible spectrophotometric technique (Brusilow, 1991). Plasma osmolarity was measured by freezing point depression (Advanced Instruments; model 3300, Norwood, MA, USA). Blood glucose concentration was measured with a Yellow Springs Glucose Analyzer (model 2300, Yellow Springs, OH, USA). To obtain cortical samples for chemical analysis, rats were anesthetized with sodium pentobarbital (60 mg/kg, i.p.) at 24 h of salt infusion and were decapitated. One cerebral hemisphere was quickly frozen in methylbutane on dry ice, and stored at −80° for later amino acid analysis. The other cerebral hemisphere was used for calculating water content by measuring the wet and dry weight. Dry weight was measured after 72 h of drying at approximately 100 °C. For amino acid analysis, samples were derivatized with orthophthalaldehyde and analyzed by high performance liquid chromatography using fluorescent detection. Activity of GS was measured by the method of Rao and Meister (1972) based on the catalysis of γ-glutamylhydroxamate from glutamine and hydroxylamine. One unit of GS activity is that amount that produces 1 nmol of γ-glutamylhydroxamate per minute per milligram of protein. To determine the duration of GS inhibition after a single injection of MSO, cortical GS activity was measured in a separate series of rats at 1, 3, 7, 10, and 14 days (n=3 per time point) after i.p. injection of MSO without 24 h salt infusion or L-methionine administration.
Histology and immunocytochemistry
In rats used for histological analysis, anesthesia was induced with sodium pentobarbital (60 mg/kg, i.p.) at 24 h of salt infusion. Heparinized rats were perfused intra-aortically with cold phosphate-buffered saline followed by a 4% solution of paraformaldehyde in 100 mmol/l phosphate buffer. The perfusion–fixation procedure was done rapidly, yet effectively, to avoid major artifactual changes in astrocytes (Willard-Mack et al., 1996). The cerebral hemispheres were cryoprotected in 20% glycerol in phosphate buffered saline for 24 h and then were frozen. Coronal sections (30 μm) were cut on a sliding microtome for hematoxylin–eosin (H&E) staining and for immunocytochemistry using the peroxidase–antiperoxidase method. For immunocytochemical localization, free-floating sections were washed in Tris-buffered saline and permeabilized with Triton X-100 in normal goat serum. Sections were incubated for 48 h at 4 °C with one of the following primary antibodies: GFAP monoclonal antibody at 1:2000 dilution (DAKO Corporation, Carpinteria, CA, USA); connexin-43 monoclonal antibody at a 1:2500 dilution (Chemicon Corporation, Tenecula, CA, USA); affinity-purified, polyclonal, rabbit, GLT1 glutamate transporter antibody at 340 ng/ml (Rothstein et al., 1994); and monoclonal GS antibody at a 1:5000 dilution (Transduction Laboratories, Lexington, KY, USA). Affinity-purified goat anti-rabbit IgG F(ab)2 fragments were used as a secondary antibody for GFAP and GLT1 experiments and goat anti-mouse IgG F(ab)2 fragments were used as a secondary antibody for connexin-43 and GS experiments. Immunoreactivity was visualized with diaminobenzidine (DAB) chromogen.
The number of swollen astrocytes was assessed by light microscopy on H&E-stained sections of cerebral cortex. Translucent, crescent-shaped profiles adjacent to neuronal cell bodies were assumed to represent swollen astrocytes based on prior electron microscopy studies (Willard-Mack et al., 1996). The number of these translucent profiles in a 1000× microscopic field was counted and expressed as a percentage of the total number of neuronal cell bodies in the field. For each rat, an average percentage was obtained for six, non-overlapping fields examined in layer III and for six, non-overlapping fields examined in layer V of cerebral cortex. The layers were identified by cytological criteria.
Immunoreactivity for GS and GFAP was analyzed in two ways: 1) counting immunoreactive cell bodies and 2) optical density of total immunoreactivity within the parenchyma containing cell processes and cell bodies. For connexin-43 and GLT1, only optical density measurements were used because these proteins are primarily localized in cell processes and not in cell bodies. To obtain cell counts, the number of immunopositive cell bodies was counted in non-overlapping microscopic fields at 400× magnification. Because immunoreactivity varied with cortical depth and the precise boundaries between each cortical layer could not be discerned on immunocytochemically stained sections, cortical depth was divided into thirds for regional analysis. For each rat, the average number of counts was obtained for six fields each of superficial, middle and deep thirds of cerebral cortex. For densitometric analysis, optical density of immunoreactivity in defined cortical areas was measured using Loats Inquiry Software (Loats Corporation, Westminster, MD, USA) as described (Ballough et al., 1995). The primary antibodies were used at concentrations that result in a slow, progressive DAB reaction to provide even staining of sections. Optical density was integrated over all six layers of sensorimotor cortex. Measurements were averaged from three regions of left cortex and three regions of right cortex. The immunocytochemical procedures were run on two batches containing different sections. The number of rats represented in each batch was balanced among the four treatment groups. There were no differences in optical density measurements between batches. For all histological and immunocytochemical measurements, the observer was blinded to treatments.
Data were compared among the four groups by analysis of variance. When the F value was significant, mean values were compared between groups with the Newman-Keuls multiple range test. In cases where the variance was unequal between groups, the non-parametric Mann-Whitney test was used. The level of significance in all tests was set at P<0.05. Data are presented as mean±S.D.
RESULTS
Blood and cortical chemical analysis
After a single injection of MSO, inhibition of cortical GS activity was unchanged over a 3-day period and gradually recovered toward baseline values over a 2-week period (Fig. 1). The percent inhibition at 1 and 3 days was similar to the 64% inhibition obtained previously 3 h after MSO (Takahashi et al., 1991). Thus enzyme inhibition was stable over the chosen 24 h duration of salt infusion.
Fig. 1.
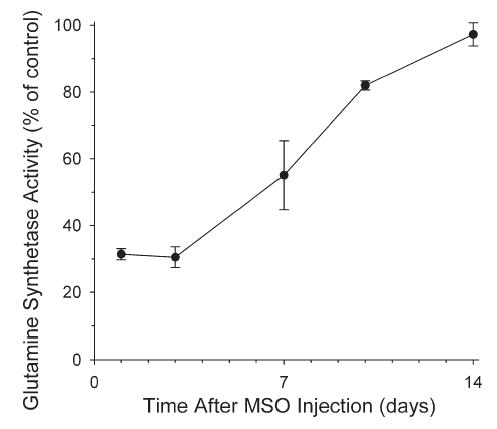
Time course of cortical GS activity (% of vehicle group) after injection of MSO (0.55 mmol/kg; n=3 rats per time point) without L-methionine co-injection.
With 24 h of NH4Ac infusion after vehicle pretreatment, plasma ammonia concentration was increased to 370±95 μmol/l compared with 32±8 μmol/l with NaAc infusion. Similar values were obtained in cohorts used for histology (Table 1). In groups pretreated with MSO+methionine, plasma ammonia concentrations were not different from the corresponding vehicle pretreatment groups. However, plasma osmolarity in the vehicle+NH4Ac group was significantly greater than that in the MSO+NH4Ac group. Blood glucose concentration was not different among groups.
Table 1.
Chemical analysis of blood and cortical tissue samples*
| Vehicle+NaAc | MSO+NaAc | Vehicle+ NH4Ac | MSO+ NH4Ac | |
|---|---|---|---|---|
| Plasma NH4 (μmol/l) | ||||
| Chemistry cohort | 32±8 | 36±3 | 370±95a | 320±98a |
| Histology cohort | 42±3 | 40±5 | 366±217a | 328±85a |
| Plasma osmolarity (mosmol/l) | 314±18 | 314±12 | 331±11 | 313±10b |
| Blood glucose (mmol/l) | 7.3±4.1 | 7.1±3.4 | 10.9±4.2 | 7.6±3.0 |
| GS activity (nmol/min/mg protein) | 18.7±1.0 | 8.2±0.7a | 19.6±2.0 | 9.8±4.7a, b |
| Cortical glutamine (μmol/g) | 5.2±0.8 | 3.9±0.9a | 34.2±5.9a | 13.7±9.7a, b |
| Cortical glutamate (μmol/g) | 14.2±4.1 | 12.7±2.2 | 20.2±10.3 | 11.5±2.4 |
| Cortical taurine (μmol/g) | 6.0±1.6 | 7.6±2.1 | 6.7±2.4 | 6.6±2.1 |
| Cerebral water content (%) | 78.13±0.39 | 78.01±0.66 | 78.73±0.44a | 78.46±0.90 |
Values are means±SD (n=6 per group).
P<.05 from vehicle+NaAc group.
P<.05 between vehicle+NH4Ac and MSO+NH4Ac groups.
With MSO+methionine pretreatment, cortical GS activity was reduced 50–60% in groups receiving NaAc or NH4Ac for 24 h (Table 1). A large increase in tissue glutamine concentration occurred with NH4Ac infusion (34.2±5.9 vs. 5.2±0.8 μmol/g) and MSO substantially inhibited this increase (13.7±9.7 μmol/g). There were no differences among groups in the cortical concentrations of glutamate and taurine, which represent the other major amino acid osmolytes in brain. Cerebral water content was significantly increased in the NH4Ac group pretreated with vehicle, but not in the NH4Ac group pretreated with MSO.
Swollen astrocytes
The amount of astroglial swelling in controls was low. A small portion of neuronal cell bodies were adjacent to translucent profiles in the NaAc groups pretreated with vehicle or MSO (Fig. 2). This background level of translucent profiles is presumed to reflect astrocyte swelling during tissue hypoxia associated with perfusion of cold phosphate-buffered saline and fixative. In the vehicle+NH4Ac group, these crescent-shaped profiles were more abundant and were often larger. The percentage of neurons with adjacent translucent profiles more than doubled in layers III and V of cerebral cortex compared with the background level in the NaAc groups (Fig. 3). Pretreatment with MSO before NH4Ac infusion significantly reduced the number of these translucent profiles in both layers III and V (Figs. 2 and 3). Moreover, the incidence of translucent profiles in the MSO+NH4Ac group was not different from that in either of the NaAc groups.
Fig. 2.
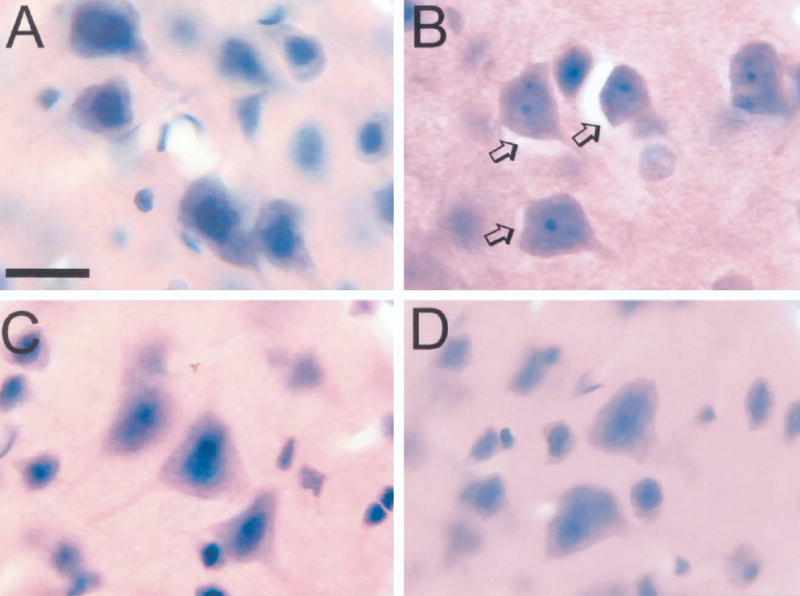
H&E-stained sections showing cortical pyramidal neurons in rats treated with vehicle+NaAc (A), vehicle+NH4Ac (B), MSO+NH4Ac (C), MSO+NaAc (D). Translucent profiles surrounding neuronal cell bodies were prevalent in the vehicle+NH4Ac group (arrows, B). Scale bar=15 μm.
Fig. 3.
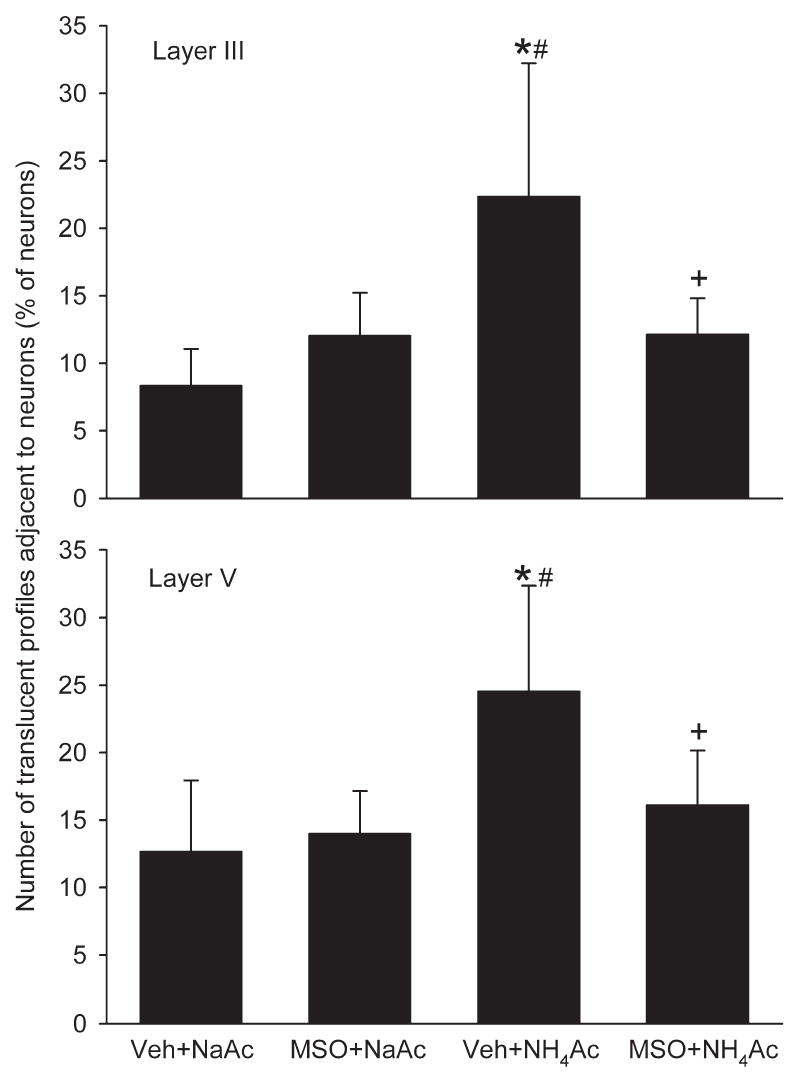
Number of swollen astrocytes, as assessed by the number of translucent profiles adjacent to neuronal cell bodies expressed as a percentage of the total number of neurons in the microscopic field, in layers III (top) and V (bottom) in rats treated with vehicle+NaAc (n=6), MSO+NaAc (n=5), vehicle NH4Ac (n=7), and MSO+ NH4Ac (n=6). * P<0.05 from vehicle+NaAc group; # P<0.05 from MSO+NaAc group; + P<0.05 between vehicle+NH4Ac and MSO+NH4Ac groups.
GS immunocytochemistry
Immunoreactivity of GS was present in cell bodies and cell processes. The number of immunopositive cells was greater in superficial cortex than in deeper layers (Fig. 4). Accordingly, positive cell counts were analyzed separately for superficial, middle and deep layers. Within superficial cortex, the number of positive staining cells in the NaAc control groups was reduced by MSO (Figs. 4 and 5). In middle and deep layers, these differences did not reach statistical difference. A significant increase in the number of positive cells in the superficial cortex was observed in the vehicle+NH4Ac group. With MSO+NH4Ac infusion, the number of GS positive cells was reduced in all cortical layers compared with the vehicle+NH4Ac group. Likewise, optical density measurements of GS immunoreactivity in all cortical layers in the MSO+NH4Ac group was significantly less than in the vehicle+NH4Ac group (Fig. 5).
Fig. 4.
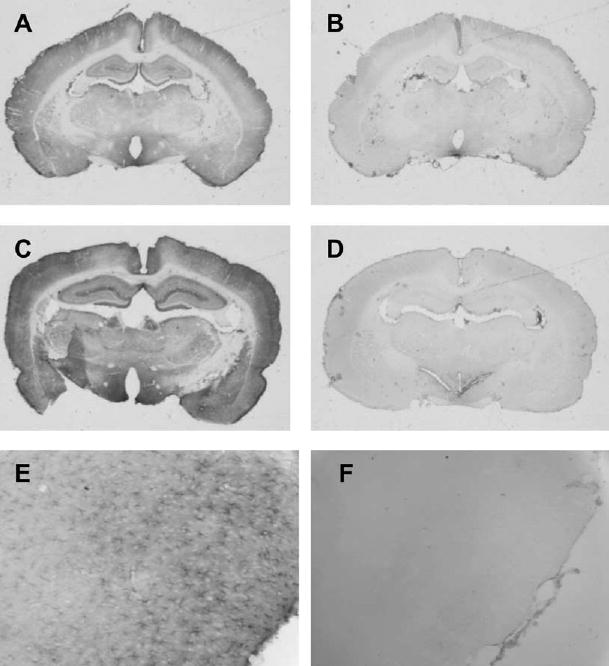
Low power view of immunocytochemical staining of GS in coronal sections from rats treated with vehicle+NaAcetate (A), MSO+NaAcetate (B), vehicle+NH4Ac (C), and MSO+NH4Ac (D). Within cortex, staining was greatest in superficial layers (A) and was increased with NH4Ac infusion (C). Immunoreactivity was reduced with MSO pretreatment (B, D), and the astrocyte pattern of staining seen at higher power in gcontrols (E; vehicle+NaAcetate group) was lost in some rats with pretreatment of the inhibitor (F; MSO+NaAc group).
Fig. 5.
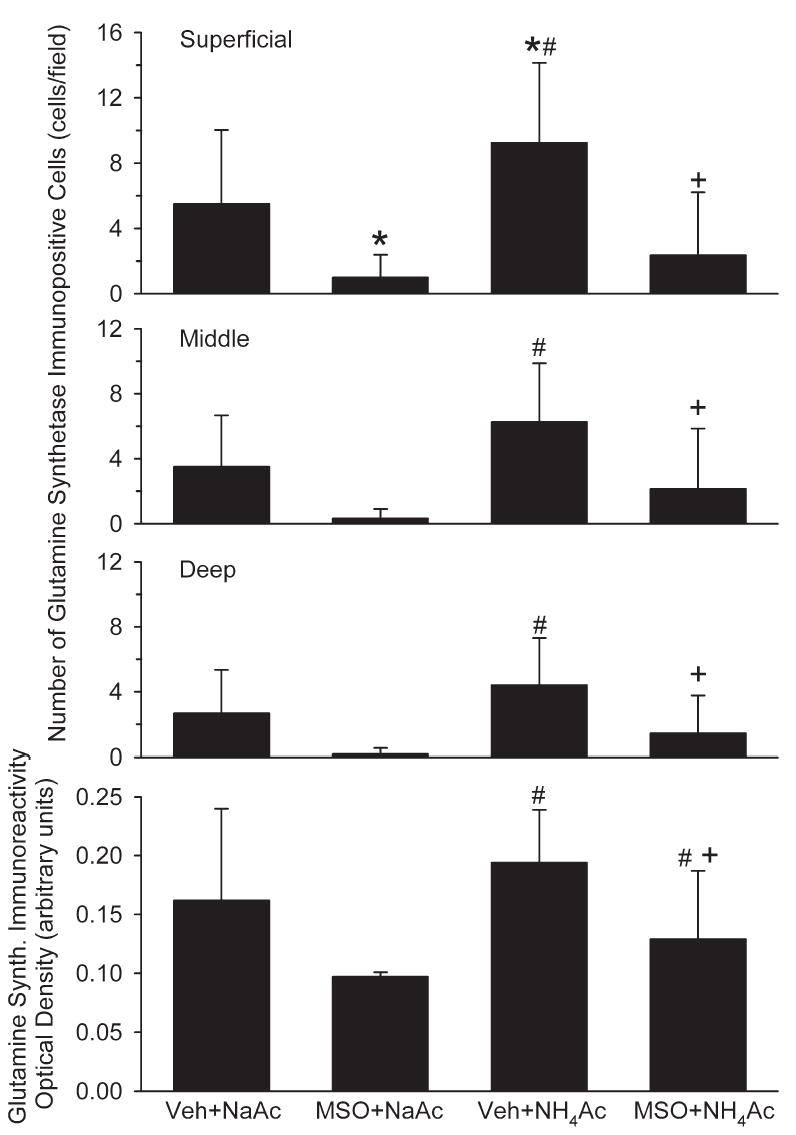
Number of GS immunopositive cells in superficial, middle and deep layers of cerebral cortex, and optical density of GS immunoreactivity integrated over all cortical layers in rats treated with vehicle+NaAc (n=6), MSO+NaAc (n=5), vehicle+NH4Ac (n=7), and MSO+NH4Ac (n=6). *P<0.05 from vehicle+NaAc group; # P<0.05 from MSO+NaAc group; + P<0.05 between Veh+NH4Ac and MSO+NH4Ac groups.
GFAP immunocytochemistry
The number of GFAP immunopositive cell bodies in the vehicle+NH4Ac group was greater in the superficial layer of cortex than in the deep layers (Fig. 6). Pretreatment with MSO before NaAc infusion had no effect on the number of GFAP positive cells in any layer of cortex. With NH4Ac infusion, the number of GFAP positive cells increased in all layers compared with both NaAc groups. Pretreatment with MSO before NH4Ac infusion reduced the number of GFAP positive cells in superficial cortex compared with the vehicle+NH4Ac group. However, the number of positive cells in the MSO+NH4Ac group remained greater than that in either of the NaAc groups in all layers of cortex. Optical density measurements integrated across all layers of sensorimotor cortex confirmed an increased GFAP immunoreactivity in the vehicle+NH4Ac group compared with both NaAc groups (Fig. 6). In the MSO+NH4Ac group, optical density values were intermediate between the vehicle+NH4Ac group and the NaAc groups and not significantly different from any of these groups.
Fig. 6.
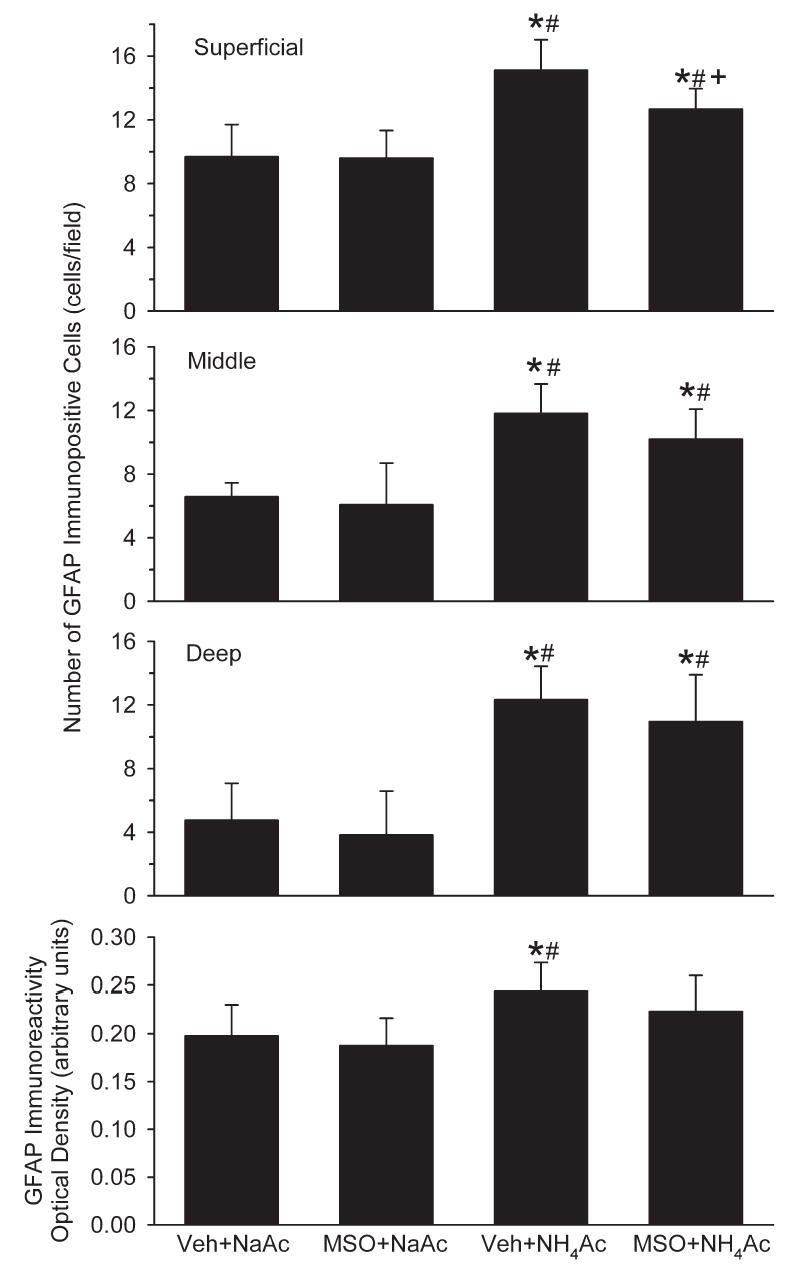
Number of GFAP immunopositive cells in superficial, middle and deep layers of cerebral cortex, and optical density of GFAP immunoreactivity integrated over all cortical layers in rats treated with vehicle+NaAc (n=6), MSO+NaAc (n=5), vehicle+NH4Ac (n=7), and MSO+ NH4Ac (n=6). *P<0.05 from vehicle+NaAc group; # P<0.05 from MSO+NaAc group; + P<0.05 between vehicle+NH4Ac and MSO+NH4Ac groups.
Connexin-43 immunocytochemistry
Immunoreactivity for connexin-43 was localized on cell processes within the brain parenchyma in all groups. With NH4Ac infusion, staining was more robust and widespread throughout the neuropil. Optical density measurements indicated greater connexin-43 immunoreactivity in both the vehicle+NH4Ac and MSO+NH4Ac groups compared with the vehicle+NaAc group (Fig. 7). The vehicle+NH4Ac and MSO+NH4Ac groups were not significantly different.
Fig. 7.
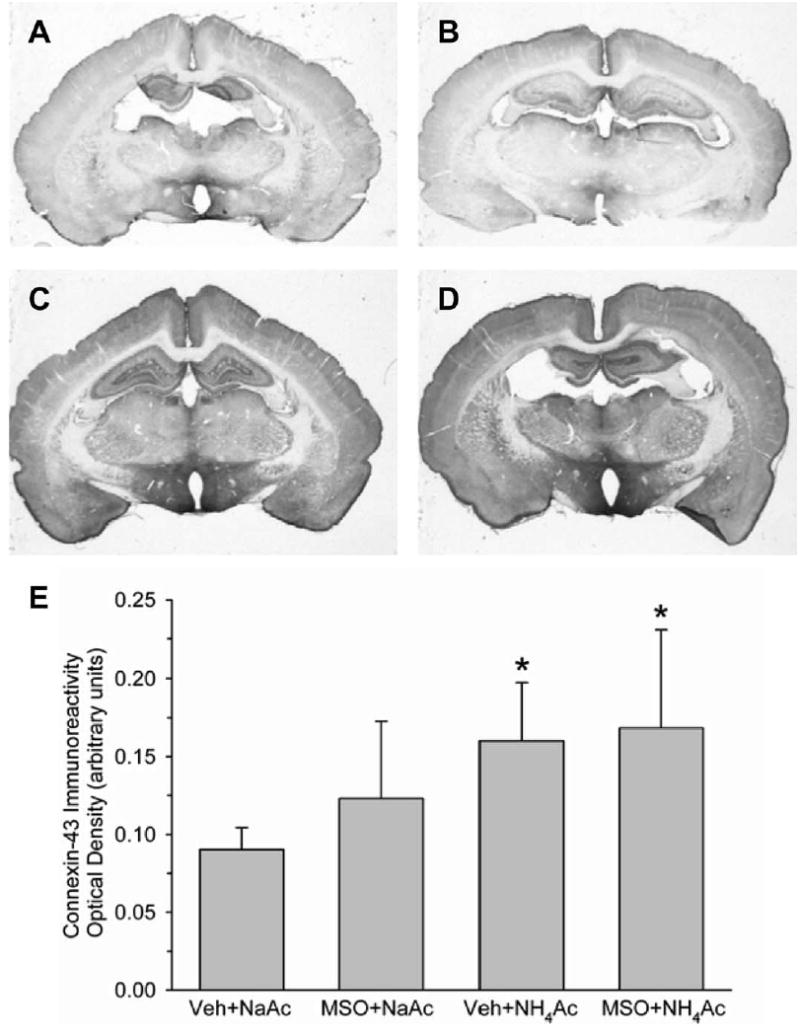
Low power view of immunocytochemical staining of connexin-43 in coronal sections from rats treated with vehicle+NaAcetate (A), MSO+NaAcetate (B), vehicle+NH4Ac (C), and MSO+NH4Ac (D). Within cortex, staining was increased with NH4Ac infusion (C), and the increase was not reduced with MSO pretreatment (D). Mean±S.D. of optical density of connexin-43 immunoreactivity integrated over all cortical layers is shown in E for rats treated with vehicle+NaAc (n=6), MSO+NaAc (n=5), vehicle+ NH4Ac (n=7), and MSO+ NH4Ac (n=6). * P<0.05 from vehicle+NaAc group.
GLT1 immunocytochemistry
GLT1 immunoreactivity was enriched in cell processes in the neuropil. Optical density measurements of cerebral cortex did not reveal any significant differences among the four treatment groups (Fig. 8).
Fig. 8.
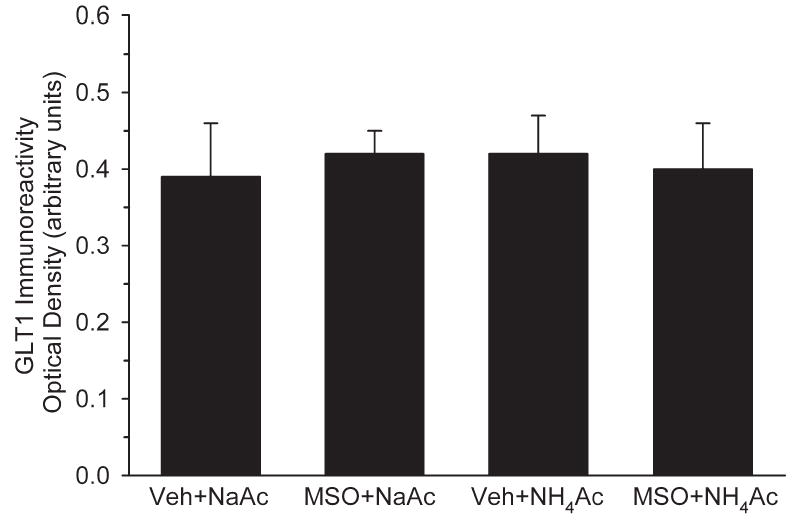
Optical density of GLT1 glutamate transporter immunoreactivity integrated over all cortical layers in rats treated with vehicle+NaAc (n=6), MSO+NaAc (n=5), vehicle+ NH4Ac (n=7), and MSO+ NH4Ac (n=6). There were no differences among groups.
DISCUSSION
The results of this study demonstrate that 24 h of hyperammonemia with plasma ammonia concentration in the 300–400 micromolar range, which was sufficient to produce a five-fold increase in cerebral glutamine concentration, caused significant astrocyte swelling, accompanied by increases in tissue water content and in cortical laminar immunoreactivity of GFAP, GS and connexin-43. The major new finding was that attenuating glutamine accumulation with MSO reduced the number of swollen astrocytes and attenuated increases in regional GFAP immunoreactivity and in tissue water content at 24 h of hyperammonemia. These results are consistent with our hypothesis that watery swelling of astrocytes and some of the associated cellular changes during hyperammonemia are based on glutamine accumulation and not directly on ammonium ions.
Astrocyte swelling
One way that glutamine accumulation can produce swelling is through its action on intracellular osmolyte concentration. For example, the 29 μmol/g increase in tissue glutamine concentration could represent an 116 mosmol/l increase if confined to an astrocyte compartment roughly equivalent to one-quarter of cortex in rodents (Pope, 1978; Polak et al., 1982). Although some glutamine is exported out of astrocytes, the remaining osmotic load within astrocytes could be considerable. In addition to the osmotic effect of glutamine, elevated glutamine results in loss of mitochondrial membrane potential and free radical production in cultured astrocytes (but not neurons), which could contribute to disturbed cell volume regulation selectively in astrocytes (Rama Rao et al., 2003; Jayakumar et al., 2004).
High doses of MSO can produce behavioral changes and seizures. Seizures were not evident in our previous studies in which a dose of 0.83 mmol/kg was used, possibly because of the use of pentobarbital as an anesthetic. To avoid the potential confounding influence of seizures, we co-administered L-methionine with MSO in an 8:1 molar ratio. Work by Sellinger et al. (1968; Schatz and Sellinger, 1975; Sellinger et al., 1984) demonstrated that methionine co-administration at this ratio prevented MSO-induced seizures and associated reductions in S-adenosyl methionine without reducing the potency of GS inhibition by MSO.
MSO could conceivably cause neuronal injury by interfering with glutamate metabolism and causing excitotoxic injury. MSO did not increase cortical glutamate concentration in either the NaAc or NH4Ac groups. Furthermore, we could not detect a change in the immunoreactivity for the glial glutamate transporter GLT1 or see histological evidence of neuronal degeneration by light microscopy. Moreover, chronic MSO administration does not substantially reduce learning and memory behavior in mice on the radial maze test (Blin et al., 2002), and MSO can be protective in cerebral ischemia (Swanson et al., 1990). Thus, interfering with the glutamate–glutamine cycle by administering MSO is not necessarily toxic and in some situations, such as ischemia and hyperammonemia, MSO can be protective.
The increase in tissue water content in the present study with 24 h NH4Ac infusion was smaller than in our previous studies with 6 h infusion (Takahashi et al., 1991; Willard-Mack et al., 1996; Hirata et al., 1996, 1999). This difference may be attributed to a confounding influence of pentobarbital anesthesia in the 6 h study or to regulatory extrusion of astrocytic osmolytes, such as myo-inositol, with more prolonged hyperammonemia (Kreis et al., 1992; Cordoba et al., 1996). Astrocytes without impaired energy metabolism may be able to compensate for the effects of glutamine on cell volume by extruding other osmolytes, although the compensation may be only partial because the basal level of osmolytes such as myo-inositol is less than the large increase in glutamine in the present study. In contrast, disturbed energy metabolism associated with the onset of coma after experimental hepatic failure may cause further edema without further increases in glutamine synthesis (Zwingmann et al., 2003), whereas conserving energy metabolism with hypothermia may reduce water content without further reductions in glutamine (Chatauret et al., 2003; Zwingmann et al., 2004) by maintaining ionic homeostasis and not relying on extrusion of organic osmolytes.
We observed a relatively high plasma osmolarity in the vehicle+NH4Ac group (331±11 mosmol/l). Because NH4+ and acetate are normally metabolized without increasing osmolarity, the reason for the high plasma osmolarity is unclear but could involve decreased water intake or a water diuresis. A high plasma osmolarity in the present study compared with the 6 h infusion studies (approximately 290 mosmol/l) could also have contributed to the lower water content increase in the vehicle+NH4Ac group in the present study and to the lack of statistical difference from the MSO+NH4Ac water content. Furthermore, we cannot exclude that dehydration may have altered the expression of glial proteins in a manner different from that of pure hyperammonemia.
GS
Others have found decreased GS activity and either no change or increased expression after prolonged portacaval anastomosis (Suarez et al., 1997, 2002; Desjardins et al., 1999). We observed no changes in cortical GS activity or in the overall optical density of immunostained sections of cortex during 24 h of hyperammonemia. However, on a regional basis, an increase in the number of immunopositive cells was detected in the superficial layer of cortex at 24 h of hyperammonemia. The increased number of GS positive cells during hyperammonemia may reflect 1) increased expression in a new subpopulation of astrocytes which is not detectable in overall enzyme activity from cortical homogenates, or 2) a truncation of processes or reduced trafficking to processes resulting in accumulated protein in cell bodies.
With MSO, immunoreactivity of GS was markedly suppressed (Fig. 4F). MSO remains tightly bound to the protein as MSO phosphate and is cleared from the brain over a period greater than 90 days (Rao and Meister, 1972). This tight binding not only reduces enzymatic activity, but also apparently alters the recognition site for the antibody. Moreover, the prolonged decrease of enzymatic activity presently observed over a 14-day period is consistent with a previous report in rat showing persistent decreases in activity 7 days after MSO administration (Lamar, 1968), but differs from a study in mice showing that activity does not fully recover 90 days after MSO (Rao and Meister, 1972). In either case, the data suggest that resynthesis of GS is suppressed in brain or that MSO cleaved from degraded GS can bind to newly synthesized protein.
GFAP
Decreases in GFAP immunoreactivity have been reported in patients who died from hepatic encephalopathy (Sobel et al., 1981; Kretzschmar et al., 1985; Kimura and Budka, 1986). Decreased GFAP expression has also been demonstrated experimentally in a model of acute hepatic failure in which brain ammonia concentrations increase into the millimolar range (Belanger et al., 2002), possibly resulting from destabilization of GFAP mRNA (Neary et al., 1994). In contrast, increases in GFAP immunostaining can occur with prolonged portacaval anastomosis in specific regions (Suarez et al., 1992, 1996, 2002). Our results with submillimolar plasma ammonia concentration indicated an increase in the number of GFAP immunopositive cells in cortex at 24 h of hyperammonemia. Differences from previous findings may be related to the chronic conditions or severity of encephalopathy in humans and to the higher levels of ammonia achieved with acute hepatic failure. In addition, the increase in cortical water content observed at 24 h of hyperammonemia in the present study was less than that previously seen at 6 h (Takahashi et al., 1991; Willard-Mack et al., 1996). It is possible that astrocytes undergo adaptive changes by 24 h and reorganize cytoskeletal proteins leading to increased GFAP expression without frank injury. In this case, attenuation of increased GFAP expression immunoreactivity by MSO may reflect an attenuation of astrocyte activation. Alternatively, bundles of intermediate filaments become less compact and less organized by 6 h of hyperammonemia (Willard-Mack et al., 1996). Consequently, increased GFAP immunoreactivity may simply be the result of exposure of the antibody to more epitopes in disorganized filament bundles. In this case, attenuation of GFAP immunoreactivity by MSO may reflect less disruption of intermediate filament bundles secondary to decreased cell swelling. In either circumstance, the results support a protective effect of MSO on astrocyte swelling during hyperammonemia. Immunohistochemistry rather than immunoblotting was used in order to obtain laminar resolution in cortex.
Connexin-43
Extracellular K+ activity increases during hyperammonemia (Sugimoto et al., 1997) may contribute to decreased neuronal excitability (Raabe, 1989; Szerb and Butterworth, 1992). The increase in connexin-43 immunoreactivity observed at 24 h of hyperammonemia may represent a compensatory response to help dissipate increased K+ activity through gap junctions. The increased connexin-43 immunoreactivity does not appear to be related to cell swelling or glutamine accumulation because the increase persisted in the MSO-treated hyperammonemic group. Thus it is possible that ammonium ions, which can exert similar electrophysiological properties as K+ ions (Hille, 1992), are involved in triggering an increased expression of connexin-43 rather than glutamine.
Glutamate transporter
Decreased expression of GLT1 has been found in frontal cortex during the onset of coma in experimental acute hepatic failure, whereas changes were not significant with portacaval anastomosis alone (Knecht et al., 1997). A 20% decrease in GLT1 mRNA occurred after four daily injections of NH4Ac (Norenberg et al., 1997). The loss of GLT1 in astrocytes is postulated to result in increased extracellular glutamate and secondary neuronal excitotoxic injury. In our experiments, the rats were alert and reactive during the 24 h of hyperammonemia, and no change in GLT1 immunoreactivity was detected in different layers of cortex. Thus more severe levels of hyperammonemia accompanied by depressed neuronal activity may be required for decreasing GLT1 expression, although small changes in expression may not be detected with optical density measurements. The lack of effect on GLT1 optical density indicates that the increases observed for other astroglial proteins were specific for these proteins in this model.
In summary, hyperammonemia sustained for a 24 h period at plasma concentrations of approximately 300–400 μmol/l resulted in increased numbers of swollen astrocytes and increased immunoreactivity of GS, GFAP, and connexin-43 without a change in GLT1. The increases in swollen astrocytes and GFAP immunoreactivity were reduced by GS inhibition, whereas the increase in connexin-43 immunoreactivity was unaffected. These results support the role of glutamine accumulation during sustained periods of hyperammonemia in astrocyte swelling and in some of the cytoskeletal protein alterations that may occur with glial activation.
Acknowledgments
The authors thank Ellen Gordes for her fine technical assistance. This work was supported by a grant from the National Institutes of Health (NS 25275).
Abbreviations
- DAB
diaminobenzidine
- GFAP
glial fibrillary acidic protein
- GS
glutamine synthetase
- H&E
hematoxylin-eosin
- MSO
L-methionine-S-sulfoximine
- NaAc
sodium acetate
- NH4Ac
ammonium acetate
References
- Ballough GP, Martin LJ, Cann FJ, Graham JS, Smith CD, Kling CE, Forster JS, Phann S, Filbert MG. Microtubule-associated protein 2 (MAP-2): a sensitive marker of seizure-related brain damage. J Neurosci Methods. 1995;61:23–32. doi: 10.1016/0165-0270(95)00019-q. [DOI] [PubMed] [Google Scholar]
- Belanger M, Desjardins P, Chatauret N, Butterworth RF. Loss of expression of glial fibrillary acidic protein in acute hyperammonemia. Neurochem Int. 2002;41:155–160. doi: 10.1016/s0197-0186(02)00037-2. [DOI] [PubMed] [Google Scholar]
- Blei AT, Olafsson S, Therrien G, Butterworth RF. Ammonia-induced brain edema and intracranial hypertension in rats after portacaval anastomosis. Hepatology. 1994;19:1437–1444. [PubMed] [Google Scholar]
- Blin M, Crusio WE, Hevor T, Cloix JF. Chronic inhibition of glutamine synthetase is not associated with impairment of learning and memory in mice. Brain Res Bull. 2002;57:11–15. doi: 10.1016/s0361-9230(01)00631-1. [DOI] [PubMed] [Google Scholar]
- Brusilow SW. Determination of urine orotate and orotidine and plasma ammonium. In: Hommes FA, editor. Techniques in diagnostic human biochemical genetics: a laboratory manual. New York: Wiley-Liss Inc; 1991. pp. 345–357. [Google Scholar]
- Brusilow SW, Traystman RJ. Letter to the editor. N Engl J Med. 1986;314:786. [PubMed] [Google Scholar]
- Chatauret N, Zwingmann C, Rose C, Leibfritz D, Butterworth RF. Effects of hypothermia on brain glucose metabolism in acute liver failure: a H/C-nuclear magnetic resonance study. Gastroenterology. 2003;125:815–824. doi: 10.1016/s0016-5085(03)01054-0. [DOI] [PubMed] [Google Scholar]
- Cooper AJL. Role of glutamine in cerebral nitrogen metabolism and ammonia neurotoxicity. Ment Retard Dev Disabil Res Rev. 2001;7:280–286. doi: 10.1002/mrdd.1039. [DOI] [PubMed] [Google Scholar]
- Cooper AJ, McDonald JM, Gelbard AS, Gledhill RF, Duffy TE. The metabolic fate of 13N-labeled ammonia in rat brain. J Biol Chem. 1979;254:4982–4992. [PubMed] [Google Scholar]
- Cordoba J, Gottstein J, Blei AT. Glutamine, myo-inositol, and organic brain osmolytes after portocaval anastomosis in the rat: implications for ammonia-induced brain edema. Hepatology. 1996;24:919–923. doi: 10.1002/hep.510240427. [DOI] [PubMed] [Google Scholar]
- Desjardins P, Rao KV, Michalak A, Rose C, Butterworth RF. Effect of portacaval anastomosis on glutamine synthetase protein and gene expression in brain, liver and skeletal muscle. Metab Brain Dis. 1999;14:273–280. doi: 10.1023/a:1020741226752. [DOI] [PubMed] [Google Scholar]
- Hawkins RA, Jessy J, Mans AM, De Joseph MR. Effect of reducing brain glutamine synthesis on metabolic symptoms of hepatic encephalopathy. J Neurochem. 1993;60:1000–1006. doi: 10.1111/j.1471-4159.1993.tb03247.x. [DOI] [PubMed] [Google Scholar]
- Hille B. Ionic channels of excitable membranes. Sunderland, MA: Sinauer Associates; 1992. [Google Scholar]
- Hirata T, Kawaguchi T, Brusilow SW, Traystman RJ, Koehler RC. Preserved hypocapnic pial arteriolar constriction during hyperammonemia by glutamine synthetase inhibition. Am J Physiol. 1999;276:H456–H463. doi: 10.1152/ajpheart.1999.276.2.H456. [DOI] [PubMed] [Google Scholar]
- Hirata T, Koehler RC, Kawaguchi T, Brusilow SW, Traystman RJ. Impaired pial arteriolar reactivity to hypercapnia during hyperammonemia depends on glutamine synthesis. Stroke. 1996;27:729–736. doi: 10.1161/01.str.27.4.729. [DOI] [PubMed] [Google Scholar]
- Jayakumar AR, Rama Rao KV, Schousboe A, Norenberg MD. Glutamine-induced free radical production in cultured astrocytes. Glia. 2004;46:296–301. doi: 10.1002/glia.20003. [DOI] [PubMed] [Google Scholar]
- Kimura T, Budka H. Glial fibrillary acidic protein and S-100 protein in human hepatic encephalopathy: immunocytochemical demonstration of dissociation of two glia-associated proteins. Acta Neuropathol (Berl) 1986;70:17–21. doi: 10.1007/BF00689509. [DOI] [PubMed] [Google Scholar]
- Knecht K, Michalak A, Rose C, Rothstein JD, Butterworth RF. Decreased glutamate transporter (GLT-1) expression in frontal cortex of rats with acute liver failure. Neurosci Lett. 1997;229:201–203. doi: 10.1016/s0304-3940(97)00444-8. [DOI] [PubMed] [Google Scholar]
- Kreis R, Ross BD, Farrow NA, Ackerman Z. Metabolic disorders of the brain in chronic hepatic encephalopathy detected with H-1 MR spectroscopy. Radiology. 1992;182:19–27. doi: 10.1148/radiology.182.1.1345760. [DOI] [PubMed] [Google Scholar]
- Kretzschmar HA, DeArmond SJ, Forno LS. Measurement of GFAP in hepatic encephalopathy by ELISA and transblots. J Neuropathol Exp Neurol. 1985;44:459–471. doi: 10.1097/00005072-198509000-00002. [DOI] [PubMed] [Google Scholar]
- Lamar C., Jr The duration of the inhibition of glutamine synthetase by methionine sulfoximine. Biochem Pharmacol. 1968;17:636–640. doi: 10.1016/0006-2952(68)90280-3. [DOI] [PubMed] [Google Scholar]
- Neary JT, Whittemore SR, Zhu Q, Norenberg MD. Destabilization of glial fibrillary acidic protein mRNA in astrocytes by ammonia and protection by extracellular ATP. J Neurochem. 1994;63:2021–2027. doi: 10.1046/j.1471-4159.1994.63062021.x. [DOI] [PubMed] [Google Scholar]
- Norenberg MD. Astroglial dysfunction in hepatic encephalopathy. Metab Brain Dis. 1998;13:319–335. doi: 10.1023/a:1020688925901. [DOI] [PubMed] [Google Scholar]
- Norenberg MD, Huo Z, Neary JT, Roig-Cantesano A. The glial glutamate transporter in hyperammonemia and hepatic encephalopathy: relation to energy metabolism and glutamatergic neurotransmission. Glia. 1997;21:124–133. [PubMed] [Google Scholar]
- Norenberg MD, Martinez-Hernandez A. Fine structural localization of glutamine synthetase in astrocytes of rat brain. Brain Res. 1979;161:303–310. doi: 10.1016/0006-8993(79)90071-4. [DOI] [PubMed] [Google Scholar]
- Polak M, Haymaker W, Johnson JE, D’Amelio F. Neuroglia and their reactions. In: Haymaker W, Adams RD, editors. Histology and histopathology of the nervous system. Springfield: Charles C. Thomas; 1982. pp. 363–379. [Google Scholar]
- Pope A. Neuroglia: quantitative aspects. In: Schoffeniels E, et al., editors. Dynamic properties of glial cells. Oxford: Pergamon Press; 1978. pp. 13–20. [Google Scholar]
- Raabe W. Ammonium decreases excitatory synaptic transmission in cat spinal cord in vivo. J Neurophysiol. 1989;62:1461–1473. doi: 10.1152/jn.1989.62.6.1461. [DOI] [PubMed] [Google Scholar]
- Rama Rao KV, Jayakumar AR, Norenberg MD. Induction of the mitochondrial permeability transition in cultured astrocytes by glutamine. Neurochem Int. 2003;43:517–523. doi: 10.1016/s0197-0186(03)00042-1. [DOI] [PubMed] [Google Scholar]
- Rao SLN, Meister A. In vivo formation of methionine sulfoximine phosphate, a protein-bound metabolite of methionine sulfoximine. Biochemistry. 1972;11:1123–1127. doi: 10.1021/bi00757a001. [DOI] [PubMed] [Google Scholar]
- Rash JE, Yasumura T, Dudek FE, Nagy JI. Cell-specific expression of connexins and evidence of restricted gap junctional coupling between glial cells and between neurons. J Neurosci. 2001;21:1983–2000. doi: 10.1523/JNEUROSCI.21-06-01983.2001. [DOI] [PMC free article] [PubMed] [Google Scholar]
- Rothstein JD, Martin L, Levey AI, Dykes-Hoberg M, Jin L, Wu D, Nash N, Kuncl RW. Localization of neuronal and glial glutamate transporters. Neuron. 1994;13:713–725. doi: 10.1016/0896-6273(94)90038-8. [DOI] [PubMed] [Google Scholar]
- Schatz RA, Sellinger OZ. Effect of methionine and methionine sulphoximine on rat brain S-adenosyl methionine levels. J Neurochem. 1975;24:63–66. doi: 10.1111/j.1471-4159.1975.tb07628.x. [DOI] [PubMed] [Google Scholar]
- Sellinger OZ, Azcurra JM, Ohlsson WG. Methionine sulfoximine seizures: VIII. The dissociation of the convulsant and glutamine synthetase inhibitory effects. J Pharmacol Exp Ther. 1968;164:212–222. [PubMed] [Google Scholar]
- Sellinger OZ, Schatz RA, Porta R, Wilens TE. Brain methylation and epileptogenesis: the case of methionine sulfoximine. Ann Neurol. 1984;16(Suppl):S115–S120. doi: 10.1002/ana.410160717. [DOI] [PubMed] [Google Scholar]
- Sobel RA, De Armond SJ, Forno LS, Eng LF. Glial fibrillary acidic protein in hepatic encephalopathy: an immunohistochemical study. J Neuropathol Exp Neurol. 1981;40:625–632. doi: 10.1097/00005072-198111000-00004. [DOI] [PubMed] [Google Scholar]
- Suarez I, Bodega G, Arilla E, Fernandez B. Long-term changes in glial fibrillary acidic protein and glutamine synthetase immunoreactivities in the supraoptic nucleus of portacaval shunted rats. Metab Brain Dis. 1996;11:369–379. doi: 10.1007/BF02029497. [DOI] [PubMed] [Google Scholar]
- Suarez I, Bodega G, Arilla E, Fernandez B. Region-selective glutamine synthetase expression in the rat central nervous system following portocaval anastomosis. Neuropathol Appl Neurobiol. 1997;23:254–261. [PubMed] [Google Scholar]
- Suarez I, Bodega G, Arilla E, Rubio M, Villalba R, Fernandez B. Different response of astrocytes and Bergmann glial cells to portacaval shunt: an immunohistochemical study in the rat cerebellum. Glia. 1992;6:172–179. doi: 10.1002/glia.440060304. [DOI] [PubMed] [Google Scholar]
- Suarez I, Bodega G, Fernandez B. Glutamine synthetase in brain: effect of ammonia. Neurochem Int. 2002;41:123–142. doi: 10.1016/s0197-0186(02)00033-5. [DOI] [PubMed] [Google Scholar]
- Sugimoto H, Koehler RC, Wilson DA, Brusilow SW, Traystman RJ. Methionine sulfoximine, a glutamine synthetase inhibitor, attenuates increased extracellular potassium activity during acute hyperammonemia. J Cereb Blood Flow Metab. 1997;17:44–49. doi: 10.1097/00004647-199701000-00006. [DOI] [PubMed] [Google Scholar]
- Swanson RA, Shiraishi K, Morton MT, Sharp FR. Methionine sulfoximine reduces cortical infarct size in rats after middle cerebral artery occlusion. Stroke. 1990;21:322–327. doi: 10.1161/01.str.21.2.322. [DOI] [PubMed] [Google Scholar]
- Szerb JC, Butterworth RF. Effect of ammonium ions on synaptic transmission in the mammalian central nervous system. Prog Neurobiol. 1992;39:135–153. doi: 10.1016/0301-0082(92)90008-3. [DOI] [PubMed] [Google Scholar]
- Takahashi H, Koehler RC, Brusilow SW, Traystman RJ. Inhibition of brain glutamine accumulation prevents cerebral edema in hyperammonemic rats. Am J Physiol. 1991;261:H825–H829. doi: 10.1152/ajpheart.1991.261.3.H825. [DOI] [PubMed] [Google Scholar]
- Takahashi H, Koehler RC, Hirata T, Brusilow SW, Traystman RJ. Restoration of cerebrovascular CO2 responsivity by glutamine synthesis inhibition in hyperammonemic rats. Circ Res. 1992;71:1220–1230. doi: 10.1161/01.res.71.5.1220. [DOI] [PubMed] [Google Scholar]
- Willard-Mack CL, Koehler RC, Hirata T, Cork LC, Takahashi H, Traystman RJ, Brusilow SW. Inhibition of glutamine synthetase reduces ammonia-induced astrocyte swelling in rat. Neuroscience. 1996;71:589–599. doi: 10.1016/0306-4522(95)00462-9. [DOI] [PubMed] [Google Scholar]
- Zwingmann C, Chatauret N, Leibfritz D, Butterworth RF. Selective increase of brain lactate synthesis in experimental acute liver failure: results of a [H-C] nuclear magnetic resonance study. Hepatology. 2003;37:420–428. doi: 10.1053/jhep.2003.50052. [DOI] [PubMed] [Google Scholar]
- Zwingmann C, Chatauret N, Rose C, Leibfritz D, Butterworth RF. Selective alterations of brain osmolytes in acute liver failure: protective effect of mild hypothermia. Brain Res. 2004;999:118–123. doi: 10.1016/j.brainres.2003.11.048. [DOI] [PubMed] [Google Scholar]