Abstract
Exercise increases glucose transport into skeletal muscle via a pathway that is poorly understood. We investigated the role of endogenously produced reactive oxygen species (ROS) in contraction-mediated glucose transport. Repeated contractions increased 2-deoxyglucose (2-DG) uptake roughly threefold in isolated, mouse extensor digitorum longus (fast-twitch) muscle. N-Acetylcysteine (NAC), a non-specific antioxidant, inhibited contraction-mediated 2-DG uptake by ∼50% (P < 0.05 versus control values), but did not significantly affect basal 2-DG uptake or the uptake induced by insulin, hypoxia or 5-aminoimidazole-4-carboxamide-1-β-d-ribofuranoside (AICAR, which mimics AMP-mediated activation of AMP-activated protein kinase, AMPK). Ebselen, a glutathione peroxidase mimetic, also inhibited contraction-mediated 2-DG uptake (by almost 60%, P < 0.001 versus control values). Muscles from mice overexpressing Mn2+-dependent superoxide dismutase, which catalyses H2O2 production from superoxide anions, exhibited a ∼25% higher rate of contraction-mediated 2-DG uptake versus muscles from wild-type control mice (P < 0.05). Exogenous H2O2 induced oxidative stress, as judged by an increase in the [GSSG]/[GSH + GSSG] (reduced glutathione + oxidized glutathione) ratio to 2.5 times control values, and this increase was substantially blocked by NAC. Similarly, NAC significantly attenuated contraction-mediated oxidative stress as judged by measurements of glutathione status and the intracellular ROS level with the fluorescent indicator 5-(and-6)-chloromethyl-2′,7′-dichlorodihydrofluorescein (P < 0.05). Finally, contraction increased AMPK activity and phosphorylation ∼10-fold, and NAC blocked ∼50% of these changes. These data indicate that endogenously produced ROS, possibly H2O2 or its derivatives, play an important role in contraction-mediated activation of glucose transport in fast-twitch muscle.
Exercise/contraction increases glucose transport into muscle by stimulating the translocation of Glut-4 transport proteins to the cell surface by a pathway that differs from that activated by insulin (Coderre et al. 1995; Lund et al. 1995). There is considerable evidence that AMP-activated protein kinase (AMPK) plays an important role in contraction-mediated glucose transport in skeletal muscle (Hayashi et al. 1998; Winder & Hardie, 1999; Kurth-Kraczek et al. 1999; Holloszy, 2003; Jessen & Goodyear, 2005; Sakamoto et al. 2005), although some studies indicate that there may be parallel signalling pathways that do not involve AMPK (Derave et al. 2000; Mu et al. 2001; Jorgensen et al. 2004; Jessen & Goodyear, 2005). Signalling intermediates in the latter pathways that are considered of importance are Ca2+, nitric oxide (NO), the Akt substrate AS160, and possibly protein kinase C (Holloszy, 2003; Jessen & Goodyear, 2005; Rose & Richter, 2005). Interestingly, there is little mention of the possibility that reactive oxygen species (ROS) may play a role in contraction-mediated glucose transport. Recent studies have demonstrated that addition of H2O2 (a member of the ROS family) to isolated cells or perfused rat hearts results in activation of AMPK (Choi et al. 2001; Leon et al. 2004; Nagata et al. 2004), and from earlier studies it is known that addition of H2O2 to cells, including skeletal muscle, also accelerates glucose transport (Livingston et al. 1977; Cartee & Holloszy, 1990; Fischer et al. 1993). Reactive oxygen species are produced at a low rate in resting muscle and at a high rate in contracting muscle (Murrant & Reid, 2001). In view of these observations, we have: (1) assessed whether endogenously produced ROS are involved in contraction-mediated glucose transport; and (2) investigated the mechanism whereby ROS activates glucose transport during contraction.
Methods
Materials
2-Deoxy-d-[1,2-3H]glucose (2-DG), carboxy-[14C]inulin and [γ-32P]ATP were from Amersham Biosciences. Ebselen (E3520) and N-acetylcysteine (NAC, A8199) were from Sigma. Human insulin (Actrapid) was from Novo Nordisk. 5-(and-6)-Chloromethyl-2′,7′-dichloro-dihydrofluorescein diacetate, acetyl ester (CM-H2DCFDA) was from Invitrogen. Antibodies against pan-α-AMPK, phosphorylated α-AMPK (T172), acetyl CoA carboxylase (ACC) and phosphorylated ACC (S79) were from Cell Signalling Technology. All other reagents were from either Sigma or Boehringer Mannheim.
Male NMRI mice weighing 25–30 g were housed at room temperature with a 12 h–12 h light–dark cycle. Food and water were provided ad libitum. The mice were purchased from B&K Universal (Sollentuna, Sweden). Mice overexpressing Mn2+-dependent superoxide dismutase (mitochondrial isoform; SOD2) and wild-type (WT) littermates were generated as described elsewhere (Silva et al. 2005). Superoxide dismutase catalyses the following reaction:
We used mice from the PAC662D1 line exhibiting an almost sixfold increased SOD2 activity (Silva et al. 2005). The mice weighed 25–30 g, and the SOD2 mice did not differ from the WT littermates with respect to body weight and whole body oxygen consumption at 4 or 24°C either before or after noradrenaline injection (Silva et al. 2005). Furthermore, there were no significant differences in twitch kinetics, force–frequency relationship, fatigue development or recovery from fatigue between WT and SOD2 extensor digitorum longus (EDL) muscles (data not shown). This demonstrates that SOD2 overexpression did not alter contractile function, which suggests that muscle fibre composition was also not altered. Animals were killed by rapid cervical dislocation, and the EDL muscles were isolated. All procedures were approved by the Stockholm North ethics committee.
Experimental design
Contraction experiments
For contraction studies, stainless-steel hooks were tied with nylon thread to the tendons of the muscles. Muscles were then transferred to a stimulation chamber (volume ≈ 10 ml) and mounted between a force transducer and an adjustable holder (World Precision Instruments). The chamber temperature was set at 25°C with a water-jacketed circulation bath. The muscle was bathed in a Tyrode solution with the following composition (mm): NaCl, 121; KCl, 5; CaCl2, 1.8; NaH2PO4, 0.4; MgCl2, 0.5; NaHCO3, 24; EDTA, 0.1; glucose, 5.5; and 0.1% fetal calf serum. The pH of the Tyrode solution was set to 7.4 by continuously and directly gassing the solution with 95% O2–5% CO2. Muscles were stimulated with current pulses (0.5 ms duration; ∼150% of the current required for maximum force response) via plate electrodes lying parallel to the fibres. Muscles were set to the length at which tetanic force was maximum and then bathed in a Tyrode solution that contained one of two antioxidants: either 20 mmN-acetylcysteine (NAC; control being addition of 10 mm NaCl) or 30 μm ebselen in DMSO (control being an equivalent volume of DMSO). As a control for the osmotic effect of NAC, 10 mm NaCl was always added to the 121 mm NaCl Tyrode solution bathing the contralateral muscle. Muscles were then allowed to rest for 60 min. Thereafter, the muscles were stimulated at 50 Hz (tetanic duration 100 ms, 2 trains s−1) for 10 min. This protocol decreases muscle glycogen by ∼80% (Sandström et al. 2004). For measurements of AMPK and glutathione status (see below), muscles were quick-frozen in liquid N2 within 5 s after the last tetanus. For measurement of glucose uptake, muscles were transferred at the end of the 10 min stimulation to vials containing 1.5 ml Tyrode solution lacking glucose and containing 2 mm pyruvate with or without the test drug (or vehicle) and incubated in a shaking water-bath (110 oscillations min−1, 35°C, air phase in vial was continuously gassed with 95% O2–5% CO2) for 40 min and frozen in liquid nitrogen. Radiolabelled 2-DG (1 mm) and inulin were added 20 min before freezing as described elsewhere (Shashkin et al. 1995).
To assess intracellular ROS formation in contracting muscle, small bundles of 5–20 fibres were mechanically dissected from the EDL muscle. Bundles were loaded with the ROS-sensitive indicator by incubation for 90–120 min in 10 μm CM-H2DCFDA at room temperature. Thereafter, bundles were transferred to the muscle trough and stretched to the length at which tetanic force was maximal. Muscles were then washed for 30 min with 5.5 mm glucose Tyrode solution (± 20 mm NAC). A BIO-RAD MRC 1024 and a Nikon Diaphot 200 inverted microscope with a ×20 objective lens (NA 0.75) were used. In the cell, esterases cleave CM-H2DCFDA to release CM-H2DCFH, which is converted to a fluorescent product (CM-H2DCF) when exposed to ROS (Xie et al. 1999). CM-H2DCF was excited with 488 nm light, and the emitted light collected through a 515 nm long-pass filter. Confocal images were taken of the muscle fibres at rest and then after 10 min of intermittent tetanic contractions (same stimulation protocol as for the whole EDL muscle). When NAC was added, it was after the loading period and remained in the medium until after the postcontraction scans were made. CM-H2DCF fluorescence was measured before and after contraction and after the bundle was exposed to 1 mm H2O2 for 5 min. Confocal images were stored and analysed offline with ImageJ (available at http://rsb.info.nih.gov/ij/). Changes in intracellular CM-H2DCF fluorescence intensity are expressed as a percentage of that before the series of contractions or H2O2 exposure.
Rested muscle experiments
A series of glucose uptake experiment was also performed in resting muscle preparations. These muscles were incubated in 1.5 ml of the pyruvate-supplemented Tyrode solution at 35°C in the shaking water-bath as described above. To examine the effects of antioxidants on basal glucose uptake, muscles were incubated in the presence of NAC or ebselen (with appropriate controls) in the shaking bath for 80 min and then frozen. To examine the effects of hypoxia with or without NAC on glucose uptake, muscles were continuously gassed with 95% N2–5% CO2 for a total of 80 min (Cartee et al. 1991). N-Acetylcysteine was present throughout the 80 min incubation period in half the samples. Since ∼60 min are required to observe the maximal effect of hypoxia on glucose transport in isolated muscle preparations (Cartee et al. 1991), no preincubation with NAC in 95% O2–5% CO2 was performed. To examine the effects of 5-aminoimidazole-4-carboxamide-1-β-d-ribofuranoside (AICAR; final concentration, 2 mm) on glucose uptake, muscles were incubated first for 30 min and then AICAR was added to the muscles and the incubation was continued for an additional 80 min (Kurth-Kraczek et al. 1999). N-Acetylcysteine was present throughout the 110 min incubation period in half the samples. AICAR is converted in the cell to AICAR-monophosphate, which is an AMP mimetic that activates AMPK and AMPK kinase (Young et al. 1996; Kurth-Kraczek et al. 1999). To examine the effects of insulin (final concentration, 20 mU ml−1) on glucose uptake, muscles were preincubated for 30 min; insulin was added and the incubation was continued for an additional 50 min. N-Acetylcysteine was present throughout the 80 min incubation period in half the samples. 2-Deoxyglucose and inulin were present during the last 20 min of incubation in these experiments. During the insulin experiments, bovine serum albumin (0.1% v/v) was present in the pyruvate-supplemented Tyrode solution to inhibit insulin binding to the glass vial.
To study the effects of exogenous H2O2 (final concentration = 3 mm) on glutathione status, muscles were incubated in 1.5 ml of the 5.5 mm glucose Tyrode solution in the shaking bath at 35°C for 90 min and then frozen. H2O2 was added after the initial 60 min of incubation. NAC was present throughout the 90 min incubation period in half the samples. To study the effects of NAC on glutathione status and AMPK activity in resting muscles, muscles were incubated in 1.5 ml of the 5.5 mm glucose Tyrode solution in the shaking bath at 25°C for 60 min and then frozen. NAC was present throughout the 60 min incubation period in half the samples. The latter experiments were performed at 25°C, because the contraction-mediated changes in glutathione status and AMPK activity were also studied at this temperature.
To study the effects of exogenous H2O2 (final concentration, 3 mm) on glucose uptake, muscles were incubated in pyruvate-supplemented Tyrode solution in the shaking bath for 80 min at 35°C (see above). Hydrogen peroxide was added to half the muscles after 30 min. Isotopes were present during the last 20 min of incubation. To examine the effects of exogenous H2O2 on AMPK activity, muscles were incubated in the shaking bath for 60 min at 25°C in 5.5 mm glucose Tyrode solution (since basal and contraction-mediated AMPK activities were studied under these conditions). Hydrogen peroxide was added to half the muscles after 30 min.
Analytical
2-Deoxyglucose uptake
For analysis of 2-DG uptake, frozen muscles were added to preweighed Eppendorf tubes containing 0.5 ml of 1 n NaOH. The muscle was weighed and then digested at 70°C for 15 min. The tubes were cooled on ice and centrifuged at 23 000g for 5 min. Aliquots of the supernatant were added to scintillation cocktail and counted for 14C and 3H as described earlier (Shashkin et al. 1995).
Glutathione
For analysis of glutathione, a kit was used (Biooxytech GSH/GSSG-412, Oxis Health Products, Portland, OR, USA). Muscles were freeze-dried, dissected free of non-muscle constituents, powdered and thoroughly mixed. The powders were divided into two aliquots, which were homogenized in ground glass homogenizers containing ice-cold 5% metaphosphoric acid (80 μl (mg dry weight)−1) with and without 1-methyl-2-vinyl-pyridinium trifluoromethane sulphonate (M2VP; 10% v/v), a scavenger of reduced glutathione (GSH). The homogenates were centrifuged at 23 000g for 15 min at 4°C. The pellets were digested with 1 n NaOH (60°C) and assayed for protein with the Bio-Rad assay (BIO-RAD). For measurement of reduced + oxidized glutathione (TGSH = GSH + oxidized gluthathione [GSSG]), 4 μl supernatant were mixed with 96 μl assay buffer, and for GSSG estimation, 5 μl of the supernatant with M2VP were mixed with 95 μl GSSG assay buffer. For both assays, the samples were mixed with 300 μl of chromagen, glutathione reductase and NADPH, and absorbance (reduction of dithiobis-2-nitrobenzoic acid at 412 nm) was measured after 4.5 min in a spectrophotometer. Preliminary experiments demonstrated that the assays were linear with respect to the extract volume used and reaction time, and GSH was not detectable in the presence of M2VP (data not shown).
AMPK
AMPK activity was analysed by assessing the incorporation of radiolabelled phosphate from ATP into SAMS peptide (Winder & Hardie, 1996) with some modifications. Briefly, muscles were freeze-dried and treated as above. Muscles were homogenized in ice-cold buffer (100 μl (mg dry weight)−1) consisting of (mm): Tris, 10; sucrose, 250; NaF, 50; EDTA, 1; β-mercaptoethanol, 10; and one tablet protease inhibitor cocktail (Roche) per 50 ml of buffer, pH 7.5. The homogenate was centrifuged at 23 000g for 30 min at 4°C. The supernatant was divided into aliquots. One aliquot was assayed for protein (see above). Another aliquot was diluted with seven volumes of homogenization buffer, and 10 μl of the diluted extract were mixed with 30 μl reaction buffer, resulting in the following final concentrations (mm): Hepes (pH 7.0), 40; SAMS peptide, 0.2; NaCl, 80; EDTA, 0.8; AMP, 0.2; dithiothreitol (DTT), 0.8; MgCl2, 5; ATP, 0.2; [γ-32P]ATP, 2 μCi; and glycerol, 8% (v/v);. The assay was performed at 37°C for 10 min. Thereafter, 30 μl of the mixture were spotted onto Whatman P81 discs, washed in 1% phosphoric acid, dried and counted. Blanks consisted of mixtures spotted without incubation. The assay was linear with respect to the used extract volume and reaction time, and no activity was detected in the absence of SAMS peptide (data not shown). In preliminary experiments, we also assayed the AMPK activity in ammonium-sulphate-precipitated extracts as described by others (Winder & Hardie, 1996). While this procedure also yielded linearity with respect to extract volume and reaction time, there was a large loss of enzyme activity when compared to results from untreated extracts (data not shown). These findings are in agreement with results recently reported by others (Derave et al. 2000). Because of the prevention of enzyme loss and the decrease in preparative steps, assays were performed on untreated supernatants.
Western blots were performed for phosphorylated and total AMPK and ACC. Briefly, 20 (total and phosphorylated ACC) or 25 μg (total and phosphorylated AMPK) of supernatant (see above) protein were separated by SDS-PAGE (4–12% Bis-Tris Gels; Invitrogen) and transferred onto polyvinylidine fluoride (PVDF) membranes (BIO-RAD). Membranes were blocked in 5% (w/v) non-fat milk in Tris-buffered saline containing 0.05% Tween 20 followed by incubation with primary antibodies (all at 1:1000 dilution) overnight. Membranes were then washed and incubated with secondary antibody (donkey antirabbit at 1:2000 dilution for all). Immunoreactive bands were visualized using enhanced chemiluminescence (Super Signal, Pierce, Rockford, IL, USA.). Band densities were analysed with ImageJ (NIH, USA; http://rsb.info.nih.gov/j/).
Values for glutathione and AMPK are expressed relative to dry weight. Differences between groups were maintained also if the results were adjusted for protein. Force was sampled on-line and stored on a desktop computer for subsequent analysis. Tetanic force was measured as the peak force during the 100 ms of stimulation.
Statistics
Signficant differences between means were determined with Student's t test for paired samples. P < 0.05 was regarded as significant. Values are presented as means ± s.e.m.
Results
N-Acetylcysteine and 2-DG uptake
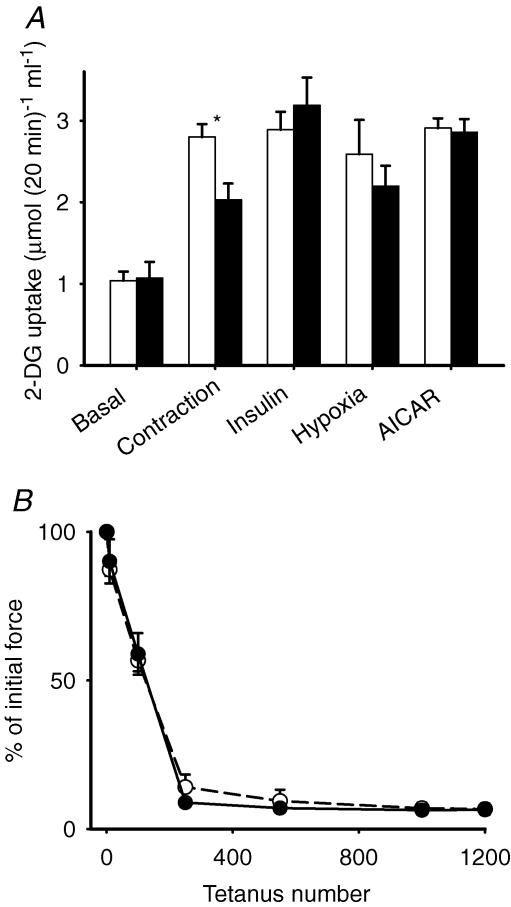
Contraction increased 2-DG uptake roughly threefold (Fig. 1A). In the presence of NAC, the rate of 2-DG uptake after contraction was significantly lower than during control conditions. Thus, NAC abolished ∼50% of contraction-mediated 2-DG uptake. N-Acetylcysteine did not affect basal 2-DG uptake, which is primarily ascribed to the availability of Glut-1 transport proteins in the cell membrane (Mueckler, 1994). However, contraction accelerates glucose transport via translocation of Glut-4 transport proteins to the cell surface. Therefore, we determined whether other interventions that increase glucose transport via translocation of Glut-4 proteins (Holloszy, 2003; Jessen & Goodyear, 2005; Rose & Richter, 2005) are affected by NAC. We found that insulin, hypoxia and AICAR increased 2-DG uptake to values similar to that seen with contraction, but NAC did not significantly affect these increases. It could be argued that NAC interfered with contraction-mediated 2-DG uptake owing to an inhibition of force production. However, force generation during the repeated contractions in the presence of NAC was virtually identical to control values (Fig. 1B).
Figure 1. N-Acetylcysteine inhibits contraction-mediated glucose uptake in mouse EDL muscle.
Values are means ± s.e.m. for 6–8 muscles (A) or 6 muscles (B). A, open bars, control; filled bars, NAC (20 mm). *P < 0.05 versus control values. B, NAC does not affect force generation during 10 min period of repeated contractions (○, control; •, NAC). Initial force averaged 20.8 ± 1.8 mN (mg wet weight)−1 for control conditions and 23.0 ± 1.4 mN (mg wet weight)−1 for NAC; n.s.).
It should be noted that since contractile function in isolated mouse EDL deteriorates after ∼20 min at 35°C (Zhang et al. 2006), and a 60 min preincubation period was required, the contraction-mediated 2-DG uptake was induced at 25°C. However, insulin-, hypoxia- and AICAR-mediated 2-DG uptake were induced at 35°C. All 2-DG uptake measurements were performed at 35°C. Therefore, caution should be exerted in directly comparing 2-DG uptake between different modes of glucose uptake induced at different temperatures.
N-Acetylcysteine and ROS formation
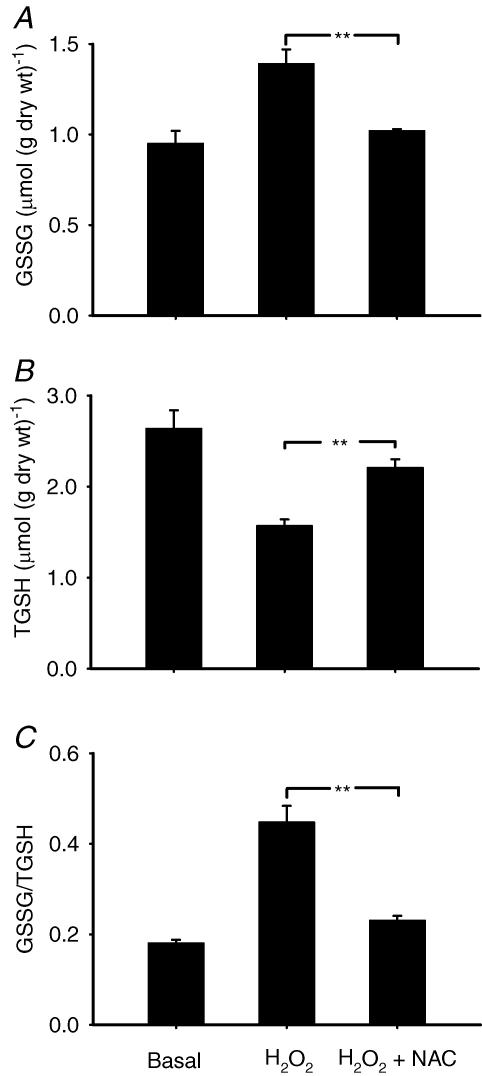
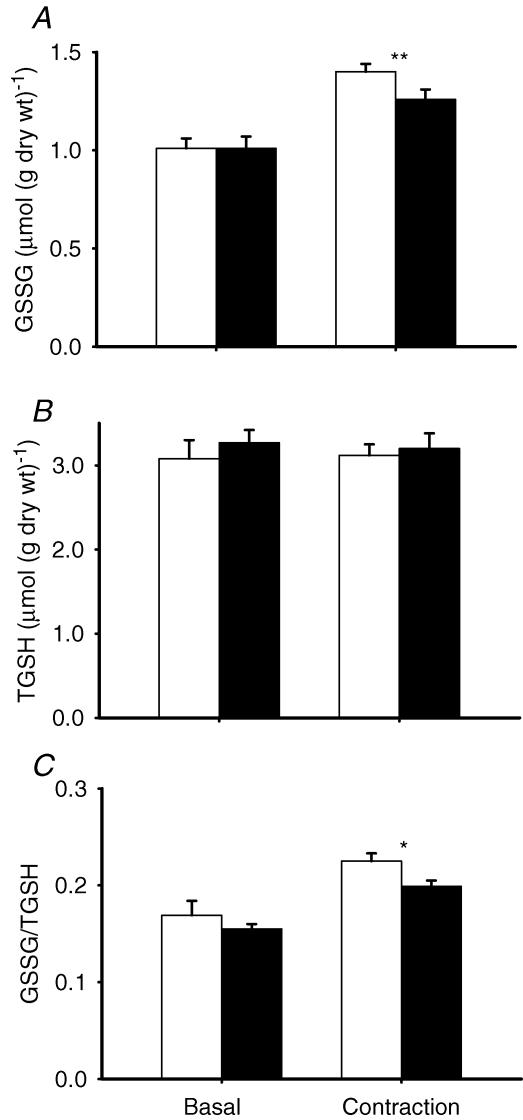
The above results with NAC implicated endogenously produced ROS in contraction-mediated glucose uptake. Glutathione status is commonly used as a measure of intracellular oxidative stress and was therefore studied in the next series of experiments. Glutathione peroxidase catalyses the following reaction: H2O2+ 2GSH → GSSG + 2H2O; thus changes in GSH and GSSG will reflect changes in H2O2. First, we incubated muscles with 3 mm H2O2 in the absence and presence of NAC. Hydrogen peroxide resulted in a marked degree of oxidative stress as evidenced by a decrease in TGSH (Fig. 2). The decrease in TGSH was probably associated with an increase in mixed disulphides, since protein glutathionylation occurs with excessive oxidative stress (Ghezzi, 2005). Hydrogen peroxide also increased the GSSG/TGSH ratio to ∼250% of control values, and NAC counteracted the H2O2-dependent effect. We then investigated the effect of contraction in the absence and presence of NAC on glutathione status. N-Acetylcysteine did not affect glutathione status in the basal state, but resulted in significantly smaller changes in GSSG and the GSSG/TGSH ratio following contraction (Fig. 3). In summary, NAC decreased the oxidative stress associated with addition of exogenous H2O2 and repeated contractions.
Figure 2. N-Acetylcysteine inhibits H2O2-induced oxidative stress in mouse EDL muscle.
Values are means ± s.e.m. for 6 muscles. TGSH is the sum of GSH and GSSG. Muscles were untreated (basal), exposed to H2O2 (3 mm) or to H2O2 + NAC (20 mm). A, GSSG; B, TGSH; and C, GSSG/TGSH (the ratio is in GSH equivalents). **P < 0.01. Muscles in the basal group were from a separate group of mice studied at the same time as the other groups; the basal values are included in the statistical analysis and serve solely as reference values.
Figure 3. N-Acetylcysteine inhibits contraction-induced oxidative stress in mouse EDL muscle.
Values are means ± s.e.m. for 6 muscles. TGSH, sum of GSH and GSSG. Unfilled bars, basal; filled bars, NAC (20 mm). A, GSSG; B, TGSH; and C, GSSG/TGSH (the ratio is in GSH equivalents). *P < 0.05; **P < 0.01 versus control values.
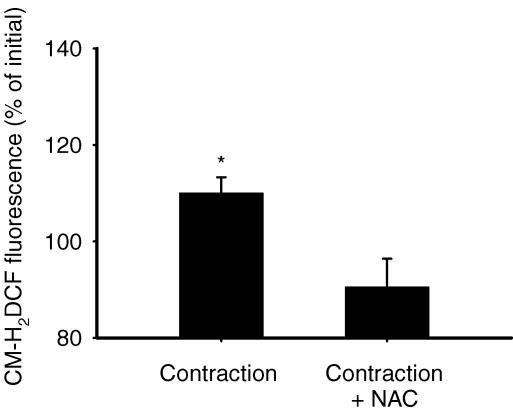
We then used CM-H2DCF to measure intracellular ROS formation in bundles of EDL fibres. Repeated contractions resulted in a significant increase in fluorescence, reflecting an increase in ROS levels, whereas no increase was observed in the presence of NAC (Fig. 4). The increase we detected was modest, but is in line with earlier findings in isolated rat diaphragm bundles (about 30% increase after 1 h of repeated contractions; Reid et al. 1992). Repeated current pulses may generate molecular species that can affect our measurements of ROS formation. Therefore, control experiments were performed where muscle bundles were first incubated with 1 μm tetrodotoxin for 5 min to abolish action potentials and force generation (Belluardo et al. 2001) and then exposed to repeated tetanic stimulations. Under these conditions, there was no significant effect of stimulation on CM-H2DCF fluorescence (89 ± 6% of prestimulation value, n.s.; n = 5). This demonstrates that the increase in fluorescence seen with stimulation (Fig. 4) did not result from an artefact associated with field stimulation. Then 1 mm H2O2 was added to the muscle preparation at the end of each experiment and always gave a robust increase in fluorescence (136 ± 6%, P < 0.001; n = 15). Thus NAC attenuated endogenous ROS formation during contraction as measured by two independent methods: glutathione status and CM-H2DCF fluorescence. Finally, it should be noted that the effects of contraction on glutathione status and CM-H2DCF fluorescence were markedly smaller than those seen with the addition of exogenous H2O2, which indicates that the degree of ROS production during contraction was limited and did not reach high/pathological levels (see Discussion).
Figure 4. N-Acetylcysteine inhibits contraction-mediated ROS formation in bundles of mouse EDL muscle fibres.
Values are means ± s.e.m. Measurements of CM-H2DCF fluorescence were performed in muscle fibres that underwent 10 min of repeated contractions in the absence (contraction, n = 6) or presence of 20 mm NAC (contraction + NAC, n = 4). Data are expressed as a percentage of the pretreatment value. *P < 0.05 versus precontraction value.
N-Acetylcysteine and AMPK
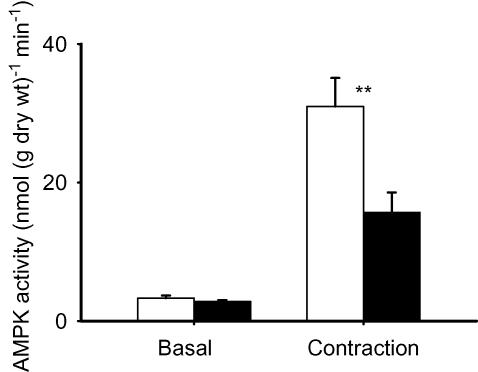
The results thus far indicated that ROS/H2O2 (or their derivatives) produced during contraction resulted in an accelerated glucose transport that was presumably mediated by the Glut-4 transport protein. To investigate the pathway through which ROS were working, we measured AMPK activity following contraction in the absence and presence of NAC. N-Acetylcysteine had no significant effect on AMPK activity in resting muscle (Fig. 5). Contraction resulted in almost a 10-fold increase in AMPK activity and about 50% of the increase was blocked by NAC. Thus NAC inhibited contraction-mediated activation of AMPK and 2-DG uptake to the same relative extent. We verified that exogenous H2O2 activates AMPK in mouse EDL muscles (basal, 5.9 ± 1.6 nmol (g dry weight)−1 min−1; and in the presence of 3 mm H2O2, 18.2 ± 4.0 nmol (g dry weight)−1 min−1; n = 6; P < 0.05). It is noteworthy that the increase in AMPK activity induced by H2O2 under basal conditions (∼12 nmol (g dry weight)−1 min−1) is similar to that blocked by NAC during contraction (∼15 nmol (g dry weight)−1 min−1; Fig. 5).
Figure 5. N-Acetylcysteine inhibits contraction-mediated activation of AMPK in mouse EDL muscle.
Values are means ± s.e.m. for n = 6 (basal) or n = 5 muscles (contraction). Open bars, control; filled bars, NAC (20 mm). Muscles were stimulated for 10 min with repeated contractions. **P < 0.01 versus control values.
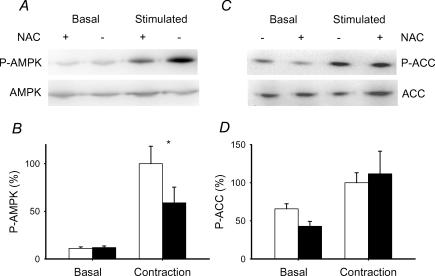
Since AMPK activity is modulated by phosphorylation, we also determined the extent of AMPK phosphorylation after contraction in the absence and presence of NAC. Consistent with the changes in AMPK activity, contraction resulted in almost a 10-fold increase in AMPK phosphorylation (Fig. 6A and B). N-Acetylcysteine did not affect AMPK phosphorylation in the basal state, but diminished the degree of phosphorylation after contraction by about 50%, which is in agreement with the effects of NAC on AMPK activity after repeated contractions. Acetyl CoA carboxylase participates in the control of fatty acid oxidation and is a substrate for AMPK. Therefore, we also measured ACC phosphorylation, which should inactivate the enzyme. Repeated contractions also increased ACC phosphorylation, but the increase was not affected by NAC (Fig. 6C and D). N-Acetylcysteine did not affect expression of either total AMPK or total ACC expression in the basal state or after contraction (data not shown). Taken together, the results are consistent with the idea that NAC was blocking a H2O2-mediated activation of AMPK during repeated contractions.
Figure 6. N-Acetylcysteine inhibits contraction-mediated phosphorylation of AMPK but not ACC in mouse EDL muscle.
A, representative immunoblots of phosphorylated AMPK (P-AMPK) and total AMPK (AMPK). B, mean ± s.e.m. values for P-AMPK (n = 4). Open bars, control; filled bars, NAC (20 mm). The mean value of the stimulated controls is set to 100% and all the other values are expressed as a percentage of this value. Muscles were stimulated for 10 min with repeated contractions. *P < 0.05 versus control values. C, representative immunoblots of phosphorylated ACC (P-ACC) and total ACC (ACC). D, mean ± s.e.m. values for P-ACC (n = 4). See B for additional details.
Hydrogen peroxide and 2-DG uptake
N-Acetylcysteine is a general antioxidant and thus does not indicate the species of ROS that may mediate glucose transport during contraction. However, the results thus far were consistent with the involvement of H2O2. To assess the role of H2O2 more directly, two strategies were employed: (1) use of another antioxidant, ebselen; and (2) use of muscles overexpressing SOD2. Ebselen is a glutathione peroxidase mimetic that removes H2O2 in the presence of GSH (Cotgreave et al. 1987). Thus ebselen should enhance H2O2 removal and would therefore be expected to inhibit contraction-mediated glucose uptake. With respect to SOD2 overexpression, we assumed that these muscles would exhibit increased H2O2 production (hence increased glucose uptake) during contraction, owing to increased conversion of superoxide to H2O2. Consistent with this assumption is the observation that when superoxide production in mitochondria isolated from skeletal muscle is accelerated, the accumulation of superoxide is decreased in mice overexpressing SOD2 versus wild type (Silva et al. 2005).
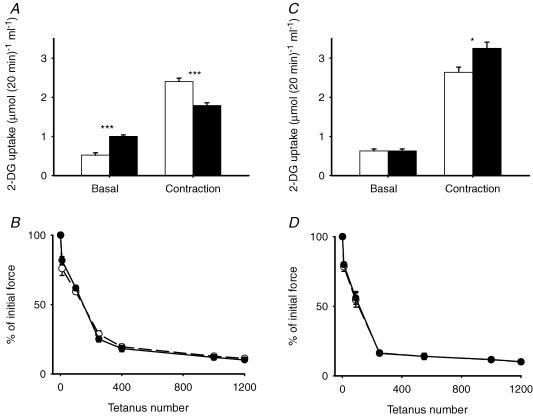
Ebselen significantly increased basal 2-DG uptake (Fig. 7A). Despite this increase, 2-DG uptake was still significantly lower after contraction in the presence of ebselen. Thus the contraction-mediated 2-DG uptake was diminished by ebselen by almost 60%, which is similar to the inhibition seen with NAC. Ebselen resulted in a small decrease in initial force (control, 15.6 ± 1.4 mN (mg wet weight)−1; ebselen, 13.0 ± 0.9 mN (mg wet weight)−1; P < 0.05). However, the fatigue profile was not significantly affected during the repeated contractions (Fig. 7B).
Figure 7. Ebselen inhibits and overexpression of SOD2 enhances contraction-mediated glucose uptake in mouse EDL muscle.
Values are means ± s.e.m. for 6–9 muscles. A, open bars, control; filled bars, ebselen (30 μm). ***P < 0.001 versus control values. B, ebselen does not affect the decline in force during repeated contractions (○, control; •, ebselen). C, open bars, wild type; filled bars, SOD2 overexpression. *P < 0.05 versus wild type. D, SOD2 overexpression does not affect force generation during repeated contractions (○, control; •, SOD2 overexpression). Initial force averaged 14.9 ± 0.8 mN (mg wet weight)−1 for wild type and 16.0 ± 1.3 mN (mg wet weight)−1 for SOD2 overexpression (n.s.).
Overexpression of SOD2 did not significantly affect the basal rate of 2-DG uptake (Fig. 7C), probably owing to the low rate of ROS production in the basal state. In contrast, 2-DG uptake was significantly higher (∼25%) after a series of repeated contractions in SOD2 overexpressing versus wild-type muscles. This increase was not associated with alterations in force production (Fig. 7D). It might be argued that the increase in contraction-mediated 2-DG uptake is a consequence of an adaptive increase in the capacity of the glucose transport system and thus all interventions that result in Glut-4 translocation will result in higher values in SOD2 overexpressing muscles. We therefore stimulated 2-DG uptake with insulin. In contrast to the effect of SOD2 overexpression on contraction-mediated 2-DG uptake, insulin-mediated 2-DG uptake was not significantly altered (WT, 2.72 ± 0.31 μmol (20 min)−1 (ml intracellular water)−1; SOD2, 2.51 ± 0.24 μmol (20 min)−1 (ml intracellular water)−1; n = 6).
The data from the NAC, ebselen and SOD2 experiments are consistent with the idea that H2O2, or its derivatives, plays a significant in role in contraction-mediated glucose transport. In line with this idea, we determined that exogenous H2O2 also stimulates 2-DG uptake in mouse EDL muscles (basal, 0.82 ± 0.31 μmol (20 min)−1 (ml intracellular water)−1; in presence of 3 mm H2O2, 2.10 ± 0.31 μmol (20 min)−1 (ml intracellular water)−1; P < 0.001).
Discussion
The major findings of the present study are: (1) antioxidants diminish contraction-mediated 2-DG uptake, but not insulin-, hypoxia- or AICAR-mediated 2-DG uptake; (2) overexpression of SOD2 increases contraction-mediated 2-DG uptake; (3) NAC diminishes contraction-mediated activation and phosphorylation of AMPK; and (4) antioxidants diminish contraction-mediated 2-DG uptake and activation/phosphorylation of AMPK to the same relative extent. These findings support the idea that endogenous ROS production plays an important role in contraction-mediated glucose transport and that the ROS effect is mediated via an AMPK-dependent pathway.
While this study was in progress, it was reported that exogenous H2O2, as well as a superoxide-generating system, accelerated glucose transport in isolated resting rat epitrochlearis muscles by a mechanism that involved the activation of the α1 isoform of AMPK (Toyoda et al. 2004). Moreover, the effects of H2O2 and the superoxide-generating system on glucose transport and AMPK activity, as well as glutathione status, were partly blocked by NAC. These results are consistent with the findings in the present study, which indicate that endogenous ROS production is involved in activating glucose transport during contraction. Thus, of the various ROS components, H2O2, or its derivatives, is most likely to be the activating factor during contraction.
The possibility that reactive nitrogen species (RNS) also participate in contraction-mediated glucose transport was not addressed in the present study. Indeed, there is considerable evidence that RNS are produced during muscle contraction (Murrant & Reid, 2001). Specifically, increased NO production has been proposed to mediate contraction-stimulated glucose transport (Balon & Nadler, 1997; Roberts et al. 1997). However, other studies indicate that NO-mediated glucose transport occurs via a pathway that is distinct from the contraction-mediated pathway (Etgen et al. 1997; Higaki et al. 2001).
The idea that ROS are involved in contraction-mediated glucose transport may not be intuitive. This is because oxidative stress may play a role in insulin resistance and the pathogenesis of diabetes (Bonnefont-Rousselot, 2002; Houstis et al. 2006). Indeed, it is well known that excessive levels of ROS have deleterious effects on cell function and viability, whereas low/physiological levels of ROS are requisite for various signalling pathways and optimal cell function (Murrant & Reid, 2001; Goldstein et al. 2005). The present results implicating endogenously produced ROS in contraction-mediated glucose transport support the idea that a limited ROS production is requisite for normal physiological function.
An interesting finding was that NAC significantly blocked contraction- but not hypoxia-mediated glucose transport. These two stimuli are believed to activate glucose transport by similar but not identical pathways (Wojtaszewski et al. 1998). It is generally believed that mitochondria are the primary source of ROS produced in eukaryotic cells and that 2–5% of electron flux through the respiratory chain escapes to produce superoxide anions (Murrant & Reid, 2001). Thus an increase in mitochondrial respiration would be expected to result in a proportional increase in superoxide production. There is also evidence that ROS can be produced in extramitochondrial sites and under anaerobic conditions (Murrant & Reid, 2001; Zuo & Clanton, 2005). Our results are consistent with the idea that more ROS are produced during conditions associated with high rates of mitochondrial respiration.
The findings that NAC partly inhibited contraction-mediated activation of AMPK and that exogenous H2O2 activated AMPK raise the question of the mechanism whereby ROS results in AMPK activation. AMPK is usually considered to be activated by increases in AMP and decreases in ATP and phosphocreatine (PCr; Ponticos et al. 1998). While this manuscript was under review, evidence was presented from vascular endothelium cells that mitochondrially derived ROS activated AMPK by a mechanism independent of nucleotide concentrations (Quintero et al. 2006).
Incubation of isolated rat skeletal muscle with ROS (1 mm H2O2 or a superoxide-generating system) also did not result in significant changes in the total tissue AMP/ATP ratio (Toyoda et al. 2004). Similarly, perfusion of isolated rat hearts with 300 μm H2O2, which was sufficient to significantly activate AMPK, did not significantly alter the AMP/ATP ratio (Leon et al. 2004). Furthermore, if oxidants induce decreases in high-energy phosphates, then antioxidants should block such decreases. However, antioxidants do not affect the changes in high-energy phosphates (ATP, PCr and inorganic phosphate) that occur in the isolated rat diaphragm during repeated contractions, hypoxia or contractions in the presence of hypoxia (Wright et al. 2005). Consistent with these data is the present finding that NAC does not interfere with AMP-mediated activation of AMPK (AICAR experiment).
It was recently demonstrated that an important upstream kinase in the AMPK cascade is LKB1 and, based on current evidence, LKB1-mediated phosphorylation and activation of AMPK are not sensitive to AMP. Moreover, blocking LKB1 activity resulted in an inability of H2O2 to activate AMPK (Woods et al. 2003). We therefore suggest that the activation of AMPK by endogenously produced ROS during contraction does not occur via alterations in high-energy phosphates. Other modes of activation of AMPK that are independent of changes in adenine nucleotides include hyperosmotic shock and exposure to metformin (Fryer et al. 2002). Thus, it appears that contraction-mediated activation of AMPK can occur by at least two mechanisms: one that is NAC insensitive and involves changes in high-energy phosphates and one that is NAC sensitive and independent of changes in high-energy phosphates.
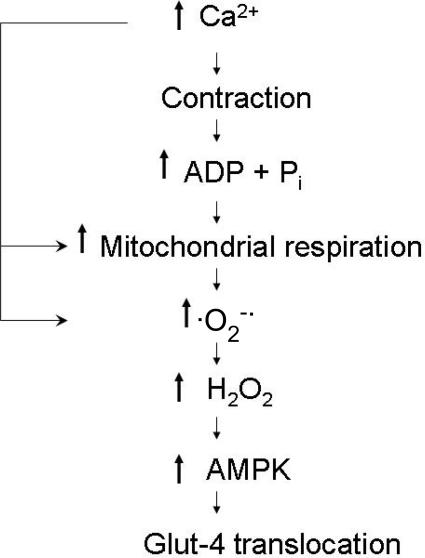
A scheme describing the steps whereby we suggest that endogenously produced ROS result in the activation of AMPK and glucose transport is provided in Fig. 8. The scheme indicates that Ca2+, in addition to initiating contraction, can participate in ROS production at different sites in the cell. Hydrogen peroxide-mediated activation of AMPK probably occurs via LKB1 (see above). However, previously presented data indicate that H2O2 does not directly activate LKB1 (Woods et al. 2003). Rather, it appears that H2O2 enhances the substrate suitability of AMPK for LKB1.
Figure 8. Scheme for ROS-mediated glucose transport during muscle contraction.
Following the release of Ca2+ from the sarcoplasmic reticulum, actomyosin interaction occurs, resulting in muscle contraction, ATP breakdown and increases in ADP and inorganic phosphate (Pi). ADP and Pi stimulate mitochondrial respiration, which can also be stimulated by increases in Ca2+ that activate mitochondrial dehydrogenases. Increased respiration results in superoxide anion (O2−·) formation through NADH dehydrogenase and semiquinone components; O2−· formation can also occur by extramitochondrial mechanisms (e.g. via a Ca2+-mediated activation of phospholipase A2). Superoxide anion is then dismutated by superoxide dismutase to H2O2, which results in increased LKB1-mediated phosphorylation and activation of AMPK, followed by a translocation of Glut-4 to the surface membrane.
Another interesting finding was that the contraction-mediated phosphorylation of ACC was not affected by NAC. Acetyl CoA carboxylase is a substrate for AMPK and therefore ACC phosphorylation during contraction is often considered to reflect increased AMPK activity, since the increase in the phoshorylation state of the two proteins is well correlated during contraction (Park et al. 2002). The dissociation between the changes in AMPK and ACC phosphorylation following contraction in the presence of NAC is not the first evidence for such dissociation during contraction. Recently, it was demonstrated in skeletal muscle from adenylate kinase-deficient mice (which lack the ability to produce AMP) that repeated contractions did not result in phosphorylation of AMPK, whereas phosphorylation of ACC was comparable to that of wild-type mice (Hancock et al. 2006). Other instances of dissociation between ACC and AMPK phosphorylation have also been observed (see Hancock et al. 2006 for references). Thus, factors other than AMPK can control ACC phosphorylation during contraction and these factors are not NAC sensitive.
A complete understanding of the mechanisms involved in contraction-mediated glucose transport is still lacking. To our knowledge, this study provides the first evidence in support of the idea that endogenously produced ROS play a significant role in contraction-mediated glucose transport in fast-twitch muscle.
Acknowledgments
This research was supported by grants from the NIH (DK066232), the Muscle Dystrophy Association, the Swedish Research Council (no. 10842), Stiftelsen Lars Hiertas Minne and the Swedish National Center for Sports Research (no. 81/05).
References
- Balon TW, Nadler JL. Evidence that nitric oxide increases glucose transport in skeletal muscle. J Appl Physiol. 1997;82:359–363. doi: 10.1152/jappl.1997.82.1.359. [DOI] [PubMed] [Google Scholar]
- Belluardo N, Westerblad H, Mudo G, Casabona A, Bruton J, Caniglia G, Pastoris O, Grassi F, Ibanez CF. Neuromuscular junction disassembly and muscle fatigue in mice lacking neurotrophin-4. Mol Cell Neurosci. 2001;18:56–67. doi: 10.1006/mcne.2001.1001. [DOI] [PubMed] [Google Scholar]
- Bonnefont-Rousselot D. Glucose and reactive oxygen species. Curr Opin Clin Nutr Metab Care. 2002;5:561–568. doi: 10.1097/00075197-200209000-00016. [DOI] [PubMed] [Google Scholar]
- Cartee GD, Douen AG, Ramlal T, Klip A, Holloszy JO. Stimulation of glucose transport in skeletal muscle by hypoxia. J Appl Physiol. 1991;70:1593–1600. doi: 10.1152/jappl.1991.70.4.1593. [DOI] [PubMed] [Google Scholar]
- Cartee GD, Holloszy JO. Exercise increases susceptibility of muscle glucose transport to activation by various stimuli. Am J Physiol. 1990;258:E390–E393. doi: 10.1152/ajpendo.1990.258.2.E390. [DOI] [PubMed] [Google Scholar]
- Choi SL, Kim SJ, Lee KT, Kim J, Mu J, Birnbaum MJ, Soo KS, Ha J. The regulation of AMP-activated protein kinase by H2O2. Biochem Biophys Res Commun. 2001;287:92–97. doi: 10.1006/bbrc.2001.5544. [DOI] [PubMed] [Google Scholar]
- Coderre L, Kandror KV, Vallega G, Pilch PF. Identification and characterization of an exercise-sensitive pool of glucose transporters in skeletal muscle. J Biol Chem. 1995;270:27584–27588. doi: 10.1074/jbc.270.46.27584. [DOI] [PubMed] [Google Scholar]
- Cotgreave IA, Sandy MS, Berggren M, Moldeus PW, Smith MT. N-Acetylcysteine and glutathione-dependent protective effect of PZ51 (ebselen) against diquat-induced cytotoxicity in isolated hepatocytes. Biochem Pharmacol. 1987;36:2899–2904. doi: 10.1016/0006-2952(87)90200-0. [DOI] [PubMed] [Google Scholar]
- Derave W, Ai H, Ihlemann J, Witters LA, Kristiansen S, Richter EA, Ploug T. Dissociation of AMP-activated protein kinase activation and glucose transport in contracting slow-twitch muscle. Diabetes. 2000;49:1281–1287. doi: 10.2337/diabetes.49.8.1281. [DOI] [PubMed] [Google Scholar]
- Etgen GJ, Jr, Fryburg DA, Gibbs EM. Nitric oxide stimulates skeletal muscle glucose transport through a calcium/contraction- and phosphatidylinositol-3-kinase-independent pathway. Diabetes. 1997;46:1915–1919. doi: 10.2337/diab.46.11.1915. [DOI] [PubMed] [Google Scholar]
- Fischer Y, Rose H, Thomas J, Deuticke B, Kammermeier H. Phenylarsine oxide and hydrogen peroxide stimulate glucose transport via different pathways in isolated cardiac myocytes. Biochim Biophys Acta. 1993;1153:97–104. doi: 10.1016/0005-2736(93)90280-d. [DOI] [PubMed] [Google Scholar]
- Fryer LG, Parbu-Patel A, Carling D. The anti-diabetic drugs rosiglitazone and metformin stimulate AMP-activated protein kinase through distinct signaling pathways. J Biol Chem. 2002;277:25226–25232. doi: 10.1074/jbc.M202489200. [DOI] [PubMed] [Google Scholar]
- Ghezzi P. Regulation of protein function by glutathionylation. Free Radic Res. 2005;39:573–580. doi: 10.1080/10715760500072172. [DOI] [PubMed] [Google Scholar]
- Goldstein BJ, Mahadev K, Wu X. Redox paradox: insulin action is facilitated by insulin-stimulated reactive oxygen species with multiple potential signaling targets. Diabetes. 2005;54:311–321. doi: 10.2337/diabetes.54.2.311. [DOI] [PMC free article] [PubMed] [Google Scholar]
- Hancock CR, Janssen E, Terjung RL. Contraction-mediated phosphorylation of AMPK is lower in skeletal muscle of adenylate kinase-deficient mice. J Appl Physiol. 2006;100:406–413. doi: 10.1152/japplphysiol.00885.2005. [DOI] [PubMed] [Google Scholar]
- Hayashi T, Hirshman MF, Kurth EJ, Winder WW, Goodyear LJ. Evidence for 5′-AMP-activated protein kinase mediation of the effect of muscle contraction on glucose transport. Diabetes. 1998;47:1369–1373. doi: 10.2337/diab.47.8.1369. [DOI] [PubMed] [Google Scholar]
- Higaki Y, Hirshman MF, Fujii N, Goodyear LJ. Nitric oxide increases glucose uptake through a mechanism that is distinct from the insulin and contraction pathways in rat skeletal muscle. Diabetes. 2001;50:241–247. doi: 10.2337/diabetes.50.2.241. [DOI] [PubMed] [Google Scholar]
- Holloszy JO. A forty-year memoir of research on the regulation of glucose transport into muscle. Am J Physiol Endocrinol Metab. 2003;284:E453–E467. doi: 10.1152/ajpendo.00463.2002. [DOI] [PubMed] [Google Scholar]
- Houstis N, Rosen ED, Lander ES. Reactive oxygen species have a causal role in multiple forms of insulin resistance. Nature. 2006;440:944–948. doi: 10.1038/nature04634. [DOI] [PubMed] [Google Scholar]
- Jessen N, Goodyear LJ. Contraction signaling to glucose transport in skeletal muscle. J Appl Physiol. 2005;99:330–337. doi: 10.1152/japplphysiol.00175.2005. [DOI] [PubMed] [Google Scholar]
- Jorgensen SB, Viollet B, Andreelli F, Frosig C, Birk JB, Schjerling P, Vaulont S, Richter EA, Wojtaszewski JF. Knockout of the α2 but not α1 5′-AMP-activated protein kinase isoform abolishes 5-aminoimidazole-4-carboxamide-1-beta-4-ribofuranoside- but not contraction-induced glucose uptake in skeletal muscle. J Biol Chem. 2004;279:1070–1079. doi: 10.1074/jbc.M306205200. [DOI] [PubMed] [Google Scholar]
- Kurth-Kraczek EJ, Hirshman MF, Goodyear LJ, Winder WW. 5′-AMP-activated protein kinase activation causes GLUT4 translocation in skeletal muscle. Diabetes. 1999;48:1667–1671. doi: 10.2337/diabetes.48.8.1667. [DOI] [PubMed] [Google Scholar]
- Leon H, Atkinson LL, Sawicka J, Strynadka K, Lopaschuk GD, Schulz R. Pyruvate prevents cardiac dysfunction and AMP-activated protein kinase activation by hydrogen peroxide in isolated rat hearts. Can J Physiol Pharmacol. 2004;82:409–416. doi: 10.1139/y04-050. [DOI] [PubMed] [Google Scholar]
- Livingston JN, Gurny PA, Lockwood DH. Insulin-like effects of polyamines in fat cells. Mediation by H2O2 formation. J Biol Chem. 1977;252:560–562. [PubMed] [Google Scholar]
- Lund S, Holman GD, Schmitz O, Pedersen O. Contraction stimulates translocation of glucose transporter GLUT4 in skeletal muscle through a mechanism distinct from that of insulin. Proc Natl Acad Sci U S A. 1995;92:5817–5821. doi: 10.1073/pnas.92.13.5817. [DOI] [PMC free article] [PubMed] [Google Scholar]
- Mu J, Brozinick JT, Jr, Valladares O, Bucan M, Birnbaum MJ. A role for AMP-activated protein kinase in contraction- and hypoxia-regulated glucose transport in skeletal muscle. Mol Cell. 2001;7:1085–1094. doi: 10.1016/s1097-2765(01)00251-9. [DOI] [PubMed] [Google Scholar]
- Mueckler M. Facilitative glucose transporters. Eur J Biochem. 1994;219:713–725. doi: 10.1111/j.1432-1033.1994.tb18550.x. [DOI] [PubMed] [Google Scholar]
- Murrant CL, Reid MB. Detection of reactive oxygen and reactive nitrogen species in skeletal muscle. Microsc Res Tech. 2001;55:236–248. doi: 10.1002/jemt.1173. [DOI] [PubMed] [Google Scholar]
- Nagata D, Takeda R, Sata M, Satonaka H, Suzuki E, Nagano T, Hirata Y. AMP-activated protein kinase inhibits angiotensin II-stimulated vascular smooth muscle cell proliferation. Circulation. 2004;110:444–451. doi: 10.1161/01.CIR.0000136025.96811.76. [DOI] [PubMed] [Google Scholar]
- Park SH, Gammon SR, Knippers JD, Paulsen SR, Rubink DS, Winder WW. Phosphorylation-activity relationships of AMPK and acetyl-CoA carboxylase in muscle. J Appl Physiol. 2002;92:2475–2482. doi: 10.1152/japplphysiol.00071.2002. [DOI] [PubMed] [Google Scholar]
- Ponticos M, Lu QL, Morgan JE, Hardie DG, Partridge TA, Carling D. Dual regulation of the AMP-activated protein kinase provides a novel mechanism for the control of creatine kinase in skeletal muscle. EMBO J. 1998;17:1688–1699. doi: 10.1093/emboj/17.6.1688. [DOI] [PMC free article] [PubMed] [Google Scholar]
- Quintero M, Colombo SL, Godfrey A, Moncada S. Mitochondria as signaling organelles in the vascular endothelium. Proc Natl Acad Sci U S A. 2006;103:5379–5384. doi: 10.1073/pnas.0601026103. [DOI] [PMC free article] [PubMed] [Google Scholar]
- Reid MB, Haack KE, Franchek KM, Valberg PA, Kobzik L, West MS. Reactive oxygen in skeletal muscle. I. Intracellular oxidant kinetics and fatigue in vitro. J Appl Physiol. 1992;73:1797–1804. doi: 10.1152/jappl.1992.73.5.1797. [DOI] [PubMed] [Google Scholar]
- Roberts CK, Barnard RJ, Scheck SH, Balon TW. Exercise-stimulated glucose transport in skeletal muscle is nitric oxide dependent. Am J Physiol. 1997;273:E220–E225. doi: 10.1152/ajpendo.1997.273.1.E220. [DOI] [PubMed] [Google Scholar]
- Rose AJ, Richter EA. Skeletal muscle glucose uptake during exercise: how is it regulated? Physiology. 2005;20:260–270. doi: 10.1152/physiol.00012.2005. [DOI] [PubMed] [Google Scholar]
- Sakamoto K, McCarthy A, Smith D, Green KA, Grahame HD, Ashworth A, Alessi DR. Deficiency of LKB1 in skeletal muscle prevents AMPK activation and glucose uptake during contraction. EMBO J. 2005;24:1810–1820. doi: 10.1038/sj.emboj.7600667. [DOI] [PMC free article] [PubMed] [Google Scholar]
- Sandström ME, Abbate F, Andersson DC, Zhang SJ, Westerblad H, Katz A. Insulin-independent glycogen supercompensation in isolated mouse skeletal muscle: role of phosphorylase inactivation. Pflugers Arch. 2004;448:533–538. doi: 10.1007/s00424-004-1280-7. [DOI] [PubMed] [Google Scholar]
- Shashkin PN, Koshkin A, Langley DR, Ren J-M, Westerblad H, Katz A. Effects of CGS 9343B (a putative calmodulin antagonist) on isolated skeletal muscle: dissociation of signaling pathways for insulin-mediated activation of glycogen synthase and hexose transport. J Biol Chem. 1995;270:25613–25618. doi: 10.1074/jbc.270.43.25613. [DOI] [PubMed] [Google Scholar]
- Silva JP, Shabalina IG, Dufour E, Petrovic N, Backlund EC, Hultenby K, Wibom R, Nedergaard J, Cannon B, Larsson NG. SOD2 overexpression: enhanced mitochondrial tolerance but absence of effect on UCP activity. EMBO J. 2005;24:4061–4070. doi: 10.1038/sj.emboj.7600866. [DOI] [PMC free article] [PubMed] [Google Scholar]
- Toyoda T, Hayashi T, Miyamoto L, Yonemitsu S, Nakano M, Tanaka S, Ebihara K, Masuzaki H, Hosoda K, Inoue G, Otaka A, Sato K, Fushiki T, Nakao K. Possible involvement of the alpha1 isoform of 5′AMP-activated protein kinase in oxidative stress-stimulated glucose transport in skeletal muscle. Am J Physiol Endocrinol Metab. 2004;287:E166–E173. doi: 10.1152/ajpendo.00487.2003. [DOI] [PubMed] [Google Scholar]
- Winder WW, Hardie DG. Inactivation of acetyl-CoA carboxylase and activation of AMP-activated protein kinase in muscle during exercise. Am J Physiol. 1996;270:E299–E304. doi: 10.1152/ajpendo.1996.270.2.E299. [DOI] [PubMed] [Google Scholar]
- Winder WW, Hardie DG. AMP-activated protein kinase, a metabolic master switch: possible roles in type 2 diabetes. Am J Physiol. 1999;277:E1–E10. doi: 10.1152/ajpendo.1999.277.1.E1. [DOI] [PubMed] [Google Scholar]
- Wojtaszewski JF, Laustsen JL, Derave W, Richter EA. Hypoxia and contractions do not utilize the same signaling mechanism in stimulating skeletal muscle glucose transport. Biochim Biophys Acta. 1998;1380:396–404. doi: 10.1016/s0304-4165(98)00011-7. [DOI] [PubMed] [Google Scholar]
- Woods A, Johnstone SR, Dickerson K, Leiper FC, Fryer LG, Neumann D, Schlattner U, Wallimann T, Carlson M, Carling D. LKB1 is the upstream kinase in the AMP-activated protein kinase cascade. Curr Biol. 2003;13:2004–2008. doi: 10.1016/j.cub.2003.10.031. [DOI] [PubMed] [Google Scholar]
- Wright VP, Klawitter PF, Iscru DF, Merola AJ, Clanton TL. Superoxide scavengers augment contractile but not energetic responses to hypoxia in rat diaphragm. J Appl Physiol. 2005;98:1753–1760. doi: 10.1152/japplphysiol.01022.2004. [DOI] [PubMed] [Google Scholar]
- Xie Z, Kometiani P, Liu J, Li J, Shapiro JI, Askari A. Intracellular reactive oxygen species mediate the linkage of Na+/K+-ATPase to hypertrophy and its marker genes in cardiac myocytes. J Biol Chem. 1999;274:19323–19328. doi: 10.1074/jbc.274.27.19323. [DOI] [PubMed] [Google Scholar]
- Young ME, Radda GK, Leighton B. Activation of glycogen phosphorylase and glycogenolysis in rat skeletal muscle by AICAR – an activator of AMP-activated protein kinase. FEBS Lett. 1996;382:43–47. doi: 10.1016/0014-5793(96)00129-9. [DOI] [PubMed] [Google Scholar]
- Zhang SJ, Bruton JD, Katz A, Westerblad H. Limited oxygen diffusion accelerates fatigue development in mouse skeletal muscle. J Physiol. 2006;572:551–559. doi: 10.1113/jphysiol.2005.104521. [DOI] [PMC free article] [PubMed] [Google Scholar]
- Zuo L, Clanton TL. Reactive oxygen species formation in the transition to hypoxia in skeletal muscle. Am J Physiol Cell Physiol. 2005;289:C207–C216. doi: 10.1152/ajpcell.00449.2004. [DOI] [PubMed] [Google Scholar]


