

Abstract
To examine the dark adaptation of human rod bipolar cells in vivo, we recorded ganzfeld ERGs to (a) a family of flashes of increasing intensity, (b) dim test flashes presented on a range of background intensities, and (c) dim test flashes presented before, and up to 40 min after, exposure to intense illumination eliciting bleaches from a few per cent to near total. The dim flash ERG was characterized by a prominent b-wave response generated principally by rod bipolar cells. In the presence of background illumination the response reached peak earlier and desensitized according to Weber's Law. Following bleaching exposures, the response was initially greatly desensitized, but thereafter recovered slowly with time. For small bleaches, the desensitization was accompanied by acceleration, in much the same way as for real light. Following a near-total bleach, the response was unrecordable for >10 min, but after ∼23 min half-maximal sensitivity was reached, and full sensitivity was restored between ∼35 and 40 min. With smaller bleaches, recovery commenced earlier. We converted the post-bleach measurements of desensitization into ‘equivalent background intensities’ using a Crawford transformation. Across the range of bleaching levels, the results were described by a prominent ‘S2’ component (0.24 decades min−1) together with a smaller and slower ‘S3’ component (0.06 decades min−1), as is found for dark adaptation of the scotopic visual system. We attribute the S2 component to the presence of unregenerated opsin, and we speculate that the S3 component results from ion channel closure by all-trans retinal.
Night vision (scotopic vision) is mediated by two distinct pathways from rods to retinal ganglion cells that operate at different light intensities. At higher scotopic levels, rod signals are electrically coupled via gap junctions to cones, and then follow the conventional photopic pathway via cone ON and OFF bipolar cells to ganglion cells. But at low scotopic intensities a separate pathway comes into play, capable of transmitting single photon responses. The rods synapse onto rod bipolar cells, which are functionally similar to cone ON bipolar cells in that they generate a sign-inverting response through the action of a metabotropic glutamate receptor (mGluR6) and a G-protein cascade. The rod bipolar cell signal is relayed via a sign-conserving synapse to AII amacrine cells, and thence into the cone pathway via both ON and OFF cone bipolar cells. For reviews of these pathways, see Bloomfield & Dacheux (2001) and Wässle (2004).
Scotopic vision is extraordinarily sensitive, and a fully dark-adapted human subject is capable of detecting as few as 5–10 photon absorptions occurring within a short time interval anywhere over a ‘pool’ of around 10 000 rods, corresponding to about 1 deg of visual angle (Hecht et al. 1942; Sakitt, 1972). However, this sensitivity can be reduced, either by the presence of steady illumination (light adaptation), or during recovery from an intense bleaching exposure (dark adaptation). It has long been recognized that the cellular site(s) of such adaptation are, to a substantial extent, post-receptoral in the scotopic visual system (Rushton, 1965). Our main aim in this study was to investigate adaptational changes occurring within rod bipolar cells of the human retina during dark adaptation.
Under scotopic conditions, the b-wave of the electroretinogram (ERG) primarily reflects the activity of rod bipolar cells (reviewed by Pugh et al. 1998; and Robson & Frishman, 1999). Additional smaller signals are contributed by photoreceptors (manifest at higher intensities as the a-wave) and by inner retinal neurons (producing the scotopic threshold response, STR). As a result it is fairly straightforward to obtain an estimate of the rod bipolar cell response by measuring the scotopic b-wave when the STR is minimized, for example by application of an extremely dim background (Frishman et al. 1996a), and after subtraction of an estimate of the photoreceptor response (see Hood & Birch, 1992, 1996; Robson et al. 2004).
Dark adaptation of the human b-wave response has been investigated in only a handful of studies. Adrian (1945) showed that the b-wave was reduced substantially after a bleach, and that it recovered slowly with time. Subsequent investigations by Karpe & Tansley (1948) and by Fulton & Rushton (1978) found that after a large bleach, the amplitude of the b-wave recovered with a time course corresponding closely to the recovery of visual threshold, measured psychophysically (though some differences were reported by Johnson & Riggs, 1951). But, as far as we are aware, there have been no previous studies of dark adaptation across a range of bleaching strengths for human rod bipolar cell responses or the b-wave.
Accordingly, in this study we have measured the recovery of the scotopic b-wave following exposures eliciting bleaches of a range of magnitudes. In order to be able to convert our results into ‘equivalent background intensities’ (Crawford, 1947) we have also measured desensitization of the b-wave by steady background illumination (Frishman & Sieving, 1995; Frishman et al. 1996a; Naarendorp et al. 2001; Saszik et al. 2002).
We find that the recovery of rod bipolar cell sensitivity shows clear parallels with the recovery of visual sensitivity measured psychophysically, and furthermore that recovery following small bleaches appears to be explicable in terms of the fading of an equivalent background light. A preliminary account of our results has been presented by Cameron et al. (2005).
Methods
The ERG b-wave was recorded in response to ganzfeld stimulation with dim blue flashes, under fully dark-adapted conditions, during adaptation to steady backgrounds, or during dark adaptation recovery following intense bleaching exposures. Ethical approval for the study was obtained from the Australian National University's Human Research Ethics Committee, and the work was conducted in accordance with the tenets of the Declaration of Helsinki. The subjects were the three authors, who had normal vision apart from minor errors of refraction, and from whom informed written consent was obtained.
ERG recording, and control and analysis of experiments
The ERG was recorded using a conductive fibre electrode (DTL; UniMed Electrode Supplies, Farnham, Surrey, UK) placed loosely in the lower fornix of one eye. Reference and ground electrodes were self-adhesive skin electrodes (N6008-1; Oxford Instruments, Woking, UK) positioned on the temple and forehead. Signals were amplified ×10 000 by an optically isolated preamplifier (CED 1902; Cambridge Electronic Design, Cambridge, UK), with AC coupling (1 s time constant, corresponding to 0.16 Hz high-pass filter), and with low-pass filter set at either 500 Hz (for b-wave recordings) or 1000 Hz (for a-wave recordings).
Stimulus delivery and data acquisition were controlled by a custom program MatERG, written by Mr Liang Miao, which ran under Matlab (The MathWorks, Inc.). Command pulse outputs were updated at 200 kHz and analog sampling was performed at 5 kHz, both at 12-bit resolution (PCI-6040E; National Instruments). Subsequent analysis of records was performed off-line using the same program, and with artefact rejection determined by the criteria of Paupoo et al. (2000).
The pupil of the subject's test eye was dilated using two drops of 1% tropicamide (and on occasion also one drop of 2.5% phenylephrine); in long recording sessions a further drop of tropicamide was applied after ∼90 min. The pupil diameter was monitored continuously under infrared illumination, and was recorded on video tape. After exposure to room lighting, the subject was dark adapted for at least 25 min prior to commencement of experiments.
Ganzfeld and illumination
The subject viewed the interior of a ganzfeld sphere (370 mm in diameter, and painted with high-reflectance BaSO4 coating; Dulux) through a binocular port. A video image of the test eye was obtained with an infra-red-sensitive CCD camera (Watec 902H), fitted with a 75 mm lens (Pentax B75-14C) positioned behind a 10 mm aperture opposite the subject, and using 880 nm illumination from an LED (TLN201; Toshiba). The subject fixated a red LED placed on the centre-line, a few degrees below the horizontal.
Illumination (for test flashes, background lights, and bleaching lights) was delivered using LEDs, except in the case of bright flashes (see below). Light intensities were measured with a calibrated photometer (IL-1700; International Light, Newburyport, MA, USA) fitted with a radiometric barrel and either scotopic (Z-CIE) or photopic (Y) filters. Intensities were measured in units of cd m−2 (for steady illumination) and in cd m−2 s (for flashes), and these have been converted to Td and Td s through multiplication by the pupil area in mm2. Unless otherwise stated, the intensities reported in this paper are in scotopic units.
In most cases, test flashes were produced by a blue LED (470 nm, LXHL-MBID, Luxeon 1 W; Lumileds, San Jose, CA, USA). The flash output was varied by controlling both the current (between 3 and 300 mA) and the pulse duration (up to ∼500 μs, in 5 μs steps). At 300 mA current, the steady output was typically 920 cd m−2, so that a realistic upper limit to the intensity of the blue LED flashes was ∼0.5 cd m−2 s (corresponding to ∼20 Td s). In the present study, the blue LED was used to produce flash intensities within the scotopic range, and so the maximum intensity actually delivered was 2.4 Td s (equal to 0.18 photopic Td s).
Brighter flashes, required for a-wave measurements, were produced by a xenon flash gun (Mecablitz 60CT4; Metz, Zirndorf, Germany) that utilized electronic control of flash duration (Smith & Lamb, 1997). Its light passed through a heat filter, ultra-violet filter, prismatic diffuser, and a blue glass filter (BG28, 2 mm thick, Schott AG, Mainz, Germany) which transmitted maximally at 450 nm.
Dim blue backgrounds were delivered by a separate blue LED (470 nm, HLMP-CB31, Agilent Technologies) driven by digital pulses of adjustable duty cycle and fixed current (20 mA). The pulse repetition rate was 50 Hz, and the pulse width could be varied from as long as 10 ms (giving ∼5 cd m−2) to shorter than 1 μs (calculated to deliver ∼5 × 10⁻⁴ cd m−2).
Bleaching lights were produced by a bank of 12 ultra-bright ‘white’ LEDs (six LXHL-LW6C Luxeon 5 W, and six LXHL-LW3C Luxeon 3 W, Lumileds). These emitters use a blue LED with a phosphor, and exhibit a spectral peak near 455 nm together with a very broad peak near 570 nm; they have a quoted colour temperature of 5500 K. The maximum intensity available was 17 000 cd m−2, and the actual intensity could be adjusted by varying the number of LEDs illuminated and by changing the level of the LED supply current (range 30–1000 mA).
Dim flash protocol
Families of scotopic b-wave responses were recorded for a range of flash intensities, both under dark-adapted conditions and in the presence of a very dim background (∼0.015 Td). Light adaptation and dark adaptation were monitored either with flashes adjusted to produce a criterion response, or at one of two fixed intensities (see Results). A minimum of 16 responses were recorded for each condition (i.e. for each flash intensity, background, or post-bleach interval), and these raw responses were averaged and digitally low-pass filtered at 30 Hz. Amplitude measurements were generally made at the response peak, and plotted error bars represent ± 1 s.e.m. The light adaptation experiments included 30 s of pre-exposure to each background, before data collection commenced. This period appeared sufficient to induce an approximately steady state of adaptation (see Results). During dark adaptation experiments, pre-bleach responses were recorded for ≥ 5 min prior to bleach onset. Bleaching exposures lasted 10–20 s (or 30–60 s for the full bleach) and subsequent post-bleach recoveries were monitored for up to 40 min. Pre- and post-bleach responses were averaged over 1 min intervals. Since the amplitude of the post-bleach response was continuously changing (at least until late times in the recovery) these post-bleach measurements represent the average level of adaptation per 1 min interval. Longer averaging windows of 5–10 min were used to calculate the mean amplitude of pre-bleach and fully recovered responses.
Paired-flash protocol
To estimate the contribution of rod photoreceptor activity to the b-wave, we used the paired-flash technique of Pepperberg et al. (1997) as described in Hetling & Pepperberg (1999) (see also Friedburg et al. 2001). A bright (7000 Td s) blue probe flash was delivered using the xenon flash gun, at one of a range of separation times tsep after the test flash; we denote this response as rtest+probe(t, tsep). From this response we subtracted the response to the test flash alone, rtest(t), and measured the resulting response amplitude at a fixed measurement time, of tmeas= 7 ms (just prior to the peak of the a-wave), to give a measure of the remaining rod photoreceptor circulating current at this time. To obtain the amplitude of the rod photoreceptor response, rod(t), we subtracted the above response amplitude from the ‘probe flash alone’ response amplitude, rprobe(t) (i.e. the rod current in darkness). Thus, the symbols in Fig. 3B plot
at discrete times given by tsep+tmeas; for further details, see Fig. 5 of Friedburg et al. (2001).
Figure 3. Estimation of underlying rod photoreceptor activity using the paired flash method and extraction of rod bipolar cell responses.

A, the continuous trace is the ERG recorded in response to a flash of 2.4 Td s from Fig. 1A; it is characterized by a prominent corneal-positive b-wave, preceded (at this intensity) by a small corneal-negative a-wave component. B, the symbols plot our estimates of the underlying rod photoreceptor contribution to this response, derived from paired-flash experiments. The test flash of Q = 2.4 Td s was followed by a probe flash of 7000 Td s, at one of six intervals, and the response was measured at a fixed time of 7 ms after the probe flash. Responses were averaged from 24 to 30 presentations at each separation, and an interval of at least 30 s was left between repetitions to allow full recovery. The symbols plot rod(t), the reduction in amplitude of response to the probe flash, compared with probe flash alone, as given in eqn (1) of Methods; for further details, see Friedburg et al. (2001). The paired-flash measurements were fitted with a theoretical expression to describe the time course of the rod photoreceptor response given as eqns (6) and (7a) in Friedburg et al. (2001), with activation parameters K = 8.6 photoisomerizations (Td s)−1, A = 5.2 s−2 photoisomerization−1, and td= 3 ms, and with inactivation parameters τrec= 70 ms, n = 8, and t0= 84 ms. Based on this description of the rod response to the 2.4 Td s flash, it was possible to extrapolate the predicted rod photoreceptor response to any dimmer flash by substituting the intensity Q. The curves in B plot predicted rod responses to the five brightest flash intensities used in Fig. 1A. C, family of deduced rod bipolar cell responses, obtained by subtraction of the estimated rod responses from the ERG traces in Fig. 1A; see Fig. 1 legend for flash intensities. Subject, A.M.C.
Estimation of bleaching level
In the case of a very short bleaching exposure, when regeneration of rhodopsin can be ignored, the relation between quantity of light, Q, and fraction of rhodopsin bleached, B, is an exponential saturation, characterized by a ‘bleaching constant’, Qe, which is the quantity of light required to reduce the pigment level to 1/e of its initial level. For an exposure of finite duration, the calculation of fraction bleached depends on one's assumption about the kinetics of rhodopsin's regeneration. If regeneration is assumed to follow first-order kinetics (so that rhodopsin regenerates with an exponential time course), then the fraction bleached can be calculated according to eqn (2a) of Hollins & Alpern (1973), given more recently as eqn (4) of Thomas & Lamb (1999). However, it has recently been shown by Mahroo & Lamb (2004) and Lamb & Pugh (2004) that the regeneration of visual pigment does not in fact follow first-order kinetics, but instead that it follows rate-limited kinetics. In this case the calculation of bleaching level is more complicated, but the appropriate expressions have been developed by Mahroo & Lamb (2004) (see their p. 435; and eqn (7) in Results).
Somewhat paradoxically, it is easier, in the case of steady illumination, to calculate the time taken to reach a specified bleaching level than to calculate the bleach level after a specified time. For illumination at intensity I, with rate-limited regeneration of pigment (with maximal rate v and semi-saturation constant Km), the time t required to attain a fractional pigment content P (from an initial pigment content P0) is given by eqn (A12) of Mahroo & Lamb (2004). Therefore, our approach was to invert their eqn (A12) numerically (starting from P0= 1), to yield P as a function of t, and hence the fraction bleached B = 1 −P.
Mahroo & Lamb's (2004) formulation incorporates a photosensitivity parameter σ for calculating bleaches, equal to the reciprocal of the bleaching constant Qe (i.e. σ= 1/Qe). The value of Qe for rhodopsin is usually taken to be in the range of 106.7–107 Td s (Ripps & Weale, 1969; Rushton & Powell, 1972; Alpern & Pugh, 1974), based on measurements from the parafovea. However, as noted by Thomas & Lamb (1999), during ganzfeld conditions (in which bleaches are delivered to the whole retina), it is necessary to account for peripheral rods, which have larger inner segments (and hence greater capacity for light collection) than the parafoveal rods. As a consequence, the Qe for full-field bleaches is likely to fall towards the lower end of the reported range. We therefore chose a Qe of 106.8 Td s, similar to the value used by Thomas & Lamb (1999) in their Fig. 10B. For the pigment regeneration parameters, we used the standard values of v = 0.085 min−1 and Km= 0.2 for the limiting rate and the semi-saturation constant (Mahroo & Lamb, 2004).
Results
Scotopic b-wave family, and extraction of rod bipolar cell responses
The b-wave of the scotopic ERG reflects primarily the activity of rod bipolar cells, but also inevitably contains activity arising both from rod photoreceptors (e.g. the a-wave) and from more proximal cells; for reviews see Pugh et al. (1998) and Robson & Frishman (1999). The proximal response occurs at extremely low intensities, and has been termed the scotopic threshold response (STR); reviewed in Steinberg et al. (1991). Recently the STR has been subdivided into at least two components, a negative-going nSTR and a positive-going pSTR (Frishman et al. 1996a; Naarendorp et al. 2001), both of which saturate at extremely low intensities.
Therefore, we begin by examining general features of the b-wave, in order to establish a procedure for extracting the rod bipolar cell activity and/or estimating the extent of intrusion by other signals. The response waveforms from our three subjects were qualitatively very similar, and so to simplify comparison of responses across experimental conditions, we have chosen to illustrate waveforms from just one subject (A.M.C.) throughout the paper. In subsequent sections on light adaptation and dark adaptation recovery of the b-wave, we present quantitative measurements of b-wave amplitude from all three subjects.
Family of responses
Figure 1A shows a family of scotopic b-wave responses to dim blue flashes of nine intensities (from 0.003 to 2.4 Td s) recorded in the presence of a very dim blue background (∼0.015 Td), in our representative subject. The dim steady background was applied in order to minimize the contribution of the nSTR component, as will be explained shortly.
Figure 1. Scotopic b-wave responses to flashes of increasing intensity.

A, family of scotopic b-wave responses to dim blue flashes of nine intensities, delivered on a very dim blue background (0.015 Td), for representative subject A.M.C. Responses are averaged from three repetitions of the experiment conducted on separate days. Each trace is averaged from between 126 and 237 flash presentations, and on different days the amplitude scaling varied by less than 10%. The flash intensity differed slightly on the 3 days, due to small variations in the diameter of the dilated pupil; the averaged flash intensities were: 0.0027, 0.0054, 0.011, 0.022, 0.043, 0.097, 0.23, 0.69 and 2.4 Td s. Arrows indicate the two standard flash intensities used in subsequent experiments on light adaptation and dark adaptation. The interflash interval was 1 s for the seven dimmest flashes, and 2 s for the two brightest intensities. B, the average amplitudes of the b-wave responses, measured as indicated by the circles in A (see text), have been plotted against flash intensity. The continuous curve shows the Naka-Rushton hyperbolic saturation function, eqn (2), with rmax = 90 μV and Q0 = 0.075 Td s; the grey line shows its linear asymptote at low intensities.
Choice of measurement time
To determine the amplitude of the b-wave response we measured at a fixed time of 120 ms for the five lowest intensities, and at the peak for higher intensities. Our rationale for using a fixed measurement time with the very dimmest flashes stems from our observation of what appears to be another, slightly earlier, positive component. This is barely detectable in the traces of Fig. 1A at the two lowest intensities (see also magnified traces in Fig. 2B), but was more prominent in recordings from another subject. The timing of this putative second component (at ∼90–100 ms), its transient nature, and its emergence at very dim flash intensities, leads us to suspect that this component is the positive scotopic threshold response (pSTR), a response of inner retinal origin first described by Frishman et al. (1996b) in the macaque eye. Dim background illumination has been shown to reduce the pSTR (Frishman et al. 1996b; Naarendorp et al. 2001), while intravitreal injection of NMDA has been found to totally remove it (Naarendorp et al. 2001), leaving a set of dim flash b-wave responses with a common time-to-peak. Our tentative interpretation is that by measuring the smaller responses at a fixed time of 120 ms, when the transient pSTR should have substantially decayed, we will obtain b-wave measurements with minimal interference from the pSTR.
Figure 2. ERG responses obtained during dark-adapted conditions and in the presence of a very dim background.

Families of b-wave responses to the five dimmest flash intensities from Fig. 1, for subject A.M.C., in a single experimental session. A, in dark-adapted conditions; B, in the presence of a very dim background of 0.015 Td. The traces in B are comparable to the five smallest responses in Fig. 1A, but were obtained in a single session. Flashes delivered 0.0027, 0.0054, 0.011, 0.022 and 0.043 Td s. Each trace has been averaged from between 106 and 140 responses. C and D plot the response versus intensity relations for the traces in A and B. The curves are as follows: C, dotted curve is eqn (2) with rmax= 95 μV and Q0= 0.05 Td s; dashed curve is an exponential saturation, rmax (1 − exp(–Q/Q0)), with rmax=−5 μV and Q0= 0.002 Td s; continuous curve is the sum of the dotted and dashed curves. D, continuous curve is eqn (2) with rmax= 90 μV and Q0= 0.07 Td s.
Response versus intensity relation
The response amplitudes measured from Fig. 1A are plotted in Fig. 1B as a function of flash intensity. At the lowest intensities the response amplitude was roughly proportional to flash intensity (grey line), but saturation set in at higher intensities. The continuous curve near the symbols is the classic Naka-Rushton hyperbolic saturation function
where r is response amplitude and Q is flash intensity, with maximal response amplitude rmax= 90 μV and half-saturating flash intensity Q0= 0.075 Td s.
Contribution of the negative STR
To investigate the extent of nSTR contribution to the b-wave responses, we adopted the approach used by Frishman et al. (1996a), of measuring the amplitudes of the small-signal responses and attempting to decompose these into a ‘PII’ (rod bipolar cell) component and an ‘nSTR’ component. The responses to the five dimmest flash intensities (0.003–0.043 Td s) are plotted in the upper panels of Fig. 2, under dark-adapted conditions (Fig. 2A) and in the presence of the very dim background (Fig. 2B); both families were collected from the representative subject during a single experimental session.
The amplitudes of these responses are plotted against flash intensity in the lower panels of Fig. 2. In the presence of the dim background (Fig. 2D), the hyperbolic saturation function, eqn (1) again provided a good description with Q0= 0.07 Td s and rmax= 90 μV. In contrast, under fully dark-adapted conditions (Fig. 2C), the points rose more abruptly than could be described by a single hyperbolic saturation function (dotted curve). But, by adding a negative-going exponential saturation function representing the nSTR (Frishman et al. 1996a; dashed curve), we obtained a good fit to the results (continuous curve); in this case the hyperbolic saturation function used Q0= 0.05 Td s and rmax= 95 μV, while the exponential saturation function (specified in legend) used Q0= 0.002 Td s and rmax=−5 μV. The results of Fig. 2C and D are consistent with the notion that, at the rod bipolar cell time-to-peak of 120 ms, a background of 0.015 Td is sufficient to reduce the nSTR to an undetectable level, as reported by Frishman et al. (1996a).
Photoreceptor contribution
In order to estimate the photoreceptor contribution to the b-wave, we conducted a paired-flash experiment (Pepperberg et al. 1997; Cideciyan et al. 1998; Friedburg et al. 2001). In the experiment of Fig. 3, a test flash of fixed intensity, equal to the brightest intensity used in Fig. 1 (2.4 Td s), was followed by a bright ‘probe’ flash (7000 Td s) presented at a number of test-to-probe-flash intervals. The trace in Fig. 3A plots the ERG response to the test flash (this is identical to the largest response in Fig. 1A), while the symbols in Fig. 3B plot the corresponding rod photoreceptor contribution, estimated from the amplitude of the probe-flash response for six interflash intervals; for details, see Methods and Friedburg et al. (2001). The grey curve near these symbols plots the expression given by eqn (6a) of Friedburg et al. (2001), and provides a good description of the waveform. In order to obtain an estimate of the rod bipolar cell response, this curve (representing the rod response) should be subtracted from the ERG b-wave trace in Fig. 3A (see Fig. 3C); since this experiment was performed in the presence of a dim background of 0.015 Td, there is no need to allow for any contribution of the nSTR at times up until at least 120 ms after the flash.
Our estimates of the rod photoreceptor contribution to the ERG at the next four lower intensities used in Fig. 1A are shown by the remaining grey curves in Fig. 3B. These traces were calculated by substituting the relevant intensities into the same equation (eqn (6a) of Friedburg et al. 2001), using the same parameters as for the largest response (see legend). We have not plotted the estimated rod photoreceptor responses to the dimmest four intensities used in Fig. 1 because they were so small as to be indistinguishable from each other at this scale.
In Fig. 3C we have derived a family of ‘isolated’ rod bipolar cell responses, to the nine flash intensities, by individually subtracting the estimates of rod photoreceptor activity from the corresponding b-wave responses plotted in Fig. 1A. These derived responses exhibit a form that is remarkably similar to the families obtained from rod bipolar cells in other studies: intracellular recordings in dogfish retina (Ashmore & Falk, 1980); patch-clamp recordings in mouse (Berntson & Taylor, 2000; Euler & Masland, 2000; Field & Rieke, 2002; Berntson et al. 2004; Sampath & Rieke, 2004); and ERG recordings from human (Hood & Birch, 1996) and mouse (Robson et al. 2004).
This similarity is shown in Fig. 4, where we compare traces from this study with responses recorded in other recent studies. All responses were obtained at an intensity of roughly 1 photoisomerization per rod (R* rod−1), and all have been normalized to unit amplitude. The red traces plot our own recordings of the human scotopic b-wave response to a test flash of ∼0.12 Td s (∼1 R* rod−1) for the three subjects. To permit the closest equivalence to mouse b-waves, we have chosen not to subtract the estimated rod response, and so the trace for subject A.M.C. is taken directly from Fig. 1A (upper arrowed trace).
Figure 4. Comparison of rod bipolar cell responses estimated here, with those reported in the literature, for flashes of about 1 photoisomerization per rod.

The red traces plot the human scotopic b-wave response to flashes of about 0.12 Td s (range 0.1–0.14 Td s, or 0.9–1.2 R* rod−1), obtained in the present study for our three subjects; the traces (from left to right during the recovery phase) are for A.M.C., T.D.L. and O.A.R.M. The blue and black traces are published murine scotopic b-wave responses from Fig. 3 of Robson et al. (2004); data kindly provided by Dr J. G. Robson. Blue traces plot GABA-isolated scotopic b wave responses obtained from four wild-type mice (∼1–1.2 R* rod−1), while black trace plots the scotopic b-wave response from a connexin36 knockout mouse with optic nerve crush (∼1 R* rod−1). The grey traces plot whole-cell patch-clamp recordings of murine rod bipolar cell responses. The thick grey trace shows the response averaged from 10 cells (∼1 R* rod−1) as recorded by Field & Rieke (2002); data kindly provided by Dr F. Rieke. The thin grey trace shows a single response from one cell (∼0.9 R* rod−1) from Fig. 6A of Berntson et al. (2004); data kindly provided by Dr W. R. Taylor. All traces have been normalized to unit peak amplitude.
The mouse b-wave responses (to flashes of ∼1–1.2 R* rod−1) are from Fig. 3 of Robson et al. (2004), and were kindly provided by Dr J. G. Robson. The four blue traces were each recorded from a wild-type mouse after intravitreal injection of GABA to remove all contributions to the ERG from the inner retina. The black trace was obtained from a connexin36 knockout mouse with optic nerve crush, in which the ganglion cells had degenerated. In this animal, the absence of functional connexin36 gap junctions prevented rod-driven cone bipolar cell activity, and hence only the scotopic rod pathway (i.e. rods–rod bipolar cells–AII amacrine cells) contributed to the response.
The close correspondence between the human scotopic b-wave, the ERG responses of GABA-treated mice, and the ERG response of the connexin36 knockout mouse with optic nerve crush suggests that all three sets of responses originate mainly from rod bipolar cells. Although photoreceptor activity has not been removed from these traces, its influence at this intensity (∼1 R* rod−1) is likely to be small (∼5% of the human response, see second curve from the top of Fig. 3B).
The thicker grey trace shows the average response of 10 rod bipolar cells to flashes of ∼1 R* rod−1 measured using the whole-cell patch-clamp technique from the retinal slice preparation, as described by Field & Rieke (2002), and kindly made available by Dr F. Rieke. The thinner grey trace is a sample response from one rod bipolar cell to a single flash of ∼0.9 R* rod−1, again measured using the whole-cell patch-clamp technique, as shown in Fig. 6A of Berntson et al. (2004), and kindly made available by Dr W. R. Taylor.
The rising phase of the in vivo b-wave responses are very similar for human and mouse, with the exception of the trace for one mouse, which rose with a slight delay and peaked later than the other ERG responses. The in vitro rod bipolar cell patch-clamp responses are slightly slower than most of the ERG responses, although not dissimilar to the slowest mouse ERG response. This slight discrepancy may reflect a genuine difference between in vivo and in vitro conditions.
Light adaptation of the scotopic b-wave
In order to estimate rod bipolar cell sensitivity during light adaptation or dark adaptation, we used two approaches. In the conventional approach, we adjusted the flash intensity to elicit a response of roughly a criterion amplitude (∼10 μV, within the linear range; see Fig. 1B), while in the second approach we used flashes of fixed intensity (0.1 or 0.02 Td s; see arrowed traces in Fig. 1A). In each case we calculated the sensitivity as the response amplitude (measured at the peak) divided by the test flash intensity, and in each case we normalized the sensitivity to the dark-adapted level. The criterion amplitude approach was readily applicable under the stationary conditions of light adaptation, but was difficult to use during post-bleach recovery when sensitivity was continually changing; hence we used flashes of fixed intensity to monitor dark adaptation.
Light adaptation families for flashes of fixed intensity
The fixed-intensity approach is illustrated in Fig. 5 for our representative subject. Figure 5A presents a family of responses to the brighter intensity (0.1 Td s), while Fig. 5B presents a similar family for the dimmer intensity (0.02 Td s) under dark-adapted conditions (black tRaces) and on backgrounds of progressively greater intensity (coloured traces). As is characteristic of light adaptation, the responses in both panels were reduced and accelerated as the intensity of the background illumination increased.
Figure 5. Light adaptation of scotopic b-wave flash responses.

Traces plot b-wave responses to test flashes of a fixed intensity under dark-adapted conditions (black traces), and in the presence of backgrounds of increasing intensity (coloured traces), for subject A.M.C. A, test flash intensity 0.1 Td s; background intensities 0, 0.014, 0.041, 0.14, 0.41, 1.4, 4.1 and 14 Td. B, test flash intensity 0.02 Td s; background intensities 0, 0.016, 0.048, 0.16, 0.48, 1.6 and 4.8 Td.
To examine whether the responses that we recorded during background illumination were changing with time or were approximately steady state, we compared responses elicited at early and later times during the backgrounds. For each background, we calculated the average responses to the first 6–10 flashes and to the final 6–10 flashes. The mid-points of these groups were separated by a minimum of 20 s. For a total of 28 background presentations (the seven illustrated in Fig. 5A and another 21 obtained in three further repetitions of the experiment on the same subject), the ratio of ‘later’ response to ‘early’ response was 0.96 ± 0.02 (mean ±s.e.m., n = 28). For comparison, when the same procedure was applied to the dark-adapted responses of the same four experiments, the ratio was 0.95 ± 0.01 (mean ±s.e.m., n = 4). For the experiment in Fig. 5B, the interval between later and earlier responses was longer, at ∼2 min, and the ratio of amplitudes (for all backgrounds except the brightest) was 0.92 ± 0.10 (mean ±s.e.m., n = 5). These results show that the response amplitude changed little during the experiments, and suggest that the period of 30 s pre-exposure to the backgrounds was sufficient to achieve approximately steady-state adaptation in the rod bipolar cells.
When compared with light-adapted traces, the dark-adapted responses shown in the panels of Fig. 5 (black traces) each exhibit an early negative deflection prior to the rise of the b-wave. Just as in Fig. 2, we interpret this result to indicate that the responses obtained in fully dark-adapted conditions contain a component of nSTR. Since the dimmest background (0.015 Td) appeared to substantially remove the early component of negativity (both in Fig. 2 and in Fig. 5), while only slightly reducing the rod bipolar cell sensitivity, we chose to apply this background continuously in all our subsequent dark-adaptation experiments. We show later a procedure for correcting for its slight desensitizing effect.
Sensitivity versus background intensity
Our collected estimates of rod bipolar cell sensitivity as a function of background illumination are plotted in Fig. 6 for the three methods (criterion response amplitude, and two fixed intensities) and for the three subjects. Measurements from Fig. 5 (for subject A.M.C.) are indicated by open circles at the higher test flash intensity and by grey circles at the lower test flash intensity. For each condition, response amplitudes were measured at the peak, and then normalized vertically to the dark-adapted level (see legend). Measurements from similar experiments on the other two subjects are indicated by the other open and grey symbols. Measurements obtained using the criterion response amplitude approach are represented by filled black symbols (•, A.M.C.; ▴, T.D.L.).
Figure 6. Weber's Law desensitization of the scotopic b-wave response amplitude.

Symbols plot the normalized sensitivity of the scotopic b-wave response, measured using either the conventional ‘criterion amplitude’ approach (black symbols), or with flashes of fixed intensity (0.1 Td s, open symbols; 0.02 Td s, grey symbols). Each subject's measurements are plotted with the same symbol: A.M.C. (circles); T.D.L. (triangles); O.A.R.M. (diamonds). Curves plot Weber's Law, eqn (2) with exponent n = 0.88 and with half-desensitizing intensity: I0= 0.1 Td (continuous curve), and I0= 0.22 Td (dashed curve). Measurements for each subject were averaged over several experiments. Prior to pooling, the results from each experiment were individually fitted with eqn (2), and normalized vertically before averaging. Numbers of experiments averaged were as follows. For criterion amplitude of ∼10 μV: •, A.M.C., one experiment; ▴, T.D.L., one experiment. For 0.1 Td s test flashes, ○, A.M.C., four experiments; ▵, T.D.L., four experiments; ⋄, O.A.R.M., eight experiments. For 0.02 Td s test flashes: , A.M.C., five experiments;
  T.D.L, one experiment. Error bars represent 1 s.e.m., and are only shown where they exceed the symbol size.
Inspection of Fig. 6 shows that the light-adaptation behaviour under each condition can be described well by the generalized form of Weber's Law
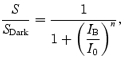 |
where S/SDark is the flash sensitivity relative to its dark-adapted value, IB is the background intensity (in Td), I0 is the background intensity that reduces the sensitivity to half-maximal, and n is an exponent. Measurements made using both the criterion amplitude approach and the lower fixed flash intensity approach were well described with I0= 0.1 Td (left-hand curve), for both subjects tested, whereas the measurements made using the brighter fixed flash intensity needed about double that value, or I0= 0.22 Td (right-hand curve), for the three subjects tested. Measurements obtained with all three approaches could be fitted with a common value for the exponent, n = 0.88.
The relative merits of the three methods for estimating the light adaptation of rod bipolar cells can be summarized as follows. The criterion response amplitude approach readily allows measurements to be made over a wide range of background intensities, and yields a value for I0 that is consistent with previous work (see Discussion), but it is likely to be difficult to apply for measurements of dark adaptation where the sensitivity is continually changing. The fixed intensity dim-flash method yields comparable results for dim background intensities, but the responses are in practice unmeasurable when the desensitization is substantial. The fixed intensity brighter-flash method provides more robust responses, and permits sensitivity to be followed down to greater desensitizations, but presumably because of response non-linearity the method yields an elevated estimate for the half-desensitizing intensity. Nevertheless, this last approach is likely to be the most satisfactory in our subsequent dark-adaptation experiments, because there is no need to alter the flash intensity interactively during the experiment, and because the more robust response amplitudes obtained permit larger desensitizations to be monitored. The artificially high value of I0 is not an issue in dark-adaptation experiments, because the measured Weber Law relation can be used to estimate an ‘equivalent intensity’ (see later).
Effect of photoreceptor signals on estimates of light adaptation
The responses in Fig. 5 contain only small contributions from rod photoreceptor signals in absolute terms. For example, in the upper panel (with the brighter test flash, 0.1 Td s), the amplitude of the rod signal in the presence of the dimmest background can be estimated from inspection of Fig. 3B as only ∼3 μV, or ∼5% of the peak amplitude of the rod bipolar cell response. For the lower panel (with the dimmer test flash, 0.02 Td s) we estimate the rod contribution to be ∼0.6 μV, or ∼3% of the response on the dimmest background.
With brighter backgrounds, both the b-wave and the rod signal will decrease in amplitude. However, because the half-desensitizing intensity (I0) for the b-wave is lower than that for the rods (Kraft et al. 1993; Friedburg et al. 2001), the b-wave will be desensitized and accelerated at backgrounds that leave the rod signal almost unchanged. Hence, as the background increases, the rod signal is expected to comprise a larger fraction of the recorded response (though this effect will be counteracted somewhat by the earlier measurement time used for the accelerated b-wave responses). We estimated the proportion of the response at the b-wave time-to-peak contributed by rods, on each background, using the rod photoreceptor light adaptation measurements of Friedburg et al. (2001). Thus we again used eqn (6a) of Friedburg et al. (2001), but with light-adapted values of the inactivation parameters t0 and τrec estimated from their Figs 9 and 10. These calculations confirmed that the fractional contribution from the rods should increase as the background intensity increases, from a level of no more than 5% at the lowest background to around 10, 15, 30 and 40% at the highest four backgrounds (of about 0.5, 1.5, 5 and 15 Td) in Fig. 5. After correction for the predicted rod signal, we found that Weber's Law still provided a good description of the desensitization, using the same values for I0, but with the exponent reduced to n = 0.8 (data not shown).
Figure 9. Dark adaptation of the b-wave and conversion to equivalent background intensity, for test flashes of two intensities.

Open symbols plot measurements obtained using the dimmer test flashes (0.02 Td s) for subject A.M.C. following bleaches of three levels, while filled symbols plot measurements using the brighter test flashes (0.1 Td s) for the three subjects following the largest bleach. Upper panels plot the normalized amplitude of the b-wave response, before, and up to 40 min after bleaches of 5.3, 45 and 92–96%; bleaches were delivered at least twice, with the exception of the 96% bleach illustrated for subject O.A.R.M. Lower panels plot the equivalent background intensities from the corresponding panels above, calculated as in Fig. 8 but using the half-desensitizing intensity appropriate for the test flash. A and C, for subject A.M.C., with flashes of 0.02 Td s, following bleaches of 5.3 and 45%. B and D, for all three subjects following a very large bleach. A.M.C., 96% bleach: dimmer flashes (○), brighter flashes (•). O.A.R.M., 96% bleach, brighter test flashes (♦). T.D.L., 92% bleach, brighter test flashes (▴). In each lower panel, the red line plots component ‘S2’, the dotted line plots component ‘S3’, and the curve plots their sum (see eqn (6)). The curves in the upper panels plot the same functions after transformation using eqn (4) with the appropriate value of I0.
Figure 10. Dependence of b-wave recovery time on bleaching strength.

The time required for the amplitude of the b-wave response to reach a criterion level is plotted against bleach magnitude. Results were obtained with test flashes at the higher fixed intensity (0.1 Td s) for all three subjects (filled symbols), and at the lower fixed intensity (0.02 Td s) for subject A.M.C. (○). As a fraction of the dark-adapted sensitivity, the criterion recovery level was set to 25% for the experiments at the lower test flash intensity, and to 40% for the experiment at the higher test flash intensity, corresponding to an equivalent background intensity of ∼0.35 Td (see text, and vertical grey line in Fig. 6). The plotted values were determined from the time intercepts of the fitted Iequiv(t) functions in Figs 8A, 9A and 10 with the criterion level of 25 or 40%. The continuous curve plots the prediction of the MLP rate-limited model of pigment regeneration (from eqn (7); see also Lamb & Pugh, 2004), with standard parameters v = 0.085 min−1 and Km= 0.2. The plotted curve represents a rotated version of rhodopsin regeneration, starting from the point (B = 1, t = 20.5 min) and proceeding leftwards and downwards; it corresponds to the expected decay of opsin.
Despite the presence of a rod signal, there is a considerable range over which the b-wave response is dominated by rod bipolar cell activity (i.e. where it is expected to comprise > 85% of the measured signal), and barely influenced by the photoreceptor contribution. In terms of sensitivity, this range extends from dark-adapted down to roughly one-tenth of dark-adapted sensitivity, and in terms of background intensity it extends from our very dim background (0.015 Td) to about 1.5 Td (see Fig. 6). Thus, for our subsequent analysis of dark adaptation recovery, where we compare post-bleach b-wave responses with light-adapted b-wave responses, our measurements should primarily reflect rod bipolar cell activity, once the response has recovered to about 10% of its dark-adapted level. Hence, in making the conversion to ‘equivalent background intensity’ using the Weber Law parameters determined in Fig. 6, there should be little error introduced by rod signals, once the equivalent background has fallen below 1–2 Td.
Dark adaptation of the scotopic b-wave
Our main purpose in this study was to examine dark adaptation of the rod bipolar cell response, as monitored by the scotopic b-wave. Based on our findings in the previous section, we monitored post-bleach sensitivity using flashes of fixed intensity, at both the brighter (0.1 Td s) and dimmer (0.02 Td s) intensities used in Figs 5 and 6.
Qualitative features of post-bleach recovery
Figure 7 shows families of averaged b-wave responses from our representative subject, to the 0.1 Td s test flash, with each panel obtained following a different bleach that ranged from 1.7 to 96% of the rhodopsin. The two largest traces in each panel are averaged pre- and post-bleach responses obtained over intervals of 5–10 min, either before (black traces) or late after (grey traces) delivery of the bleach. The coloured traces plot averaged responses to test flashes delivered over intervals of 1 min; see legend for details of these timings. Following bleaching, the b-wave was initially greatly reduced in amplitude, and thereafter recovered slowly with time. Moreover, as will become more clearly apparent in the next figure, recovery commenced at successively later times for bleaches of larger magnitude.
Figure 7. Recovery of b-wave responses following bleach delivery, for test flash of fixed intensity.

Each panel plots the b-wave response to a test flash of fixed intensity (0.1 Td s) at a series of times after extinction of a bleach, for subject A.M.C. In panels A–F, the calculated fractional bleaches were: 1.7, 5.1, 10, 27, 43 and 96%. The two largest responses in each panel are pre-bleach (black) and fully recovered (grey), and have been averaged over intervals of 5–10 min. Other responses during recovery (coloured traces) have been averaged from up to 16 traces recorded over intervals of 1 min, and the time window in which they were collected is indicated by colour coding (see legend key). To avoid overcrowding, traces for some post-bleach times have been omitted. After larger bleaches, little response was discernable for several minutes, and so in panels D–F the smallest response is the average of all traces falling within this ‘silent period’. The absolute amplitude (of pre-bleach and fully recovered responses) was different in the different panels, which were obtained in experiments over 4 days; these variations presumably resulted from differences in electrode position and differences in pupil diameter (range 5.9–7.9 mm) between experiments.
Comparison of the recovery families plotted in Fig. 7 with the light-adaptation family plotted in Fig. 5A indicates that, following the two smallest bleaches (1.7 and 5.1%), the post-bleach responses are qualitatively similar to those found during light-adaptation. Thus, the responses appeared to begin rising along a common curve, and the reduction in peak amplitude was accompanied by a shortening of the time-to-peak. In contrast, for bleaches larger than ∼10%, the post-bleach responses did not seem to rise along a common curve, and instead the intermediate responses appeared to peak at the same time as (or even slightly later than) the pre-bleach response, and gave the impression of being ‘scaled down’ rather than accelerated. Thus the recovery of the b-wave following small bleaches (<10%) is broadly as expected for the fading of an ‘equivalent background’ light, whereas the recovery after larger bleaches (>10%) does not appear to be explicable simply in terms of a phenomenon wholly identical to the fading of a background light. We will defer our examination of the possible reasons for this difference until the Discussion.
Time course of b-wave recovery following bleaching
In Fig. 8A we plot the recovery of the b-wave response, measured at the peak, following bleaches of six magnitudes, based on experiments such as those illustrated in Fig. 7 (using test flashes of 0.1 Td s). Each set of symbols has been averaged from two or three experiments in which nominally the same bleach was delivered (though small differences in pupil size led to minor differences in the actual bleaching levels). As the bleaching strength increased, the recoveries became progressively more delayed, with half-recovery following the largest bleach taking about 20 min. The time course of recovery appears broadly similar following each bleach. Thus, to a first approximation, it appears that a common template shape moves rightwards as the bleaching level increases; however, after the largest bleaches a slow phase of recovery becomes apparent.
Figure 8. Dark adaptation of the b-wave, monitored with the brighter test flash, and conversion to equivalent background intensity.

Dark adaptation recovery for subject A.M.C., measured using the brighter fixed flash intensity of 0.1 Td s, for bleaching exposures of six different strengths: 1.9, 5.4, 10, 26, 45 and 96%. A, normalized amplitude of the b-wave response, before, and up to 35 min after, cessation of each exposure. Response amplitudes have been measured at the peak and normalized to the mean amplitude of the pre-bleach and fully recovered responses. Each bleach was delivered two or three times (generally in experiments on different days) using the same exposure; however, the pupil size varied from day to day and so the average bleach levels are given. Each symbol plots the average of the normalized amplitudes recorded during an interval of 1 min; hence, with 16 flashes per interval, per bleach, each point has been averaged from up to 48 flash presentations. The grey vertical lines indicate the timing of bleach delivery. The curves convert the equivalent background intensity traces plotted in B into desensitizations, using eqn (4). B, the points in A have been converted into ‘equivalent background intensities’ using eqn (5) with parameter values determined from the Weber's Law relation, eqn (3) fitted to the light adaptation results in Fig. 6 for this test flash intensity (0.1 Td s), i.e. with I0= 0.22 Td and n = 0.88. Measurements that would have transformed to values outside the vertical limits of the panel have been plotted at those limits. The dashed horizontal line indicates I0, and the transformed symbols are most reliable over the region of ∼1 log10 unit above and below this level. The curves in B plot the decay of equivalent background intensity Iequiv(t) predicted by eqn (6), using the values of IS2(0) reported in Table 1. These curves were then transformed into the curves in A by substitution into eqn (4) using the values above for I0 and n.
Conversion to equivalent background intensity
For the recoveries from the smaller bleaches, where the response waveforms suggest that the behaviour is comparable to that produced by a fading background of real light, the measured post-bleach desensitizations can be converted to ‘equivalent background intensities’ using the classical method of ‘Crawford transformation’ (Crawford, 1947; Rushton, 1965). Thus, we can apply the Weber relation determined in Fig. 6 for flashes of the same intensity, in an inverse manner, to map desensitization into equivalent intensity. Following larger bleaches, where the form of recovery appears not to be identical to the effects of light, we shall nevertheless apply the same transformation, and we will consider the implications of this procedure subsequently (see Discussion).
In making the Crawford transformation, we need to allow for the fact that in all our dark adaptation experiments we deliberately applied a dim steady background (IDim) to minimize intrusion of the STR. Hence, instead of using the simple Weber's Law relation given in eqn (3), where sensitivity is referenced to the dark state, we need the sensitivity relative to that in the dim background
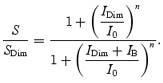 |
This relation can be inverted to yield the background intensity IB that elicits any arbitrary sensitivity ratio, S/SDim, as
The equivalent background intensities, calculated according to eqn (5) from the points in Fig. 8A, have been plotted in Fig. 8B on a logarithmic intensity scale, using corresponding symbols. In applying this equation, we used the parameter values n = 0.88 and I0= 0.22 Td determined in Fig. 6 for this flash intensity. Points that would have transformed to values outside the illustrated intensity range have been plotted at the upper or lower limits.
Analysis of psychophysical dark adaptation recoveries (Pugh, 1975; Lamb, 1981; Lamb & Pugh, 2004) has shown a prominent component of recovery, referred to as ‘S2’, that proceeds with a constant slope of ΨS2 ≈ 0.24 decades min−1 (τ2= 1.8 min). Inspection of Fig. 8B shows that a similar phenomenon occurs for the decline of equivalent background determined from b-wave measurements. However, at late times, it appeared that recovery was slower than predicted simply by the S2 component, and we found that the results were better fitted with an additional ‘S3’ component, as described by Lamb (1981), with a slope of ΨS3 ≈ 0.06 decades min−1 (τ3= 7.2 min). Thus, the equivalent background intensity Iequiv(t) could be expressed as the sum of two exponentially decaying components
where IS2(0) and IS3(0) represent the magnitudes of the S2 and S3 components at the instant the bleach was extinguished.
In fitting eqn (6) to the measurements in Fig. 8A, we set the vertical position of component S2 (i.e. the value of IS2(0)) for each bleach by eye, in order to fit the early phase of decay. In assigning the vertical position of component S3, we found that a good description could be provided by setting IS3(0) directly proportional to the bleach level; thus, we set IS3(0) =B × 1.5 Td. The resulting curves provided a good description of the recovery of equivalent background over the full range of bleaches that we delivered. Thus, across the whole range of bleaches from 1.9 to 96%, the recovery of b-wave sensitivity measured with a flash of 0.1 Td s was dominated by a component of equivalent background that decayed with the same fixed slope of 0.24 decades min−1 as the S2 component that dominates recovery in human psychophysical dark adaptation experiments; in addition, a smaller, slower component became obvious with the largest bleaches. Subsequently, we will compare the vertical scaling of the S2 component between b-wave and psychophysical recovery.
The theoretical curves for equivalent background plotted in Fig. 8B can be transformed into predictions for recovery of sensitivity simply by substitution into eqn (4). The resulting curves are plotted in Fig. 8A, and provide a correspondingly good fit to those presented in Fig. 8B.
Results from other subjects
Recovery of sensitivity was measured in two further subjects (O.A.R.M. and T.D.L.) using the higher test flash intensity, again for six bleaching strengths. These post-bleach recoveries were comparable to those shown in Fig. 8A (for A.M.C.). Moreover, for both subjects, the derived equivalent background intensities were consistent with those shown in Fig. 8B, declining according to eqn (6) with slopes as expected for the S2 and S3 components of recovery. The filled symbols in Fig. 9B and D plot the post-bleach recovery of sensitivity and equivalent background intensity measurements for all three subjects following the near-total bleach (•, A.M.C.; ♦, O.A.R.M.; ▴, T.D.L.). Table 1 summarizes the parameter values used to fit all three subjects' results, across the range of bleaching strengths.
Table 1.
| Subject | Flash (Td s) | Symbol (Figs 9 and 10) | Approx. bleach (%) | ||||||
|---|---|---|---|---|---|---|---|---|---|
| ∼2 | ∼5 | ∼10 | ∼25 | ∼45 | ∼95 | ||||
| A.M.C. | 0.1 | • | Bleach | 1.9% | 5.4% | 10% | 26% | 45% | 96% |
| IS2(0) (Td) | 0.76 | 2.6 | 14 | 150 | 880 | 14 000 | |||
| 0.02 | ○ | Bleach | 2.1% | 5.3% | 10% | 24% | 45% | 96% | |
| IS2(0) (Td) | 0.79 | 2.4 | 14 | 87 | 790 | 29 000 | |||
| O.A.R.M. | 0.1 | ♦ | Bleach | 1.6% | 5.3% | 12% | 25% | 50% | 96% |
| IS2(0) (Td) | 0.38 | 1.5 | 11 | 84 | 1200 | 32 000 | |||
| T.D.L. | 0.1 | ▴ | Bleach | 1.5% | 5.2% | 12% | 24% | 48% | 92% |
| IS2(0) (Td) | 0.76 | 3.5 | 24 | 150 | 1200 | 24 000 | |||
IS3(0) was set to B × 1.5 Td for A.M.C. and T.D.L., and to B × 1.0 Td for O.A.R.M. The values of the remaining parameters in eqn (6) were fixed at ΨS2= 0.24 decades min−1 and ΨS3= 0.06 decades min−1.
Recovery measured using the dimmer test flash
The measurements presented in Figs 7 and 8 were obtained using the brighter test flash intensity (0.1 Td s), but we also made corresponding measurements with the same subject (A.M.C.) using the dimmer test flash intensity (0.02 Td s). The open symbols in Fig. 9A–D plot the results for three sample bleaching strengths (5.3, 45 and 96%). When gauged with the dimmer test flash, the post-bleach recoveries again followed a shape that was generally similar (though shifted) at each bleach level, but with a slower final tail following larger bleaches. However, these recoveries were delayed by some 2–3 min compared with those obtained using the brighter test flash. For example, following the largest bleach (∼96%), half-recovery occurred in ∼23 min (open symbols, Fig. 9B), compared with ∼20 min when the brighter test flash was used (Fig. 8A and filled symbols in Fig. 9B). This behaviour is, in fact, exactly as expected, as a result of the shift in I0 between the two test flash intensities (see Fig. 6), and application of the Crawford transform showed that the equivalent background intensities obtained with the dimmer test flash were very similar to those found with the brighter flash, following comparable bleaches. As before, the decline of the calculated equivalent background could be described as the sum of two components (S2 and S3) which decayed with slopes of 0.24 and 0.06 decades min−1.
Hence we conclude that estimation of the time course of recovery of equivalent background intensity is not influenced by whether the test flash intensity is 0.02 or 0.1 Td s. In Fig. 9C and D the S2 (thick red line) and S3 (dotted line) components of equivalent background have been plotted separately, to illustrate their relative influence following small (5.3%), intermediate (45%), and large (96%) bleaches. As in Fig. 8, the black curves in Fig. 9C and D, representing the sum of S2 and S3, have been substituted into eqn (4) to predict the post-bleach recovery of sensitivity (Fig. 9A and B). The parameters used in fitting the recoveries for all six bleaches are listed in Table 1.
Relationship between b-wave recovery and bleaching strength
The results in Figs 7–9 indicate that the b-wave recovers later as the magnitude of the bleach increases. In order to quantify this association, we measured the time taken for the response to reach a criterion level of recovery, as a function of bleach magnitude. Previously this approach has been applied to examine the recovery of the overall human rod visual system assessed psychophysically (Lamb, 1981; Lamb & Pugh, 2004), and to examine recovery of the human rod photoreceptor circulating current measured from the a-wave of the ERG (Thomas & Lamb, 1999).
Figure 10 plots the time to reach the criterion recovery level, as a function of bleach magnitude, determined from the results for all three subjects using the brighter test flash (filled symbols; data from Figs 8A and 9B, and experiments summarized in Table 1) and for subject A.M.C. using the dimmer test flash (open symbols; data from Fig. 9A–B, and Table 1). In order to ensure that we would be investigating the earlier S2 component, rather than the later S3 component, we chose to set the criterion level to a relatively low level. Furthermore, to obtain equivalent recovery times for measurements at the two flash intensities, we used a lower criterion level for the dimmer flash than for the brighter flash, so as to compensate for the different positions of the Weber Law relations obtained in Fig. 6; the levels we chose were 25 and 40%, respectively, corresponding to an equivalent background of ∼0.35 Td; see vertical grey line in Fig. 6. The measurements rise steeply for small bleaches, and then more gradually with larger bleaches, in a manner closely similar to that reported previously for recovery of human rod circulating current and psychophysical threshold (see Fig. 7 of Lamb & Pugh, 2004).
The curve in Fig. 10 plots the expected relationship, according to the ‘MLP rate-limited model’ of Mahroo & Lamb (2004) and Lamb & Pugh (2004). That model predicts the time course Rh(t) for generation of rhodopsin as
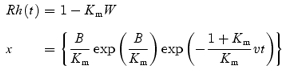 |
where W(x) is the Lambert W function (Corless et al. 1996), ν is the initial rate of regeneration after a full bleach, and Km is the semi-saturation constant. In Fig. 10, the standard parameter values of ν= 0.085 min−1 and Km= 0.2 have been used. As explained in the legend, the plotted curve is a transposed version of Rh(t), and represents the disappearance of opsin in the rod photoreceptors; see Fig. 7 of Lamb & Pugh (2004). The predicted curve provides a satisfactory description of the dependence of b-wave recovery time on bleach magnitude.
The MLP rate-limited model has recently been shown to account for the timing of both the recovery of rod photoreceptor circulating current (measured from the a-wave), and the recovery of sensitivity of the overall rod system (measured psychophysically), as a function of bleach level (Lamb & Pugh, 2004). Our present results show that the same kinetics of regeneration of visual pigment also provides an approximate description of the recovery of rod bipolar cell sensitivity (measured from the b-wave).
Discussion
Our main objective in this study was to measure the post-bleach recovery of the b-wave of the electroretinogram, to provide a monitor of dark adaptation of rod bipolar cells. In doing so, it was necessary first to investigate general properties of the b-wave, so we could identify and/or minimize signals arising from other cells, and secondly to measure light adaptation properties, so we could convert post-bleach desensitizations into equivalent background intensities.
General properties of the b-wave responses
Previous studies have shown that the scotopic b-wave reflects primarily the activity of rod bipolar cells. Here, we have confirmed the finding of Frishman et al. (1996a) that application of a very dim background (0.015 Td) can be used to effectively eliminate the corneal-negative contribution known as the nSTR (negative scotopic threshold response), at least for times up to the peak of the b-wave (∼120 ms after a dim flash). In addition, we have used the paired-flash technique (Pepperberg et al. 1997; Friedburg et al. 2001) to show that the rod photoreceptor contribution to the b-wave represents less than 5% of the total, for the two flash intensities employed in subsequent experiments, in the presence of the very dim background.
Light adaptation
Our measurements of light adaptation showed that, as expected, the scotopic b-wave response became desensitized and accelerated in the presence of background illumination, and that this desensitization was described by Weber's Law with an exponent n ≈ 0.88. Furthermore, our calculations showed that the rod contribution remains a low proportion of the b-wave response, even for backgrounds that desensitize the b-wave by up to 10-fold.
When measured using the conventional ‘criterion response amplitude’ approach (with a criterion of ∼10 μV), or when using a constant test flash of very low intensity (0.02 Td s), the half-desensitizing intensity was found to be I0≈ 0.1 Td. When the test flash was made fivefold brighter (0.1 Td s), the half-desensitizing intensity roughly doubled to I0≈ 0.22 Td; however, this increase is not surprising, given that the amplitude of the dark-adapted response (∼50 μV) was around half-maximal, and hence out of the linear range.
Our findings are broadly consistent with those of previous studies of the b-wave in human subjects (Fulton & Rushton, 1978; Frishman & Sieving, 1995; Frishman et al. 1996a), and indeed our value of I0≈ 0.1 Td is within the range of values reported previously (0.03–0.1 Td, reviewed in Frishman et al. 1996a). This intensity required to halve the rod bipolar cell response is on the one hand more than 100 times lower than the background intensity required to halve human rod photoreceptor sensitivity (∼14 Td, for measurements in vitro, Kraft et al. 1993; 9–16 Td, for measurements in vivo, Friedburg et al. 2001), yet on the other hand around 100 times greater that the background intensity required to halve the sensitivity of the human rod visual system (∼10−3 Td, Aguilar & Stiles, 1954; Sharpe, 1990). Our value for the Weber exponent, n ≈ 0.88, is slightly lower than the value of unity normally assumed for light adaptation of the b-wave. Following subtraction of the predicted rod signal, the value was reduced further to n ≈ 0.8. Our findings therefore suggest that rod bipolar sensitivity or ‘gain’ (Shapley & Enroth-Cugell, 1984) does not decline in direct proportion to the intensity of the background illumination, and instead exhibits a Weber exponent less than unity as is typically found for detection by the overall scotopic visual system.
Dark adaptation
During dark adaptation following a bleach, the scotopic b-wave response was initially greatly desensitized, but thereafter recovered slowly with time. Furthermore, as the magnitude of the bleach increased, sensitivity was restored later. Across the range of bleaches that we investigated (from < 2% to ∼96%), the time course of recovery exhibited qualitatively a similar shape, and to a first approximation it appeared that there was a progressive time-shifting of a common curve with increasing bleach level; however, with very large bleaches a slow phase of recovery became apparent. For a near-total bleach of the photopigment, the b-wave sensitivity to a flash of fixed dim intensity was unrecordable for > 10 min, then recovered to half-maximal after ∼23 min, and regained full sensitivity after 35–40 min. Our post-bleach recoveries were all obtained following relatively short bleaching exposures (of 45 s or less), and in the absence of measurements following longer exposures, we would caution against generalizing these results to extended bleaches.
Equivalence of backgrounds and small bleaches at the level of the rod bipolar cell
For the smallest bleaches, the kinetics of the b-wave responses during post-bleach recovery were very similar to those recorded on backgrounds, suggesting that after small bleaches the rod bipolar cells were experiencing a phenomenon akin to real light, that was capable of desensitizing and accelerating the response, and that faded with time. Accordingly, we applied a ‘Crawford transformation’ (the inverse of the light adaptation curve plotted in Fig. 6) to convert the post-bleach responses into equivalent levels of background illumination. We found it convenient to apply the same analysis across the entire range of bleaching strengths, and subsequently we discuss the consequences of doing so. Using the Crawford transformation approach, we found that the intensity of the equivalent background experienced by rod bipolar cells declined with an ‘S2’ slope of 0.24 decades min−1 (τ= 1.8 min) over a considerable range of post-bleach times. However, during the late stages of recovery, another component was also evident, which declined more slowly, with an ‘S3’ slope of 0.06 decades min−1 (τ= 7.2 min).
Comparison with psychophysics
Very similar phenomena have been observed during the dark adaptation recovery of the overall rod visual system, determined from psychophysical measurements with human subjects. The psychophysical dark adaptation results of Pugh (1975) were described by Lamb (1981) as being dominated by a ‘second component’ (S2) of decay of equivalent background, with a slope of 0.24 decades min−1 (reviewed in Lamb & Pugh, 2004). In molecular terms, it was postulated that the S2 behaviour results from the exponential decay of a photoproduct of bleaching within the rods (Lamb, 1981), and recently Lamb & Pugh (2004) have reviewed a wide range of evidence indicating that the S2 component represents unregenerated opsin. Opsin has been shown to stimulate the phototransduction cascade with an efficacy of 10−6 to 3 × 10⁻⁵ that of photoactivated rhodopsin (Cornwall & Fain, 1994; Melia et al. 1997; Fan et al. 2005).
Thus, the time course of the recovery of rod bipolar cell sensitivity during dark adaptation is broadly comparable to the time course of dark adaptation found for the overall rod visual system. Moreover, the lateral time shifting of the S2 region of recovery as a function of increasing bleach strength is broadly similar for b-waves and for psychophysics. In both cases the time taken to reach a criterion level of recovery varies with bleach strength approximately according to the predictions of the ‘MLP rate-limited model’ (Lamb & Pugh, 2004), and the same expression also describes the relationship between bleach magnitude and the recovery of circulating current in the rod photoreceptors. These results are consistent with the idea that the prominent S2 component of post-bleach recovery reflects the conversion of opsin to rhodopsin, with kinetics that are first-order for small bleaches but that become rate-limited for large bleaches.
Limitations to the concept of an equivalent background
Ever since Stiles & Crawford (1932) suggested that the after-effects of intense light exposures had similarities to the fading of a dim light, the concept of ‘equivalent background intensity’ has provided a cornerstone for considering ideas about post-bleach recovery. However, the concept has limitations, because the after-effects of bleaches are not identical to the effects of dim light. Thus, the magnitude of the equivalent background that one calculates after a given bleach depends on the level of the visual system being considered. For example, at an arbitrary time of 3 min after a bleach of 8–10%, the equivalent background may be estimated as follows: for suppression of the rod circulating current, about 50 Td (Thomas & Lamb, 1999; Fig. 9); for desensitization of the rod bipolar cell response, about 3 Td (Figs 8 and 9); and for desensitization of the overall visual system, about 0.4 Td (Pugh, 1975; using the Weber's Law relationship of Aguilar & Stiles, 1954 or Sharpe, 1990).
These differences might have their origin in the non-equivalence of the cellular mechanisms involved in background adaptation and bleaching adaptation in scotopic vision. The after-effects of bleaching are mediated by the accumulation of photoproducts (e.g. unregenerated opsin), which lead mainly to steady activation of the phototransduction cascade. In contrast, steady illumination at scotopic intensities involves pulsatile activation of the cascade by individual photoisomerizations, and the visual system has specialized circuitry for processing these discrete single-photon events. As a result, a given level of steady activation of the transduction cascade may translate to quite different magnitudes of equivalent light, when its effects are calculated at different levels in the system.
This phenomenon may be related to the well-known finding for steady illumination, that the overall visual system is desensitized by lower intensities than are needed to desensitize the bipolar cell, which are in turn lower than those needed to desensitize the rods (see for example, Naarendorp et al. 2001; and above).
Non-equivalence of backgrounds and large bleaches
Although the form of the post-bleach response kinetics closely resembled light-adapted responses for the smallest bleach (< 2%), there was a gradual change in qualitative form as the bleach level increased; see panels in Fig. 7. It appeared that acceleration of the response kinetics became to some extent dissociated from desensitization. Thus, for the small responses obtained at early post-bleach times, the responses were indeed accelerated, but after a certain time during recovery the response kinetics were fully recovered while the sensitivity remained reduced.
This behaviour suggests to us that after larger bleaches some additional phenomenon is scaling down the rod bipolar cell sensitivity, without eliciting the acceleration characteristic of background illumination. Thus, the slow component of recovery (S3), which becomes more pronounced following larger bleaches, may represent this ‘scaling’ phenomenon alone, i.e. desensitization without acceleration. And at earlier times after large bleaches, it is possible that the main component (S2) results from the combination of a phenomenon like light, which accelerates and desensitizes, with the effects of the separate ‘scaling’ phenomenon.
Hypothetical mechanism for the slow component of recovery
As a hypothetical mechanism for the ‘scaling’ behaviour, we suggest the possibility that all-trans retinal released by bleaching has an effect in reducing rod bipolar cell sensitivity. It is well known that very large bleaches lead to the formation of millimolar levels of all-trans retinal in the outer segments (Saari, 1999), and there is also recent evidence that all-trans retinal leads to closure of ion channels in the photoreceptors. Thus, all-trans retinal has been reported to block the cyclic nucleotide-gated ion channels of the outer segment (Dean et al. 2002; McCabe et al. 2004; Horrigan et al. 2005) and also to block the calcium channels of the synaptic terminal (Vellani et al. 2000). Either of these mechanisms would be expected to elicit desensitization of the rod bipolar cell response, without acceleration of the kind generated by background illumination. Hence we suggest that the slow S3 component seen at later times during recovery may result from the presence of all-trans retinal after the bleach. Furthermore, we suggest that at earlier times during recovery from large bleaches, the S2 component may result from the combined effects of opsin (causing desensitization and acceleration) and all-trans retinal (causing desensitization alone). Our proposal that all-trans retinal underlies response scaling and the slow S3 region of recovery by closure of ion channels is one possible mechanism to account for the results, and we cannot rule out alternative explanations.
Alternative estimation of equivalent background intensity after large bleaches
The breakdown of equivalence to real light in the case of larger bleaches has the consequence that the Crawford transformation that we applied may give misleading results for the larger bleaches. In particular, it would be expected that the equivalent background intensities estimated that way might be biased towards higher values than are appropriate. We therefore investigated an alternative transformation. Rather than transforming on the basis of desensitization, we attempted to transform on the basis of the time-to-peak of the responses. We found, though, that this approach was highly susceptible to noise in the responses, and therefore provided estimates of equivalence that were themselves noisy. Nevertheless, preliminary application of the method indicated that for large bleaches the ‘acceleration equivalent’ background was considerably smaller than the ‘desensitization equivalent’ background plotted in Figs 8 and 9 (results not shown). Likewise, the estimates of time to a criterion level of recovery were, in the case of large bleaches, somewhat shorter than the values plotted in Fig. 10.
Conclusion
Based on these considerations, our results appear consistent with the notion that post-bleach recordings of scotopic b-wave sensitivity reflect (i) one phenomenon that is closely equivalent to the fading of a real light and that probably reflects the presence of unregenerated opsin in the rods, and (ii) another phenomenon that primarily causes desensitization without acceleration, and that may be mediated by the action of all-trans retinal on ion channels. Following large bleaches, both phenomena would appear to contribute to the main ‘S2’ component of recovery measured in rod bipolar cells, while only the latter phenomenon would appear to continue contributing during the slower ‘S3’ component.
Acknowledgments
We thank Liang Miao for development of the ‘MatERG’ program, and we are grateful to Ms Liz Bowman for assistance with experiments. Data for previously published traces in Fig. 4 were kindly provided by Drs J. G. Robson, F. Rieke and W. R. Taylor. This work was supported by NHMRC project grant 268032 and ARC grants FF0344672 and CE0561903.
References
- Adrian ED. The electric response of the human eye. J Physiol. 1945;104:84–104. doi: 10.1113/jphysiol.1945.sp004109. [DOI] [PMC free article] [PubMed] [Google Scholar]
- Aguilar M, Stiles WS. Saturation of the rod mechanism of the retina at high levels of stimulation. Optica Acta. 1954;1:59–65. [Google Scholar]
- Alpern M, Pugh EN., Jr The density and photosensitivity of human rhodopsin in the living retina. J Physiol. 1974;237:341–370. doi: 10.1113/jphysiol.1974.sp010485. [DOI] [PMC free article] [PubMed] [Google Scholar]
- Ashmore JF, Falk G. Responses of rod bipolar cells in the dark-adapted retina of the dogfish, Scyliorhinus canicula. J Physiol. 1980;300:115–150. doi: 10.1113/jphysiol.1980.sp013155. [DOI] [PMC free article] [PubMed] [Google Scholar]
- Berntson A, Smith RG, Taylor WR. Postsynaptic calcium feedback between rods and rod bipolar cells in the mouse retina. Vis Neurosci. 2004;21:913–924. doi: 10.1017/S095252380421611X. [DOI] [PubMed] [Google Scholar]
- Berntson A, Taylor WR. Response characteristics and receptive field widths of on-bipolar cells in the mouse retina. J Physiol. 2000;524:879–889. doi: 10.1111/j.1469-7793.2000.00879.x. [DOI] [PMC free article] [PubMed] [Google Scholar]
- Bloomfield SA, Dacheux RF. Rod vision: pathways and processing in the mammalian retina. Prog Retin Eye Res. 2001;20:351–384. doi: 10.1016/s1350-9462(00)00031-8. [DOI] [PubMed] [Google Scholar]
- Cameron AM, Mahroo OAR, Lamb TD. Dark adaptation of human rod bipolar cells measured in vivo using the scotopic b-wave of the ERG. Invest Ophthalmol Vis Sci. 2005;46 E-abstract 5687. [Google Scholar]
- Cideciyan AV, Zhao X, Nielsen L, Khani SC, Jacobson SG, Palczewski K. Null mutation in the rhodopsin kinase gene slows recovery kinetics of rod and cone phototransduction in man. Proc Natl Acad Sci U S A. 1998;95:328–333. doi: 10.1073/pnas.95.1.328. [DOI] [PMC free article] [PubMed] [Google Scholar]
- Corless RM, Gonnet GH, Hare DEG, Jeffrey DJ, Knuth DE. On the Lambert W function. Adv Comput Math. 1996;5:329–359. [Google Scholar]
- Cornwall MC, Fain GL. Bleached pigment activates transduction in isolated rods of the salamander retina. J Physiol. 1994;480:261–279. doi: 10.1113/jphysiol.1994.sp020358. [DOI] [PMC free article] [PubMed] [Google Scholar]
- Crawford BH. Visual adaptation in relation to brief conditioning stimuli. Proc R Soc Lond B Biol Sci. 1947;134:283–302. doi: 10.1098/rspb.1947.0015. [DOI] [PubMed] [Google Scholar]
- Dean DM, Nguitragool W, Miri A, McCabe SL, Zimmerman AL. All-trans-retinal shuts down rod cyclic nucleotide-gated ion channels: a novel role for photoreceptor retinoids in the response to bright light? Proc Natl Acad Sci U S A. 2002;99:8372–8377. doi: 10.1073/pnas.122681899. [DOI] [PMC free article] [PubMed] [Google Scholar]
- Euler T, Masland RH. Light-evoked responses of bipolar cells in a mammalian retina. J Neurophysiol. 2000;83:1817–1829. doi: 10.1152/jn.2000.83.4.1817. [DOI] [PubMed] [Google Scholar]
- Fan J, Woodruff ML, Cilluffo MC, Crouch RK, Fain GL. Opsin activation of transduction in the rods of dark-reared Rpe65 knockout mice. J Physiol. 2005;568:83–95. doi: 10.1113/jphysiol.2005.091942. [DOI] [PMC free article] [PubMed] [Google Scholar]
- Field GD, Rieke F. Nonlinear signal transfer from mouse rods to bipolar cells and implications for visual sensitivity. Neuron. 2002;34:773–785. doi: 10.1016/s0896-6273(02)00700-6. [DOI] [PubMed] [Google Scholar]
- Friedburg C, Thomas MM, Lamb TD. Time course of the flash response of dark- and light-adapted human rod photoreceptors derived from the electroretinogram. J Physiol. 2001;534:217–242. doi: 10.1111/j.1469-7793.2001.t01-1-00217.x. [DOI] [PMC free article] [PubMed] [Google Scholar]
- Frishman LJ, Reddy MG, Robson JG. Effects of background light on the human dark-adapted electroretinogram and psychophysical threshold. J Opt Soc Am A. 1996a;13:601–612. doi: 10.1364/josaa.13.000601. [DOI] [PubMed] [Google Scholar]
- Frishman LJ, Shen FF, Du L, Robson JG, Harwerth RS, Smith EL, Carter-Dawson L, Crawford MLJ. The scotopic electroretinogram of macaque after retinal ganglion cell loss from experimental glaucoma. Invest Ophthalmol Vis Sci. 1996b;37:125–141. [PubMed] [Google Scholar]
- Frishman LJ, Sieving PA. Evidence for two sites of adaptation affecting the dark-adapted ERG of cats and primates. Vision Res. 1995;35:435–442. doi: 10.1016/0042-6989(94)00165-i. [DOI] [PubMed] [Google Scholar]
- Fulton AB, Rushton WAH. The human rod ERG: Correlation with psychophysical responses in light and dark adaptation. Vision Res. 1978;18:793–800. doi: 10.1016/0042-6989(78)90119-0. [DOI] [PubMed] [Google Scholar]
- Hecht S, Shlaer S, Pirenne MH. Energy, quanta, and vision. J Gen Physiol. 1942;25:819–840. doi: 10.1085/jgp.25.6.819. [DOI] [PMC free article] [PubMed] [Google Scholar]
- Hetling JR, Pepperberg DR. Sensitivity and kinetics of mouse rod flash responses determined in vivo from paired-flash electroretinograms. J Physiol. 1999;516:593–609. doi: 10.1111/j.1469-7793.1999.0593v.x. [DOI] [PMC free article] [PubMed] [Google Scholar]
- Hollins M, Alpern M. Dark adaptation and visual pigment regeneration in human cones. J Gen Physiol. 1973;62:430–447. doi: 10.1085/jgp.62.4.430. [DOI] [PMC free article] [PubMed] [Google Scholar]
- Hood DC, Birch DG. A computational model of the amplitude and implicit time of the b-wave of the human ERG. Vis Neurosci. 1992;8:107–126. doi: 10.1017/s0952523800009275. [DOI] [PubMed] [Google Scholar]
- Hood DC, Birch DG. b-wave of the scotopic (rod) electroretinogram as a measure of the activity of human on-bipolar cells. J Opt Soc Am A. 1996;13:623–633. doi: 10.1364/josaa.13.000623. [DOI] [PubMed] [Google Scholar]
- Horrigan DM, Tetreault ML, Tsomaia N, Vasileiou C, Borhan B, Mierke DF, Crouch RK, Zimmerman AL. Defining the retinoid binding site in the rod cyclic nucleotide-gated channel. J Gen Physiol. 2005;126:453–460. doi: 10.1085/jgp.200509387. [DOI] [PMC free article] [PubMed] [Google Scholar]
- Johnson EP, Riggs LA. Electroretinal and psychophysical dark adaptation curves. J Exp Psychol. 1951;41:139–147. doi: 10.1037/h0060692. [DOI] [PubMed] [Google Scholar]
- Karpe G, Tansley K. The relationship between the change in the electroretinogram and the subjective dark adaptation curve. J Physiol. 1948;107:272–279. doi: 10.1113/jphysiol.1948.sp004271. [DOI] [PMC free article] [PubMed] [Google Scholar]
- Kraft TW, Schneeweis DM, Schnapf JL. Visual transduction in human rod photoreceptors. J Physiol. 1993;464:747–765. doi: 10.1113/jphysiol.1993.sp019661. [DOI] [PMC free article] [PubMed] [Google Scholar]
- Lamb TD. The involvement of rod photoreceptors in dark adaptation. Vision Res. 1981;21:1773–1782. doi: 10.1016/0042-6989(81)90211-x. [DOI] [PubMed] [Google Scholar]
- Lamb TD, Pugh EN., Jr Dark adaptation and the retinoid cycle of vision. Prog Retin Eye Res. 2004;23:307–380. doi: 10.1016/j.preteyeres.2004.03.001. [DOI] [PubMed] [Google Scholar]
- Mahroo OAR, Lamb TD. Recovery of the human photopic electroretinogram after bleaching exposures: estimation of pigment regeneration kinetics. J Physiol. 2004;554:417–437. doi: 10.1113/jphysiol.2003.051250. [DOI] [PMC free article] [PubMed] [Google Scholar]
- McCabe SL, Pelosi DM, Tetreault M, Miri A, Nguitragool W, Kovithvathanaphong P, Mahajan R, Zimmerman AL. All-trans-retinal is a closed-state inhibitor of rod cyclic nucleotide–gated ion channels. J Gen Physiol. 2004;123:521–531. doi: 10.1085/jgp.200409011. [DOI] [PMC free article] [PubMed] [Google Scholar]
- Melia TJ, Cowan CW, Angleson JK, Wensel TG. A comparison of the efficiency of G protein activation by ligand-free and light-activated forms of rhodopsin. Biophys J. 1997;73:3182–3191. doi: 10.1016/S0006-3495(97)78344-9. [DOI] [PMC free article] [PubMed] [Google Scholar]
- Naarendorp F, Sato Y, Cajdric A, Hubbard NP. Absolute and relative sensitivity of the scotopic system of rat: electroretinography and behavior. Vis Neurosci. 2001;18:641–656. doi: 10.1017/s0952523801184142. [DOI] [PubMed] [Google Scholar]
- Paupoo AAV, Mahroo OAR, Friedburg C, Lamb TD. Human cone photoreceptor responses measured by the electroretinogram a-wave during and after exposure to intense illumination. J Physiol. 2000;529:469–482. doi: 10.1111/j.1469-7793.2000.00469.x. [DOI] [PMC free article] [PubMed] [Google Scholar]
- Pepperberg DR, Birch DG, Hood DC. Photoresponses of human rods in vivo derived from paired-flash electroretinograms. Vis Neurosci. 1997;14:73–82. doi: 10.1017/s0952523800008774. [DOI] [PubMed] [Google Scholar]
- Pugh EN., Jr Rushton's paradox: rod dark adaptation after flash photolysis. J Physiol. 1975;248:413–431. doi: 10.1113/jphysiol.1975.sp010982. [DOI] [PMC free article] [PubMed] [Google Scholar]
- Pugh EN, Jr, Falsini B, Lyubarksy AL. The origin of the major rod- and cone-driven components of the rodent electroretinogram and the effect of age and light-rearing history on the magnitude of these components. In: Williams TP, Thistle AB, editors. Photostasis and Related Phenomena. New York: Plenum Press; 1998. pp. 93–128. [Google Scholar]
- Ripps H, Weale RA. Flash bleaching of rhodopsin in the human retina. J Physiol. 1969;200:151–159. doi: 10.1113/jphysiol.1969.sp008686. [DOI] [PMC free article] [PubMed] [Google Scholar]
- Robson JG, Frishman LJ. Dissecting the dark-adapted electroretinogram. Doc Ophthalmol. 1999;95:187–215. doi: 10.1023/a:1001891904176. [DOI] [PubMed] [Google Scholar]
- Robson JG, Maeda H, Saszik SM, Frishman LJ. In vivo studies of signalling in rod pathways of the mouse using the electroretinogram. Vision Res. 2004;44:3253–3268. doi: 10.1016/j.visres.2004.09.002. [DOI] [PubMed] [Google Scholar]
- Rushton WAH. The Ferrier Lecture, 1962. Visual adaptation. Proc R Soc Lond B Biol Sci. 1965;162:20–46. doi: 10.1098/rspb.1965.0024. [DOI] [PubMed] [Google Scholar]
- Rushton WAH, Powell DS. The rhodopsin content and the visual threshold of human rods. Vision Res. 1972;12:1073–1081. doi: 10.1016/0042-6989(72)90098-3. [DOI] [PubMed] [Google Scholar]
- Saari JC. Retinoids in mammalian vision. In: Nau H, Blaner WS, editors. Retinoids: the Biochemical and Molecular Basis of Vitamin A and Retinoid Action. Vol. 139. New York: Springer-Verlag; 1999. pp. 563–588. [Google Scholar]
- Sakitt B. Counting every quantum. J Physiol. 1972;223:131–150. doi: 10.1113/jphysiol.1972.sp009838. [DOI] [PMC free article] [PubMed] [Google Scholar]
- Sampath AP, Rieke R. Selective transmission of single photon responses by saturation at the rod-to-rod bipolar synapse. Neuron. 2004;41:431–443. doi: 10.1016/s0896-6273(04)00005-4. [DOI] [PubMed] [Google Scholar]
- Saszik SM, Robson JG, Frishman LJ. The scotopic threshold response of the dark-adapted electroretinogram of the mouse. J Physiol. 2002;543:899–916. doi: 10.1113/jphysiol.2002.019703. [DOI] [PMC free article] [PubMed] [Google Scholar]
- Shapley R, Enroth-Cugell C. Visual adaptation and retinal gain controls. Prog Retin Res. 1984;3:263–343. [Google Scholar]
- Sharpe LT. The light adaptation of the human rod visual system. In: Hess RF, Sharpe LT, Nordby K, editors. Night Vision: Basic, Clinical and Applied Aspects. Cambridge: Cambridge University Press; 1990. pp. 49–122. [Google Scholar]
- Smith NP, Lamb TD. The a-wave of the human electroretinogram recorded with a minimally invasive technique. Vision Res. 1997;37:2943–2952. doi: 10.1016/s0042-6989(97)00094-1. [DOI] [PubMed] [Google Scholar]
- Steinberg RH, Frishman LJ, Sieving PA. Negative components of the electroretinogram from proximal retina and photoreceptor. Prog Retin Res. 1991;10:121–160. [Google Scholar]
- Stiles WS, Crawford BH. Report of a Joint Discussion on Vision. Cambridge: Physical Society of London. Cambridge University Press; 1932. Equivalent adaptational levels in localized retinal areas; pp. 194–211. (Reprinted in Stiles WS (1978). Mechanisms of Colour Vision. Academic, London) [Google Scholar]
- Thomas MM, Lamb TD. Light adaptation and dark adaptation of human rod photoreceptors measured from the a-wave of the electroretinogram. J Physiol. 1999;518:479–496. doi: 10.1111/j.1469-7793.1999.0479p.x. [DOI] [PMC free article] [PubMed] [Google Scholar]
- Vellani V, Reynolds AM, McNaughton PA. Modulation of the synaptic Ca2+ current in salamander photoreceptors by polyunsaturated fatty acids and retinoids. J Physiol. 2000;529:333–344. doi: 10.1111/j.1469-7793.2000.00333.x. [DOI] [PMC free article] [PubMed] [Google Scholar]
- Wässle H. Parallel processing in the mammalian retina. Nat Rev Neurosci. 2004;5:747–757. doi: 10.1038/nrn1497. [DOI] [PubMed] [Google Scholar]