

Abstract
During the second and third postnatal weeks, there is a developmental switch from sodium channel isoform Nav1.2 to isoform Nav1.6 at initial segments and nodes of Ranvier in rat retinal ganglion cells. We used quantitative, real-time PCR to determine if the developmental appearance of Nav1.6 channels is accompanied by an increase in steady-state level of Nav1.6 mRNA in the retina. Between postnatal day 2 (P2) and P10, Nav1.6 levels did not change, but between P10 and P19, there was an approximately 3-fold increase in Nav1.6 transcript levels. This coincides with the appearance of Nav1.6 channels in the retina and optic nerve. The steady-state level of Nav1.2 mRNA also increased during this same period, which suggests that the rise in Nav1.6 may be part of a general increase in sodium channel transcripts at about the time of eye-opening at P14. The results are consistent with a developmental increase in steady-state transcripts giving rise to a corresponding increase in sodium channel protein expression.
Keywords: retinal ganglion cell, sodium channels, quantitative PCR, axon initial segment, retina development
Introduction
Voltage-gated sodium (Nav) channels accumulate at high density at sites that are specialized for the initiation and conduction of action potentials, such as axon initial segments and nodes of Ranvier. In the adult nervous system, the high-density clusters of channels at both initial segments and nodes consist of a specific Nav channel isoform, Nav1.6 [1–4], but a different isoform, Nav1.2, is typically found in unmyelinated axons. This distinction is especially clear in retinal ganglion cells, whose axons are unmyelinated within the eye and then become myelinated after exiting the eye and entering the optic nerve. Nav1.2 channels are expressed uniformly along the unmyelinated intraocular axons of ganglion cells, but Nav1.6 channels are sharply restricted to the axon initial segment and nodes of Ranvier [1,2].
During myelination, Nav1.2 channels accumulate first at immature nodes of Ranvier but are replaced by Nav1.6 channels as nodes mature, which occurs during the second and third postnatal weeks in the optic nerve [1]. A similar developmental switch from Nav1.2 to Nav1.6 channels also takes place concurrently at the axon initial segments of retinal ganglion cells [2]. Prior to approximately P10, Nav1.6 immunoreactivity is undetectable in retinal ganglion cells, but by approximately P21, the adult pattern is established. Similarly, Nav1.6 channel protein levels are low in Western blots of optic nerve extracts prior to about P10, and then rise progressively to adult levels [1]. It is interesting that the developmental increase in Nav1.6 channel expression parallels the development of repetitive firing in retinal ganglion cells, which make the transition from single spikes to repetitive spikes during sustained depolarization between approximately P14 and P21 [10]. It is not yet clear, however, whether the developmental upregulation of Nav1.6 channel protein is accompanied by an increase in steady-state levels of Nav1.6 transcripts. To examine this question, we used real-time, quantitative PCR to determine relative amounts of Nav1.6 and Nav1.2 transcripts in mRNA isolated from rat retinas at various postnatal ages spanning the appearance of Nav1.6 channel protein.
Materials and methods
At each developmental age (P2, P5, P10, P19, P34, and >P60), poly-A RNA was extracted from retinas pooled from litters of rats using the Micro-Poly-A-Pure kit (Ambion), followed by DNase treatment (Ambion, RNase-free). Complementary DNA was synthesized using MultiScribe reverse transcriptase (Applied Biosystems). At each sampled age, four batches of mRNA were prepared from different litters and analyzed separately. All PCR analyses were performed in a total volume of 50 μl using the SYBR-Green PCR Master Mix and an ABI Prism 7700 Sequence Detector (Applied Biosystems). Primers selected for amplification of Nav1.6, Nav1.2, and β -actin were of equal efficiency across the range of template concentration used (1–10 ng cDNA). Amplification of β -actin served as an internal reference for each sample [8]. Reactions were performed in triplicate for each of the four samples of reverse transcribed mRNA at each developmental age, and steady-state expression levels for Nav1.2 and Nav1.6 transcripts relative to β -actin were calculated across development using the 2−Δ Δ CT method [5]. In each experiment, control reactions were included in which reverse transcriptase was omitted (−RT control) and in which no template cDNA was added to the PCR mix (no DNA control). Forward and reverse PCR primers specific for Nav1.2 and Nav1.6 alpha subunits were designed within divergent regions near the 3′ end of rat sodium channel mRNA, corresponding to the C-terminus of the protein. As shown in Figure 1, the specificity of the primers for Nav1.2 and Nav1.6 was verified by PCR from plasmids incorporating the corresponding regions of rat Nav1.1, Nav1.2, Nav1.3, and Nav1.6. The primers were: Nav1.2 forward, 5′-TCCGGTTTCGTCACGCTATC-3′; Nav1.2 reverse, 5′-TCCAGAGAAGACTGATGTGACACC-3′; Nav1.6 forward, 5′-CAAGCTGGAGAATGGAGGCA-3′; Nav1.6 reverse, 5′-TAAGAGGGGAGGGAGGCTGT-3′; β -actin forward, 5′-GAGCGCAAGTACTCTGTGTGGA-3′; β -actin reverse, 5′-TCCACATCTGCTGGAAGGTG-3′.
Figure 1.
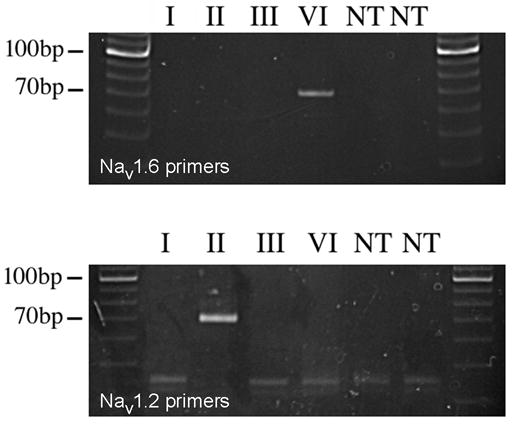
Verification of specificity of primers used for amplification of Nav1.6 and Nav1.2 cDNAs in real-time quantitative RT-PCR. The primers were tested for specificity against plasmids containing the sequence corresponding to the C-terminus of Nav1.1 (I), Nav1.2 (II), Nav1.3 (III), and Nav1.6 (VI) (cloned in PGEM or PGEX-3X vector). Control lanes marked NT represent PCR with no added template, or with undigested template. Products were run on a 10% polyacrylamide gel.
Results
Figure 2 illustrates the developmental change in steady-state levels of Nav1.6 and Nav1.2 transcripts, relative to their levels at P2. Examples of single amplification curves for the three transcripts from an individual experiment at P2 are shown in Fig. 2A. For clarity, single curves are shown, although all reactions were actually carried out in triplicate. A threshold level was set within the range of PCR cycles over which the fluorescence signal doubled for each cycle, and the threshold cycle, CT, necessary to reach threshold was determined for each reaction. After averaging the CT values across the three reactions for each amplicon, the shift in average CT (Δ CT) relative to β -actin was measured for Nav1.6 and Nav1.2. As shown in Fig. 2B, Δ CT was smaller for both Nav1.6 and Nav1.2 at P19 than at P2, which indicates an increase in steady-state levels of mRNA for both channel isoforms during developmental maturation of the retina. The change in Δ CT from P2 to P19 (i.e., Δ Δ CT; [5]) was then used to estimate the fold-change in Nav1.2 and Nav1.6 transcript levels between these two ages. Note, however, that the method does not allow conclusions regarding the amounts of Nav1.2 and Nav1.6 transcripts relative to each other.
Figure 2.

Estimation of amounts of Nav1.2 and Nav1.6 transcripts by quantitative PCR. A. Example fluorescence curves at P2, illustrating the shift in threshold cycle, Δ CT, for Nav1.6 (solid lines) and Nav1.2 (dashed lines) compared with β -actin. B. Example fluorescence curves at P19, demonstrating the developmental change in Δ CT for Nav1.2 and Nav1.6.
Figure 3 summarizes the developmental time course of the increase in mRNA levels for both Nav1.6 and Nav1.2. At P5 and P10, Nav1.6 levels were the same as at P2, but by P19, Nav1.6 mRNA increased approximately 3-fold to a level that was maintained through adulthood. This rise in Nav1.6 transcripts coincides with the appearance of Nav1.6 protein at axon initial segments and nodes of Ranvier of retinal ganglion cells [1, 2], which suggests that the increase in steady-state mRNA level gives rise to the increase in protein. The levels of Nav1.2 transcript also increased significantly between P10 and P19, which might at first seem surprising given that Nav1.6 channels replace Nav1.2 channels at initial segments and nodes of Ranvier during this period. However, Nav1.2 channels continue to be expressed in the unmyelinated axons of ganglion cells and in neurites of the inner plexiform layer throughout development, and so the steady-state level of Nav1.2 mRNA would not necessarily be expected to decline. The fact that Nav1.2 transcripts actually rose could indicate that Nav1.2 channel expression increases in these other neuronal compartments at about the time of eye opening, at P14.
Figure 3.
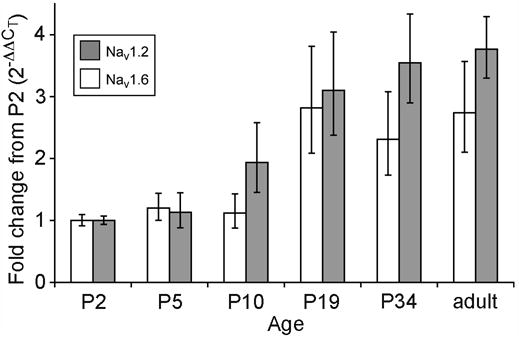
Developmental increase in steady-state levels of mRNA for Nav1.2 (white bars) and Nav1.6 (gray bars), estimated from the shift in Δ CT relative to P2. Each data point represents the mean of estimates from four RNA preparations. Error bars indicate ± 1 standard deviation. The levels for both Nav1.2 and Nav1.6 at P19, P34, and adulthood are significantly elevated compared to P2 (p < 0.03).
Discussion
Although both Nav1.2 and Nav1.6 transcripts rise in parallel after P10, prior to this period only Nav1.2 channels can be detected with immunocytochemistry or Western blots [1]. This implies that expression of Nav1.2 channels before P10 is controlled by a selective mechanism that regulates Nav1.2 only, whereas the later rise in Nav1.6 may be governed by a nonselective mechanism that upregulates multiple sodium channel isoforms, including Nav1.2. In this regard, it is interesting that Nav1.1 channels have also been reported to appear in the retina after P10 [9], consistent with a generalized mechanism controlling expression of Nav channels. In addition, the developmental period from P10 to P19 coincides with the development of the ability of rat retinal ganglion cells to fire repetitively during sustained depolarization [10], which in turn suggests that enhanced repetitive firing might result from increased expression of Nav channels in ganglion cells. However, the density of sodium current in rat ganglion cells has already reached adult levels by P12 [6, 7], and Wang et al. [10] attributed the developmental increase in repetitive firing to enhanced recovery of sodium channels from inactivation, not to an overall increase in sodium current density. Therefore, the appearance of repetitive firing after P10 seems more likely to be due to changes in isoform-specific targeting of Nav channels at important sites like the axon initial segment than to an overall increase in Nav channel expression.
Acknowledgments
Supported by NIH grant EY03821 (G.M.) and NRSA Fellowship F31 NS048762 (A.V.). We thank Diane Henry for useful discussions and technical advice, and Dr. Gail Mandel (HHMI, SUNY Stony Brook) for providing access to the quantitative, real-time PCR apparatus in her laboratory.
Footnotes
Publisher's Disclaimer: This is a PDF file of an unedited manuscript that has been accepted for publication. As a service to our customers we are providing this early version of the manuscript. The manuscript will undergo copyediting, typesetting, and review of the resulting proof before it is published in its final citable form. Please note that during the production process errors may be discovered which could affect the content, and all legal disclaimers that apply to the journal pertain.
References
- 1.Boiko T, Rasband MN, Levinson SR, Caldwell JH, Mandel G, Trimmer JS, Matthews G. Compact myelin dictates the differential targeting of two sodium channel isoforms in the same axon. Neuron. 2001;30:91–104. doi: 10.1016/s0896-6273(01)00265-3. [DOI] [PubMed] [Google Scholar]
- 2.Boiko T, Van Wart A, Caldwell JH, Levinson SR, Trimmer JS, Matthews G. Functional specialization of the axon initial segment by isoform-specific sodium channel targeting. J Neurosci. 2003;23:2306–2313. doi: 10.1523/JNEUROSCI.23-06-02306.2003. [DOI] [PMC free article] [PubMed] [Google Scholar]
- 3.Caldwell JH, Schaller KL, Lasher RS, Peles E, Levinson SR. Sodium channel Nav1.6 is localized at nodes of Ranvier, dendrites, and synapses. Proc Natl Acad Sci USA. 2000;97:5616–5620. doi: 10.1073/pnas.090034797. [DOI] [PMC free article] [PubMed] [Google Scholar]
- 4.Jenkins SM, Bennett V. Ankyrin-G coordinates assembly of the spectrin-based membrane skeleton, voltage-gated sodium channels, and L1 CAMs at Purkinje neuron initial segments. J Cell Biol. 2001;155:739–746. doi: 10.1083/jcb.200109026. [DOI] [PMC free article] [PubMed] [Google Scholar]
- 5.Livak KJ, Schmittgen TD. (2001) Analysis of relative gene expression data using real-time quantitative PCR and the 2(−Delta Delta C(T)) method. Methods. 2001;25:402–408. doi: 10.1006/meth.2001.1262. [DOI] [PubMed] [Google Scholar]
- 6.Schmid S, Guenther E. Developmental regulation of voltage-activated Na+ and Ca2+ currents in rat retinal ganglion cells. Neuroreport. 1996;7:677–681. doi: 10.1097/00001756-199601310-00070. [DOI] [PubMed] [Google Scholar]
- 7.Schmid S, Guenther E. Alterations in channel density and kinetic properties of the sodium current in retinal ganglion cells of the rat during in vivo differentiation. Neuroscience. 1998;85:249–258. doi: 10.1016/s0306-4522(97)00644-1. [DOI] [PubMed] [Google Scholar]
- 8.Suzuki T, Higgins PJ, Crawford DR. (2000) Control selection for RNA quantitation. BioTechniques. 2000;29:332–337. doi: 10.2144/00292rv02. [DOI] [PubMed] [Google Scholar]
- 9.Van Wart A, Boiko T, Trimmer JS, Matthews G. Novel clustering of sodium channel Nav1.1 with ankyrin-G and neurofascin at discrete sites in the inner plexiform layer of the retina. Mol Cell Neurosci 2005. 2005;28:661–73. doi: 10.1016/j.mcn.2004.11.012. [DOI] [PubMed] [Google Scholar]
- 10.Wang GY, Ratto G, Bisti S, Chalupa LM. (1997) Functional development of intrinsic properties in ganglion cells of the mammalian retina. J Neurophysiol. 1997;78:2895–2903. doi: 10.1152/jn.1997.78.6.2895. [DOI] [PubMed] [Google Scholar]