Abstract
The goal of this study was to investigate the binding characteristics of [11C]KR31173 and its applicability for PET studies of the AT1 receptor (AT1R).
Methods
Ex vivo biodistribution and pharmacology were tested in mice. PET imaging was performed in mice, beagle dogs, and a baboon. To assess nonspecific binding, PET imaging was performed both before and after pretreatment with a potent AT1R antagonist. In the baboon, PET imaging was also performed with the previously developed radioligand [11C]L-159,884 for comparison.
Results
Ex vivo biodistribution studies in mice showed specific binding rates of 80-90% in the adrenals, kidneys, lungs, and heart. Specific binding was confirmed in mice using small animal PET. In dogs, renal cortex tissue concentration at 75-95 min post-injection was 63 nCi/mL/mCi at a specific binding rate of 95%. In the baboon renal cortex, tissue activity at 55-75 min post injection was 345 nCi/mL/mCi. The specific binding of [11C]KR31173 was higher (81%) in the baboon than the specific binding of [11C]L-159,884 (34%).
Conclusion
[11C]KR31173 shows accumulation and significant specific binding to the AT1R in the kidneys of mice, dogs, and baboon. These findings suggest that this radioligand is suited for imaging the renal cortical AT1R in multiple species.
Keywords: Angiotensin II, AT1 receptor, PET, Kidney, Animals
1. Introduction
The angiotensin II subtype 1 receptor (AT1R) plays an essential role in the regulation of arterial blood pressure and is involved in the regulation of blood vessel contraction, water intake, renal blood flow, glomerular filtration, sodium and water reabsorption and aldosterone secretion [1]. The AT1R has been implicated in the pathogenesis of various types of arterial hypertension, although its exact role and mechanism of involvement are largely unknown [2]. Development of methods for imaging and quantification of the AT1R by PET are of potential interest since they may help investigate the regulation of this important receptor by various physiological, pharmacological and pathological stimuli. For example, the AT1R selective radioligand [11C]L-159,884 [3-5] has been used to investigate regulation of the AT1R in experimental animals for the first time in vivo. These PET studies demonstrated that increasing dietary sodium upregulates while decreasing dietary sodium downregulates canine AT1R [6]. This observation will contribute to the understanding of the role of the AT1R in sodium sensitive hypertension of humans. Another set of in vivo experiments demonstrated that estrogen deficiency upregulated while hormone replacement in estrogen deficient dogs downregulated the AT1R [7]. This observation will help elucidate the role of estrogen in the regulation of the AT1R and the relationship between hormone deficiency and arterial hypertension of the menopause.
Although animal studies have endorsed the premise that PET could be used to study the regulation of AT1R in vivo in animals, human studies have not been performed due to lack of a suitable radiopharmaceutical. Recently, a potent and selective AT1R antagonist, KR31173, has been radiolabeled with carbon-11 for PET which demonstrated promising biodistribution and pharmacological properties in mice [8]. The goal of these experiments was to investigate the in vivo binding characteristics of [11C]KR31173 and test its potential applicability in mice, dogs, and baboons.
2. Materials and Methods
2.1. Synthesis of [11C]KR31173
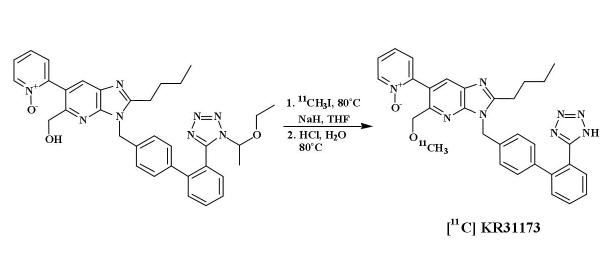
KR31173 (2-Butyl-5-methoxymethyl-6-(1-oxopyridin-2-yl)-3-[[2-(1H-tetrazol-5-yl)biphenyl-4-yl]methyl]-3H-imidazo[4,5-b]pyridine was radiolabeled by coupling a tetrazole-protected hydroxy precursor with [11C]methyl iodide and removing the protecting group by acid hydrolysis. The original procedure [8] has been modified by using anhydrous tetrahydrofuran (THF) as the reaction solvent (Scheme 1).
Scheme 1.
Synthesis of [11C]KR31173.
2.2. Ex Vivo Biodistribution and Pharmacology in Mice
Healthy male CD-1 mice (weight range 27-31 g) were housed and cared for according to the Johns Hopkins University Animal Care and Use Guidelines and governmental regulations. The animals were injected via the tail vein with 21 MBq (0.56 mCi) of [11C]KR31173 at a specific activity of 253 GBq/μmol (6,841 mCi/μmol). The injected mass was 0.04 μg. To assess the degree of specific binding and binding selectivity, the animals were pretreated 30 minutes prior to radioligand administration by intraperitoneal injection of either saline (n=4), the AT1R antagonist SK-1080 [9] (n=4), or the AT2 receptor antagonist PD123,319 (n=4). The binding affinity of KR31173 to the AT1R determined using rat liver homogenates is IC50 = 3.27 nM [8]. In comparison, the binding affinity of SK-1080 to the AT1R determined on rat liver homogenates is IC50 = 11.6 nM, while determined on human receptors it is IC50 = 1.01 nM [8]. The dose for the antagonists was 2 mg/kg administered in 0.2 mL. The mice were sacrificed by cervical dislocation 60 minutes after radioligand injection. Organs of interest (brain, heart, lungs, liver, kidneys, adrenal glands and blood) were removed and weighed and radioactivity in the tissue samples was measured in an automated gamma counter (1282 Compugamma CS Universal Gamma Counter, LKB, Wallac, Finland). Standards were prepared as aliquots of the injected activity and were counted together with the tissue samples. All measurements were corrected for background activity and for radioactive decay. Radioligand binding was expressed in percent injected dose per organ (%ID/organ) and percent injected dose per gram of tissue (%ID/g).
2.3. In Vivo Biodistribution and Pharmacology in Mice
Healthy, non-fasted, male CD-1 mice (n=13, 30-44 g) were imaged with an ‘ATLAS’ (Advanced Technology Laboratory Animal Scanner, National Institutes of Health, Bethesda, Maryland) small animal PET scanner [10]. The animals were premedicated with a mixture of ketamine - acepromazine - saline (1:1:2; 50 μL/22 g, subcutaneous), and anesthesia was maintained with isoflurane 0.5-1.0% at 0.4-1.0 L/min. Thirty minutes prior to radioligand administration, the animals were pretreated intraperitoneally with either saline (n=7) or 2 mg/kg of the AT1R antagonist SK-1080 (n=6). The animals were positioned with both kidneys in the PET scanner field of view. After injection of an average dose of 13 MBq (0.36 mCi) of [11C]KR31173 at a specific activity of 345 GBq/μmol (9,327 mCi/μmol) via the tail vein, a dynamic PET study was performed for 60 minutes with the following image sequence: four 15 sec images, three 1 min images, three 2 min images, six 5 min images and two 10 min images.
2.4. PET Imaging in Dogs
PET imaging was performed in male beagle dogs (n=3, 15.5 ± 0.5 kg) using a GE Advance PET scanner (GE Medical Systems, Milwaukee, WI). After 12 hours of fasting, the dogs were premedicated with acepromazine (0.2 mg/kg IM) and were anesthetized intravenously with sodium pentobarbital (25 mg/kg). Additional pentobarbital was administered during the imaging study at a rate of 3 mg/kg/h. The animals were intubated during the PET imaging study. Heart rate, blood pressure and oxygen saturation were monitored continuously. One femoral artery line was placed to obtain the arterial input function. Two peripheral venous lines were placed for fluid replacement, anesthesia administration and tracer injection. The kidneys were localized with a mobile ultrasound device (Ultramark 4, Advanced Technology Laboratories, Seattle, WA) and the animals were positioned with both kidneys in the PET scanner field of view. A transmission scan was obtained with a pair of 370 MBq Germanium-68 pin sources. Subsequently, two dynamic PET studies were performed with [11C]KR31173 set 135 minutes apart. The injected dose was 275 ± 58 MBq (7.43 ± 1.57 mCi) at a specific activity of 113 GBq/μmol (3,045 mCi/μmol). The first PET study was performed as a baseline scan. The purpose of the second study was to assess nonspecific binding, and for this second study the animal received 1 mg/kg of SK-1080 injected intravenously 30 minutes prior to the radiotracer. PET imaging was performed for 95 minutes with the following protocol: four 15 sec images, three 1 min images, three 2 min images, three 5 min images, three 10 min images and two 20 min images.
2.5. PET Imaging in a Baboon
Anesthesia was induced in one male Papio anubis baboon (24 kg) by intramuscular injection of 9 mg/kg Saffan (Pitman-Moore, Middlesex, U.K.) and was maintained with intravenous (IV) infusion of Saffan at a rate of 7 mg/kg/h. The animal was intubated, and heart rate, blood pressure, and oxygen saturation were continuously monitored. [11C]KR31173 was injected intravenously in an average dose of 345 MBq (9.34 mCi) at a specific activity of 291 GBq/μmol (7,865 mCi/μmol). The baboon was also imaged with [11C]L-159,884 that was injected intravenously in a dose of 530 MBq (14.3 mCi) at a specific activity of 243 GBq/μmol (6,557 mCi/μmol). The AT1R binding affinity of L-159,884 determined on rabbit aorta tissue is IC50 = 0.08 nM [3]. The two radiopharmaceuticals were tested in the same animal 2 months apart. Specific binding was measured by performing a baseline and a post SK-1080 (1 mg/kg IV) study on the same day. PET imaging was performed for 75 minutes with the following protocol: four 15 sec images, three 1 min images, three 2 min images, three 5 min images, three 10 min images and one 20 min image.
2.6. PET Image Processing
In mice, PET scans were reconstructed using the ordered subset expectation maximization (OSEM) algorithm with resolution recovery [11]. In dogs and baboons, the PET images were reconstructed by filtered-back-projection using a ramp filter. Image smoothing was applied only for display purposes. To obtain time activity curves (Tissue concentration curves), regions of interests (ROI) were marked out around the entire kidney in mice and the renal cortex in dogs and baboons. All curves were corrected for isotope decay and injected dose and were expressed in nCi/mL tissue/mCi injected dose.
For quantification of radioligand binding, an input function was obtained in dogs and baboons. Arterial blood samples (0.5 mL) were collected every 5-8 seconds during the first 2 minutes post injection and at increasing time intervals thereafter. Identical aliquots (0.2 mL) of plasma were obtained by centrifugation and were counted in a well type counter (1282 Compugamma CS Universal Gamma Counter, LKB, Wallac, Finland) cross-calibrated with the PET scanner. Additional arterial blood samples (1 mL) were collected at six time points (5, 15, 30, 45, 60 and 90 min p.i.) to measure the unmetabolized tracer fraction using high performance liquid chromatography (HPLC) of the separated plasma samples. The input function was corrected for metabolites by multiplying with the unmetabolized fraction. Since the average number of data points for the uncorrected input function was 35 compared with only 6 data points for HPLC, the unmetabolized fraction at the 35 time points was calculated by interpolation based on a bi-exponential curve fit.
2.7. Metabolism, Plasma Protein Binding and Urinary Excretion
Plasma metabolites were analyzed by a column-switch HPLC method [12]. Briefly, up to 3 mL plasma or plasma plus water was added to urea and citric acid (50 mg) to create a plasma sample in acidified 8M urea. The sample was passed through a capture column containing Oasis sorbent (Waters Corporation, Milford, MA). The parent compound and lipophilic metabolites were eluted from the capture column onto an analytical HPLC column (Prodigy C8, 4.6 × 150 mm, Phenomenex, Torrance, CA) by solvent (50% acetonitrile, 50% 100 mM triethylamine acetate buffer pH 4.1) at a flow rate of 2 mL/min. The effluents from both the capture and analytical column passed through a radiation detector. The peak areas were recorded and the fraction of total radioactivity present as the parent compound was determined.
Protein binding was assessed using dextran-coated charcoal to trap bound ligand and based on the methods described by Khurana [13] and Yuan [14]. Fifty μL of the injected tracer was added to 2.5 mL of plasma and allowed to equilibrate at room temperature for 10 min. Plasma plus tracer was rapidly added to 60 mg of dextran-coated charcoal and vortexed immediately (t=0). 200 μL samples were removed at intervals and the charcoal separated rapidly by centrifugation. Duplicate aliquots of the supernatants were counted. The time course (percent ligand bound to protein vs. time) was fitted to a bi-exponential curve extrapolated to zero time. This value represented percent bound ligand in the initial plasma. An estimate of the fraction of ligand very tightly bound was given by the percent ligand still bound to plasma after 30 min. Results of protein binding measurements were not included in tracer kinetic modeling and quantification of tracer binding.
In dogs and the baboon, a pediatric size urethra catheter was placed during the PET studies and urine was collected before radiotracer injection and for three time intervals after injection: 0-30 min, 31-60 min, and 61-90 min. Urine volume was determined and radioactivity concentration was measured with a well type gamma counter. Radioligand metabolites were determined with the HPLC method used for analysis of the plasma samples.
2.8. Quantification of Radiotracer Binding
The PET scans obtained in mice were normalized to injected dose, and the derived time activity curves were averaged between animals. Tissue concentrations measured 10-60 minutes post injection were used to assess total binding (baseline study) and nonspecific binding (post SK-1080 study). One control animal was always imaged simultaneously with a second animal that was pretreated with 2 mg/kg intraperitoneal SK-1080. The time activity curves were shifted to account for the time difference between injections.
In dogs and baboons, time activity curves and the input function were cross-calibrated. The distribution volume of the radioligand was calculated from these data using Logan's graphical method [15]. Selection of the most appropriate graphical method was based on the impulse response function that was obtained by deconvolution analysis [16]. The model was also confirmed by the fact that the Gjedde-Patlak plot resulted in an imperfect graphical fit [17,18]. Radioligand distribution volumes were expressed in mean ± standard deviation. Drug effects were tested with the simple or paired t test; P < 0.05 was considered statistically significant.
3. Results
3.1. Ex Vivo Biodistribution and Pharmacology in Mice
Sixty minutes after injection of [11C]KR31173, the tissue concentration was highest in the adrenals (27.3 ± 6.4 %ID/g) followed by the kidneys (11.3 ± 1.0 %ID/g), liver (8.9 ± 0.6 %ID/g), lungs (5.75 ± 0.5 %ID/g), and heart (2.5 ± 0.4 %ID/g) (Figure 1). No substantial tissue activity was measured in the brain, and only minimal activity was present in the blood. Pretreatment with SK-1080 significantly reduced (paired t test; p=0.0001-0.01) accumulation of the radioligand in the adrenal glands (98% inhibition), lungs (96% inhibition), heart (96% inhibition) and kidneys (82% inhibition). Thus, specific binding in these organs was over 80%. Although the activity in the liver was reduced by 33% on average, this change was not statistically significant (p=0.11). Pretreatment with PD123,319 resulted in no statistically significant change of binding in the heart, lungs, kidneys, adrenals, or liver (Figure 1).
Figure 1.
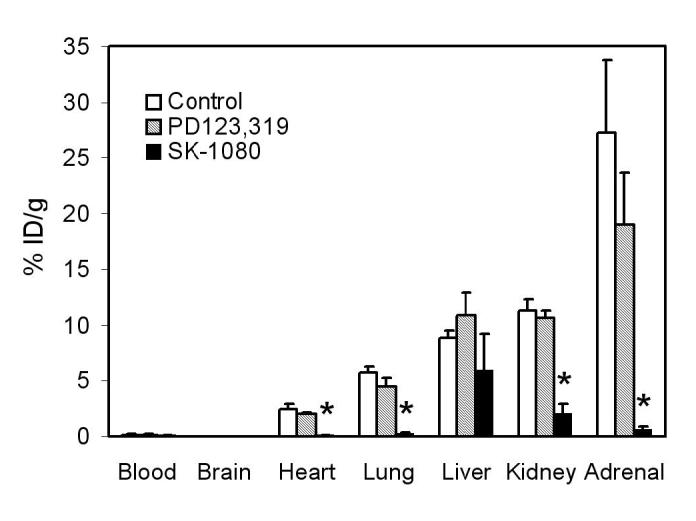
Distribution of [11C]KR31173 determined ex vivo in mice and effect of the AT1 receptor antagonist SK-1080 (2 mg/kg) and AT2 receptor antagonist PD123,319 (2 mg/kg) in various organs 60 minutes after tracer administration. Bars represent the mean ± standard deviation of % injected dose/gram tissue. Significant differences at p<0.01 are marked with a star (*).
3.2. In Vivo Biodistribution and Pharmacology in Mice
PET scans obtained in mice demonstrated distinct radioligand accumulation in the kidneys: tissue activity was high in the control animal and was reduced in the animal pretreated with SK-1080 (Figure 2). Liver activity was seen in the control animal and it appeared higher than renal activity. Time activity curves derived from the kidneys were used to calculate specific binding from the difference between the control animal and the SK-1080 treated animal. After pretreatment with SK-1080, renal uptake of the radioligand was inhibited by 49 ± 6% at 10-60 minutes.
Figure 2.
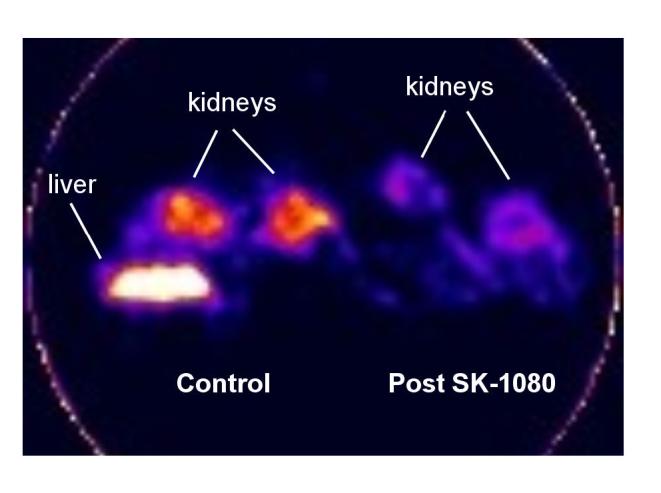
PET scan of mice acquired 50-60 min after injection of [11C]KR31173. Two mice were imaged simultaneously under isoflurane anesthesia, one control (left) and another one pretreated with SK-1080 (2 mg/kg; right). The images are calibrated for comparability purposes but not in units of radioactivity/tissue volume.
3.3. PET Imaging in Dogs
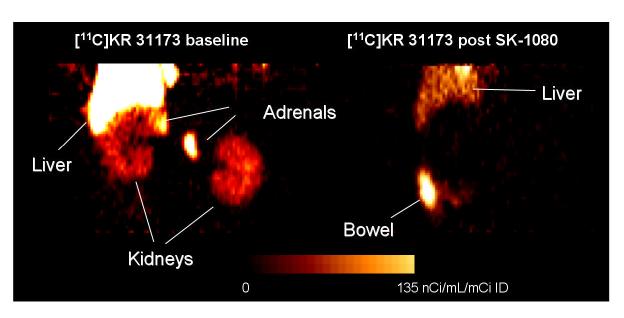
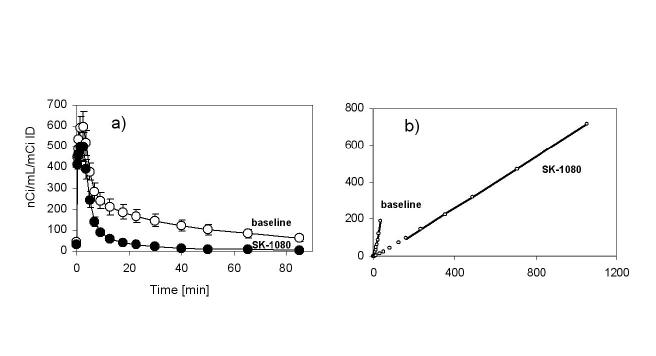
PET scans obtained 75-95 minutes post injection showed distinct accumulation of [11C]KR31173 in the canine adrenal and renal cortex. Neither the adrenals nor the renal cortex could be distinguished by PET imaging within this same time frame if the animal was pretreated with SK-1080 (Figure 3). In the control animal, activity was also seen in the liver and was higher than the activity in the kidneys. After pretreatment activity in the liver decreased and activity was observed in the bowel. Time-activity curves showed that tissue concentration of the radioligand peaked 2-3 minutes post injection at 600 nCi/mL/mCi of injected dose. This was followed by rapid decline to 40% of the peak activity within 7 min. In the remaining time of imaging, the decline was slower ending with 10% of the peak activity by 75-95 min (Figure 4). Dogs were also imaged with [11C]KR31173 prepared with the originally published method of radiosynthesis [8]. At 75-95 min post injection tissue activity was 63 nCi/mL/mCi ID and was reduced by 48% after SK-1080 pretreatment. With the present, improved radiosynthesis of [11C]KR31173, tissue concentration was very similar 75-95 min post injection (63 nCi/mL/mCi ID) but specific binding was much higher, 92% as determined after AT1R antagonist pretreatment. The difference between the baseline and post SK-1080 time-activity curves was confirmed by the Logan graphical display and by the distribution volumes. The distribution volume decreased from a baseline value of 5.71 ± 0.56 to a post SK-1080 value of 0.90 ± 0.13, corresponding to 84% specific binding. With both radiosynthesis techniques, the tissue concentration of [11C]KR31173 in the canine renal cortex was lower than the tissue concentration published for [11C]L-159,884 [5].
Figure 3.
PET images of canine upper abdomen acquired 75-95 minutes after injection of [11C]KR31173 without (left) and with (right) pre-injection of 1 mg/kg SK-1080. PET imaging was performed under sodium pentobarbital anesthesia. The animal received 7 mCi of [11C]KR31173 for the baseline scan and 6.5 mCi of [11C]KR31173 for the post-treatment scan. Coronal images were reconstructed, normalized to the injected dose and displayed together with the color calibration bar.
Figure 4a.
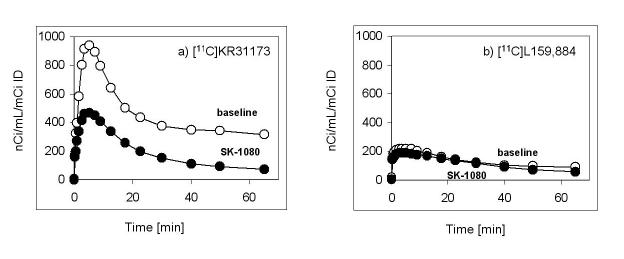
Averaged time-activity curves of [11C]KR31173 in the renal cortex of control (n=3) and SK-1080 (1 mg/kg iv.) treated (n=3) dogs.
Figure 4b Logan transformed time activity curves of the left kidney time activity curves of the first animal at baseline and post SK-1080. The distribution volume (slope) decreased from a baseline 6.29 to a post SK-1080 value of 0.70. Coordinate labels are unitless (mL distribution/mL tissue) and are not displayed.
3.4. PET Imaging in a Baboon
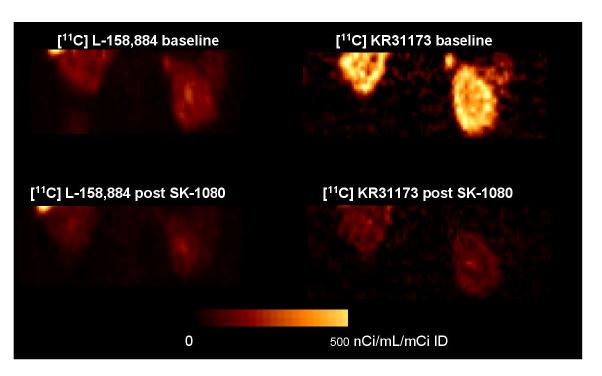
In the baboon, [11C]KR31173 resulted in considerably higher activity in the renal cortex than [11C]L-159,884 at 55-75 minutes post injection (345 nCi/cc/mCi ID and 96 nCi/cc/mCi ID, respectively). Pretreatment with SK-1080 reduced the renal cortical concentration of [11C]KR31173 by 81% and of [11C]L-159,884 by 34% (Figures 5 & 6). The tissue distribution volume obtained by the Logan graphical method confirmed the binding data derived from the time-activity curves: the distribution volume of [11C]KR31173 was approximately 8 times higher than the distribution volume of [11C]L-159,884 (13 vs. 1.5). In the baboon, specific binding estimated from the distribution volumes was also higher for [11C]KR31173 than for [11C]L-159,884 (92% vs. 12%).
Figure 5.
PET images of baboon kidneys acquired 55-75 minutes post injection of [11C]L-159,884 (left) and [11C]KR31173 (right). PET imaging was performed under Saffan anesthesia. The animal received 15 mCi and 14 mCi [11C]L-159,884 for the baseline and post-treatment scans performed 135 minutes apart. Two weeks later, baseline and post-treatment scans were acquired after injection of 8.2 and 10.5 mCi [11C]KR31173. Coronal images were reconstructed, normalized to the injected dose and displayed together with the color calibration bar.
Figure 6.
Time-activity curves of [11C]KR31173 and [11C]L-159,884 in the kidney of control and SK-1080 (1 mg/kg iv.) treated baboon.
3.5. Metabolism, Plasma Protein binding and Urinary Excretion
In dogs, the observed metabolism of [11C]KR31173 significantly decreased with the new radiosynthesis method (from ∼61% to 15% at 90 minutes, paired t test; p=0.0001). In the baboon only the new method of synthesis was used and resulted in 21% plasma metabolites 90 minutes after injection. Plasma protein binding of the both radioligands, [11C]KR31173 and [11C]L-159,884, was determined in dog, baboon, and human plasma. In plasma samples of all three species, protein binding of [11C]KR31173 obtained by extrapolation to t=0 was lower than [11C]L-159,884 (Table 1). Protein binding was lowest in dog plasma, intermediate in baboon plasma, and highest in human plasma (83%). The extent of very tight protein binding of [11C]KR31173 was low in human plasma (9%), and almost absent in baboon and dog plasma samples (1-2%). In comparison, both total protein binding and very tight protein binding of [11C]L-159,884 was high in human plasma and was also higher in baboon and dog plasma samples (Table 1). Urinary excretion of [11C]KR31173 during 90 minutes post injection was 9-12% in dogs and 12-18% in baboons. Urinary excretion was in the form of unmetabolized tracer; metabolized tracer accounted only for 2-5% of urinary activity in dogs and 6-9% of urinary activity in the baboon.
TABLE 1.
Plasma percent protein binding measured sequentially for a period of 30 minutes and extrapolated to 0 minutes of elution time.
| Species | [11C]KR31173 | [11C]L-159,884 | ||
|---|---|---|---|---|
| t = 0 min. | t = 30 min. | t = 0 min. | t = 30 min. | |
| Dog | 52 | 1 | 80 | 12 |
| Baboon | 66 | 2 | 90 | 7 |
| Human | 83 | 9 | 100 | 78 |
4. Discussion
The AT1R is the target of angiotensin II and a key molecular component of arterial blood pressure regulation. Interestingly, no studies have been conducted to investigate the modulation of this receptor in humans by drugs, hormones or physiological stimuli such as dietary sodium or its expression in various forms of arterial hypertension. Such studies will become feasible as soon as a suitable radioligand becomes available for quantitative imaging of the AT1R in humans. The presented data from biodistribution, pharmacology and small animal PET experiments in mice as well as PET imaging in dogs and baboon indicate that [11C]KR31173 can be used as a radiotracer for PET imaging of the AT1R across multiple species.
Ex vivo studies demonstrated that the uptake and retention of the radioligand correlates with the distribution of the AT1R; it is high in the mouse adrenal gland, kidney, lung, and heart. Organ to blood ratios are very high. Uptake in liver is also very high but lower than the uptake in the kidneys and adrenals. This liver uptake may be disadvantageous since it appears to be nonspecific in mice. The liver does possess angiotensin receptors [19], and 33% of [11C]KR31173 binding could be displaced by the competitive antagonist SK-1080. [11C]KR31173 does not cross the blood brain barrier and its binding to the AT1R in the brain is undetectable [8]. In none of the investigated organs was binding of [11C]KR31173 affected by the AT2 receptor antagonist PD123,319 confirming selectivity of the radioligand for the AT1R.
High specific binding in the renal cortex will permit imaging studies of the AT1R of the kidneys. Besides the adrenals and the myocardium, the kidney is probably the most important organ for the presence and role of the AT1R. Uptake in the adrenals of mice appears to be very high although accurate measurements are complicated by the small size and irregular shape of the organ. Both ex vivo and in vivo quantification will be affected by partial volume effects but in vivo measurements with PET are expected to result in an overall much stronger partial volume effect than ex vivo measurements. Of importance is the high specific binding in the myocardium (96%), albeit with 2.5% ID/g tissue the total uptake is nearly 5 times lower than the uptake in the kidneys. The high specific uptake in the heart may be utilized in the future for imaging the AT1R in ischemic and idiopathic cardiomyopathy where upregulation of the receptor has been reported [20,21]. Of particular interest for future human applications is that angiotensin II stimulates apoptosis in ischemic cardiomyopathy [22].
The small animal PET studies of mouse kidneys confirmed the results of ex vivo binding studies. Image quality was sufficient to derive time activity curves and estimate specific binding in the organ. Specific binding estimated from PET was 49% compared to over 82% estimated by ex vivo counting. The difference is attributed to the partial volume effects of the small animal PET scanner.
There is a potential saturation of the receptors in mice by the unlabeled drug during biodistribution studies. The specific activity for these injections was 6000-9000 mCi/μmol and the average injected mass was 0.025 μg or 0.00005 μmol. This corresponded to an administered dose of 0.002 μmol/kg, 1-2 orders of magnitude lower than the ED50 values of potent angiotensin receptor antagonists tested in vivo [4]. Although dose response measurements were not performed, the measured high specific binding (Figure 2) indicated that receptor saturation was likely insignificant.
To perform pharmacological and physiological perturbation studies in small animals with higher quantitative accuracy in estimating receptor binding alterations, further improvements in detector technology and image reconstruction algorithms will be valuable. Publications on partial volume correction of small animal PET images are limited [23]. These studies could be potentially interesting since transgenic mice overexpressing the human AT1R are available [24]. A clear advantage of the small animal imaging studies is that effects of different drugs or effects of different doses of the same drug can be investigated in vivo.
The quality of PET images in dogs was excellent; the radioligand concentrated predominantly in the renal cortex, just like [11C]L-159,884. Although the activity in the liver was higher than in the kidneys, both kidneys could be clearly visualized. Quantitative analysis showed that the uptake of [11C]KR31173 in the last frame (63 nCi/mL/mCi ID) was only 50% of the uptake of [11C]L-159,884 [5]. The specific binding of [11C]KR31173, however, was 92%, twice as high as the specific binding of [11C]L-159,884 [5]. Animals with appropriate sized kidneys such as dogs, swine or micro-swine represent excellent substitutes for development and testing of new image reconstruction and data analysis techniques and biological models for receptor studies. For investigations of the effects of hormones and dietary sodium on the kidneys, [11C]L-159,884 is a well suited tracer in dogs [6,7]. However, [11C]KR31173 may be preferable for immediate transition to human studies, for example, for development and testing of image reconstruction algorithms and tracer kinetic models.
There are important differences between the two radioligands. First, the in vitro receptor binding affinity of [11C]L-159,884 is higher than the affinity of [11C]KR31173. Since the dissociation of [11C]L-159,884 from the receptor is slow, its binding has been quantified by the Gjedde-Patlak graphical method [5]. For comparison with [11C]KR31173, it was quantified using the Logan plot in this work. Due to its lower receptor binding affinity, [11C]KR31173 demonstrates faster dissociation from the receptor and can be quantified by the Logan plot [15] (Figure 4b). Faster dissociation from binding sites may be advantageous for dynamic PET imaging of kidneys, heart and other organs. If the goal is to image expressing the angiotensin receptor, such as pancreatic cancer or aldosteronoma [25-27], a slower dissociation from binding sites may be desirable. Two obvious advantages of [11C]KR31173 are slow metabolism and low plasma protein binding, both lead to higher accumulation in the renal parenchyma.
High activity was observed in the dog adrenal and renal cortex, tissues which have a high density of AT1Rs. Uptake in the liver was also very high (Figure 3). The hepatobiliary system is apparently involved in the excretion of [11C]KR31173, and a significant component of radioligand accumulation in the liver parenchyma is related to this mechanism. Activity in the bowel can be considerable and correlative imaging with MRI or CT as well as application of image recovery technologies may be needed to differentiate activity in the kidneys or adrenals from activity in the liver, gall bladder or bowel. Pretreatment with SK-1080 resulted in reduced binding in the liver of dogs (Figure 3) which indicated presence of specific binding sites in the liver as well. The AT1R has been shown to be expressed in the liver of dogs and to undergo hormonal regulation in in vivo models [7]. If one could minimize hepatobiliary excretion and hepatic metabolism of a radioligand, the AT1R of the liver could also represent an interesting imaging target since AT1R antagonists have a favorable effect in ischemia reperfusion injury of the liver [28].
Dogs, baboons, and probably pigs can be used as animal models for human AT1R imaging since, in contrast to rodents in which two subtypes, AT1a and AT1b, have been discovered, dogs, baboons and pigs, like humans, possess only one subtype of these receptors, i.e., AT1R. The PET images showed high [11C]KR31173 binding in the adrenal glands of dogs and a baboon, confirming the ex vivo binding studies performed in mice. The adrenals have a very high density of the AT1R which also undergoes hormonal regulation [7,29] and is involved in the regulation of the biosynthesis and secretion of aldosterone [30-33]. Of potential interest for imaging studies is the application of AT1R PET in aldosterone producing tumors. In aldosterone producing adrenocortical adenomas, the AT1R is co-expressed with the adrenocorticotropic hormone (ACTH) receptor and expression of both receptors correlates with the functional status of the adenoma. The predominant angiotensin II receptor expressed in adrenocortical tumors is the AT1R whereas AT2 receptor expression is minimal [34].
[11C]KR31173 showed higher uptake and higher specific binding in the baboon kidney than in dogs. On the other hand, [11C]L-159,884 showed only modest uptake in the primate kidney. Thus, [11C]KR31173 is a promising radioligand for future PET studies in non-human primates as well as in humans. In all tested animal species [11C]KR31173 exhibits lower protein binding and a smaller fraction of tightly bound ligand than [11C]L-159,884 which makes more free radioligand available to reach the AT1R via circulation. Indeed, in the baboon [11C]KR31173 showed higher uptake and more specific binding in correlation with its lower protein binding when compared to [11C]L-159,884.
5. Conclusion
Biodistribution and pharmacological testing in mice as well as PET imaging in mice, dogs and baboons indicate that [11C]KR31173 can be used as a radiotracer for PET imaging of the AT1 receptor. Its binding is selective with a high specific binding component across species. High uptake in the baboon renal cortex and adrenal indicate that this tracer has the potential to be used in human PET studies of the AT1R. Potential applications include the investigation of regulatory effects of dietary sodium intake, hormone replacement therapy, and alterations of the AT1R in renovascular hypertension, essential hypertension, and aldosterone producing adenomas.
Acknowledgments
This study was supported by NIH grant # RO1 DK50183 (P.I. Zsolt Szabo), by the Interdisciplinary Small Animal Imaging for Oncology grant # 5R24CA092871 (P.I. Martin G. Pomper), and by a grant from the Center for Biological Modulators/KRICT Taejeon Korea (P.I. Kathryn Sandberg). Preparation of animals, monitoring, and postprocedural care by Paige Rauseo are appreciated. This work was also made possible by the contributions of the personnel of the PET center (David Clough, Karen Edmonds, Michael Hans, and Robert Smoot) and the small animal PET center (James Fox, Yuchuan Wang, and Catherine A. Foss). We also appreciate the considerable editorial support by Mrs. Judy Buchanan.
Footnotes
Publisher's Disclaimer: This is a PDF file of an unedited manuscript that has been accepted for publication. As a service to our customers we are providing this early version of the manuscript. The manuscript will undergo copyediting, typesetting, and review of the resulting proof before it is published in its final citable form. Please note that during the production process errors may be discovered which could affect the content, and all legal disclaimers that apply to the journal pertain.
References
- 1.Kim S, Iwao H. Molecular and cellular mechanisms of angiotensin II-mediated cardiovascular and renal diseases. Pharmacol Rev. 2000;52:11–34. [PubMed] [Google Scholar]
- 2.Goodfriend TL. Angiotensin receptors: history and mysteries. Am J Hypertens. 2000;13:442–449. doi: 10.1016/s0895-7061(99)00212-5. [DOI] [PubMed] [Google Scholar]
- 3.Hamill TG, Burns HD, Dannals RF, Mathews WB, Musachio JL, Ravert HT, Naylor EM. Development of [11C]L-159,884: a radiolabelled, nonpeptide angiotensin II antagonist that is useful for angiotensin II, AT1 receptor imaging. Appl Radiat Isot. 1996;47:211–218. doi: 10.1016/0969-8043(95)00273-1. [DOI] [PubMed] [Google Scholar]
- 4.Kim SE, Scheffel U, Szabo Z, Burns HD, Gibson RE, Ravert HT, Mathews WB, Hamill TG, Dannals RF. In vivo labeling of angiotensin II receptors with a carbon-11-labeled selective nonpeptide antagonist. J Nucl Med. 1996;37:307–311. [PubMed] [Google Scholar]
- 5.Szabo Z, Kao PF, Burns HD, Gibson RE, Hamill TG, Ravert HT, Kim SE, Mathews WB, Musachio JL, Scheffel U, Dannals RF. Investigation of angiotensin II/AT1 receptors with carbon-11-L-159,884: a selective AT1 antagonist. J Nucl Med. 1998;39:1209–1213. [PubMed] [Google Scholar]
- 6.Szabo Z, Speth RC, Brown PR, Kerenyi L, Kao PF, Mathews WB, Ravert HT, Hilton J, Rauseo P, Dannals RF, Zheng W, Lee S, Sandberg K. Use of positron emission tomography to study AT1 receptor regulation in vivo. J Am Soc Nephrol. 2001;12:1350–1358. doi: 10.1681/ASN.V1271350. [DOI] [PubMed] [Google Scholar]
- 7.Owonikoko TK, Fabucci ME, Brown PR, Nisar N, Hilton J, Mathews WB, Ravert HT, Rauseo P, Sandberg K, Dannals RF, Szabo Z. In vivo investigation of estrogen regulation of adrenal and renal angiotensin AT1 receptor expression by PET. J Nucl Med. 2003;45:94–100. [PMC free article] [PubMed] [Google Scholar]
- 8.Mathews WB, Yoo SE, Lee SH, Scheffel U, Rauseo PA, Zober TG, Gocco G, Sandberg K, Ravert HT, Dannals RF, Szabo Z. A novel radioligand for imaging the AT1 angiotensin receptor with PET. Nucl Med Biol. 2004;31:571–574. doi: 10.1016/j.nucmedbio.2003.10.014. [DOI] [PubMed] [Google Scholar]
- 9.Hong KW, Kim CD, Lee SH, Yoo SE. The in vitro pharmacological profile of KR31080, a nonpeptide AT1 receptor antagonist. Fundam Clin Pharmacol. 1998;12:64–69. doi: 10.1111/j.1472-8206.1998.tb00925.x. [DOI] [PubMed] [Google Scholar]
- 10.Shimoji K, Ravasi L, Schmidt K, Soto-Montenegro ML, Esaki T, Seidel J, Jagoda E, Sokoloff L, Green MV, Eckelman WC. Measurement of cerebral glucose metabolic rates in the anesthetized rat by dynamic scanning with 18F-FDG, the ATLAS small animal PET scanner, and arterial blood sampling. J Nucl Med. 2004;45:665–672. [PubMed] [Google Scholar]
- 11.Yao R, Seidel J, Johnson CA, Daube-Witherspoon ME, Green MV, Carson RE. Performance characteristics of the 3-D OSEM algorithm in the reconstruction of small animal PET images. Ordered-subsets expectation-maximixation. IEEE Trans Med Imaging. 2000;19:798–804. doi: 10.1109/42.876305. [DOI] [PubMed] [Google Scholar]
- 12.Hilton J, Yokoi F, Dannals RF, Ravert HT, Szabo Z, Wong DF. Column-switching HPLC for the analysis of plasma in PET imaging studies. Nuclear Medicine and Biology. 2000;27:627–630. doi: 10.1016/s0969-8051(00)00125-6. [DOI] [PubMed] [Google Scholar]
- 13.Khurana M, Paliwal JK, Kamboj VP, Gupta RC. Binding of centchroman with human serum as determined by charcoal adsorption method. Int J Pharm. 1999;192:109–114. doi: 10.1016/s0378-5173(99)00304-x. [DOI] [PubMed] [Google Scholar]
- 14.Yuan JH, Yang DC, Birkmeier J, Stolzenbach J. Determination of Protein-Binding by InVitro Charcoal Adsorption. Journal of Pharmacokinetics and Biopharmaceutics. 1995;23:41–55. doi: 10.1007/BF02353785. [DOI] [PubMed] [Google Scholar]
- 15.Logan J, Fowler JS, Volkow ND, Wolf AP, Dewey SL, Schlyer DJ, MacGregor RR, Hitzemann R, Bendriem B, Gatley SJ. Graphical analysis of reversible radioligand binding from time-activity measurements applied to [N-11C-methyl]-(−)-cocaine PET studies in human subjects. J Cereb Blood Flow Metab. 1990;10:740–747. doi: 10.1038/jcbfm.1990.127. [DOI] [PubMed] [Google Scholar]
- 16.Szabo Z, Vosberg H, Sondhaus CA, Feinendegen LE. Model identification and estimation of organ-function parameters using radioactive tracers and the impulse-response function. European Journal of Nuclear Medicine. 1985;11:265–274. doi: 10.1007/BF00279082. [DOI] [PubMed] [Google Scholar]
- 17.Gjedde A, Wong DF, Wagner HN. Transient analysis of irreversible and reversible tracer binding in human brain. In: Battistin L, Gerstenbrand F, editors. PET and NMR. New perspectives in neuroimaging and in clinical neurochemistry. Alan R. Liss, INC.; New York: 1985. pp. 223–235. [Google Scholar]
- 18.Patlak CS, Blasberg RG, Fenstermacher JD. Graphical evaluation of blood-to-brain transfer constants from multiple-time uptake data. J Cereb Blood Flow Metab. 1983;3:1–7. doi: 10.1038/jcbfm.1983.1. [DOI] [PubMed] [Google Scholar]
- 19.Vandekerckhove A, Keppens S, De Wulf H. The angiotensin II receptor of rabbit liver: characterization in isolated hepatocytes and effect of GTP. J Endocrinol. 1989;123:131–136. doi: 10.1677/joe.0.1230131. [DOI] [PubMed] [Google Scholar]
- 20.Anversa P, Leri A, Li B, Liu Y, Di Somma S, Kajstura J. Ischemic cardiomyopathy and the cellular renin-angiotensin system. J Heart Lung Transplant. 2000;19:S1–11. doi: 10.1016/s1053-2498(99)00111-4. [DOI] [PubMed] [Google Scholar]
- 21.Ohtani S, Fujiwara H, Hasegawa K, Doyama K, Inada T, Tanaka M, Fujiwara T, Sasayama S. Up-regulated expression of angiotensin II type 1 receptor gene in human pathologic hearts. J Card Fail. 1997;3:303–310. doi: 10.1016/s1071-9164(97)90030-0. [DOI] [PubMed] [Google Scholar]
- 22.Gonzalez A, Lopez B, Ravassa S, Querejeta R, Larman M, Diez J, Fortuno MA. Stimulation of cardiac apoptosis in essential hypertension: potential role of angiotensin II. Hypertension. 2002;39:75–80. doi: 10.1161/hy0102.100788. [DOI] [PubMed] [Google Scholar]
- 23.Green LA, Nguyen K, Berenji B, Iyer M, Bauer E, Barrio JR, Namavari M, Satyamurthy N, Gambhir SS. A Tracer Kinetic Model for 18F-FHBG for Quantitating Herpes Simplex Virus Type 1 Thymidine Kinase Reporter Gene Expression in Living Animals Using PET. J Nucl Med. 2004;45:1560–1570. [PubMed] [Google Scholar]
- 24.Paradis P, Dali-Youcef N, Paradis FW, Thibault G, Nemer M. Overexpression of angiotensin II type I receptor in cardiomyocytes induces cardiac hypertrophy and remodeling. Proc Natl Acad Sci U S A. 2000;97:931–936. doi: 10.1073/pnas.97.2.931. [DOI] [PMC free article] [PubMed] [Google Scholar]
- 25.Fujimoto Y, Sasaki T, Tsuchida A, Chayama K. Angiotensin II type 1 receptor expression in human pancreatic cancer and growth inhibition by angiotensin II type 1 receptor antagonist. FEBS Lett. 2001;495:197–200. doi: 10.1016/s0014-5793(01)02377-8. [DOI] [PubMed] [Google Scholar]
- 26.Maluccio M, Sharma V, Lagman M, Konijn G, Suthanthiran M. Angiotensin II receptor blockade: a novel strategy to prevent immunosuppressant-associated cancer progression. Transplant Proc. 2001;33:1820–1821. doi: 10.1016/s0041-1345(00)02696-8. [DOI] [PubMed] [Google Scholar]
- 27.Smith GR, Missailidis S. Cancer, inflammation and the AT1 and AT2 receptors. J Inflamm (Lond) 2004;1:3. doi: 10.1186/1476-9255-1-3. [DOI] [PMC free article] [PubMed] [Google Scholar]
- 28.Masuko H, Jin MB, Horiuchi H, Suzuki T, Taniguchi M, Shimamura T, Fukai M, Magata S, Ogata K, Ishikawa H, Fujita M, Nagashima K, Furukawa H, Todo S. Protective effect of agiotensin II type I receptor antagonist, CV-11974, on ischemia and reperfusion injury of the liver. Transplantation. 2001;71:1034–1039. doi: 10.1097/00007890-200104270-00003. [DOI] [PubMed] [Google Scholar]
- 29.Wu Z, Maric C, Roesch D, Zheng W, Verbalis JG, Sandberg K. Estrogen regulates adrenal angiotensin type 1 receptors by modulating AT1 receptor translation. Endocrinology. 2003;144:3251–3261. doi: 10.1210/en.2003-0015. [DOI] [PubMed] [Google Scholar]
- 30.Aguilera G. Role of angiotensin II receptor subtypes on the regulation of aldosterone secretion in the adrenal glomerulosa zone in the rat. Mol Cell Endocrinol. 1992;90:53–60. doi: 10.1016/0303-7207(92)90101-b. [DOI] [PubMed] [Google Scholar]
- 31.Giacchetti G, Opocher G, Sarzani R, Rappelli A, Mantero F. Angiotensin II and the adrenal. Clin Exp Pharmacol Physiol Suppl. 1996;3:S119–S124. [PubMed] [Google Scholar]
- 32.McCaa RE. Role of the renin-angiotensin system in the regulation of aldosterone biosynthesis and arterial pressure during sodium deficiency. Circulation Research. 1977;40:I157–I162. [PubMed] [Google Scholar]
- 33.Tanabe A, Naruse M, Arai K, Naruse K, Yoshimoto T, Seki T, Imaki T, Miyazaki H, Zeng ZP, Demura R, Demura H. Gene expression and roles of angiotensin II type 1 and type 2 receptors in human adrenals. Horm Metab Res. 1998;30:490–495. doi: 10.1055/s-2007-978918. [DOI] [PubMed] [Google Scholar]
- 34.Schubert B, Fassnacht M, Beuschlein F, Zenkert S, Allolio B, Reincke M. Angiotensin II type 1 receptor and ACTH receptor expression in human adrenocortical neoplasms. Clin Endocrinol (Oxf) 2001;54:627–632. doi: 10.1046/j.1365-2265.2001.01253.x. [DOI] [PubMed] [Google Scholar]


