SYNOPSIS
Objective
The purpose of this study was to measure state trends in educational inequalities in smoking, binge alcohol use, physical inactivity, obesity, and seatbelt use.
Methods
The authors calculated the Relative Concentration Index of educational inequality for five health behaviors on adults from all 50 states and the District of Columbia using data from 1990 to 2004 in the Behavioral Risk Factor Surveillance System (n=2,118,562). Linear regression was used to measure changes and trends in the Relative Concentration Index of health inequality across education groups in each state.
Results
Except for binge alcohol use, poorer health behaviors were concentrated among the less educated. The largest educational inequalities were for physical inactivity. From 1990 to 2004, significant increases in relative educational inequalities occurred in 40 states for smoking and 31 states for physical inactivity. For binge alcohol use, 27 states showed significant declining inequality trends, but educational inequalities reversed direction and binge alcohol use is now more prevalent among the less educated in 19 states. Significant decreases in educational inequalities occurred in 36 states for obesity and 24 states for seat belt use. Changes in educational inequalities across the different health behaviors were not associated, except for a modest correlation between changes in inequality in smoking and binge alcohol use (r=0.40; p=0.004). Similarly, there was little association between changes in the population prevalence of health behaviors and changes in educational inequality in health behaviors, with substantial heterogeneity among states.
Conclusions
State trends in relative educational inequality among health behaviors were mixed, increasing for smoking and physical inactivity and decreasing for obesity and seat belt use. The factors influencing relative inequality trends may differ from those affecting overall prevalence trends.
The two overarching national public health goals of the United States are to increase healthy life expectancy at all ages and to eliminate health inequalities according to gender, race or ethnicity, education or income, disability status, geographic location, and sexual orientation.1 These dual public health goals are meant to serve as a blueprint for improving the overall health of the nation and have a strong influence on shaping state and local public health policy. A number of states and municipal public health agencies have adopted a similar dual-goal framework for assessing health progress.2–4 Timely and accurate monitoring of progress towards public health goals is thus an important part of public health surveillance.5
A previous report assessed state trends in the overall prevalence of adult health risk behaviors and found that trends in cigarette smoking, binge alcohol use, physical inactivity, and obesity were discouraging, while the prevalence of safety belt use generally increased.6 This study provides a parallel assessment of progress among states toward achieving the goal of eliminating socioeconomic health inequalities. Socioeconomic position, as often measured in the United States by income or education,7 is an important source of health inequalities,8 and a greater understanding of the factors that contribute to socioeconomic differences in health would enhance policy efforts to improve overall health.9 In addition, if meaningful heterogeneity exists among state trends, it may generate hypotheses as to why some states have been more or less successful in reducing socioeconomic inequalities in health behaviors.
We also examined associations between changes in overall prevalence and changes in inequality in behaviors because it is possible that some tension may exist between the goal of improving average health and eliminating health inequalities.10,11 Health inequalities could decline if health improves among the disadvantaged and worsens among the advantaged, but such a change might also lead to declines in average health. Thus, while the major aim of this study was to provide an assessment of trends in socioeconomic inequalities in health behaviors, we also attempted to evaluate the simultaneous progress toward improved average health and reduced health inequalities.
METHODS
Data
We used data from the Behavioral Risk Factor Surveillance System (BRFSS) for the period 1990–2004. Details of the design and methodology of the BRFSS have been published elsewhere.6,12–14 Briefly, the BRFSS is an ongoing random-digit dialed telephone survey conducted monthly within each state, the results of which are compiled by the Centers for Diseases Control and Prevention (CDC). A systematic review of methodological studies concluded that most measures in the BRFSS are reliable and valid,15 and there generally is agreement between aggregate BRFSS data and data from national surveys.16 Despite its drawbacks as a telephone survey, the BRFSS nevertheless represents one of the only routinely collected sources of health data that is representative of U.S. states, and is virtually the only data for monitoring state trends in health inequalities across a range of health outcomes.
Measurement of socioeconomic position and health behaviors.
Socioeconomic position was measured by years of completed education. We categorized individuals as having completed <12 years, 12 years, 13–15 years, or 16 or more years. Because younger individuals may not have had the opportunity to complete their education, the analysis was restricted to individuals aged 25 and older. After excluding those with missing information on education, the overall sample size increased from 72,432 in 1990 to 276,051 in 2004, with state-specific sample sizes ranging from 736 for Louisiana in 1990 to 17,164 for Washington in 2004.
The outcomes considered were the proportion of individuals aged 25 and older who reported: (1) ever smoking ≥100 cigarettes and who currently smoked cigarettes every day or some days (current smoking), (2) consuming five or more drinks at least once in the past month (binge alcohol use), (3) a body mass index (BMI) of ≥30 kg/m2 (obesity), (4) participating in no leisure time physical activity in the past month (physical inactivity), and (5) not always wearing a seat belt when driving or riding in a car (no seat belt use).
Questions on current smoking and obesity were asked in all years, questions about binge drinking were not included in even-numbered years from 1994–2000, questions about physical activity were not included in odd-numbered years from 1993–1999, and questions about seat belt use were included in 1990–1993, 1995, 1997, and 2002. Virtually all states and the District of Columbia (n=45) participated in 1990, but Alaska, Arkansas, and New Jersey began participating in 1991, Nevada and Kansas in 1992, and Wyoming in 1994.
Measurement of health inequality.
Health inequalities are typically expressed using a rate ratio comparing the health of the lowest- and highest-ranked groups, but this ignores groups in the middle and cannot account for changes in the population distribution of socioeconomic position over time.17 Secular improvements in education mean that the proportion of the population exposed to having less than a high school education has declined over time, and it is important to account for this when assessing changes in the population health impact of health inequalities.18 To overcome these limitations we used a summary measure of health inequality across all education groups, the Relative Concentration Index19 (RCI), which has been used internationally,20–23 but rarely applied to U.S. data.24,25 The RCI summarizes the disproportionality between each socioeconomic group's population share and their share of the total cases of each health behavior, with negative values indicating concentration among the worse off and positive values indicating concentration among the better off. The RCI may be written11 as ∑j=1J pjrj(qj − Qj), where j indexes educational groups, pj is the proportion of total population in group j, rj is the ratio of the prevalence in group j to the prevalence in the total population, qj is the proportion of the population less educated than group j, and Qj is the proportion of the population more educated than group j (so that pj + qj + Qj = 1).
If the health variable is continuous, the RCI ranges from −1 to 1 and equals 0 when health is equally distributed. However, when the outcome is binary, such as whether or not an individual smokes, the minimum and maximum values of the RCI are bound by the overall prevalence of the outcome, with higher prevalence rates narrowing the possible range of the RCI.26 This has implications for comparing the level of and trend in inequality across both states and health behaviors that may differ widely in overall prevalence. Thus, in order to facilitate the comparison of changes in inequality across states and across health behaviors with very different prevalence rates, the RCI is expressed as a percentage of its maximum value.26 Dividing the RCI by its maximum value necessarily generates positive percentages, regardless of the direction of the socioeconomic gradient, so for cases where risky behaviors are concentrated among the better educated the index is multiplied by −1.
Statistical analysis.
Sample weights that account for survey nonresponse and the unequal probability of selection were used in estimating the prevalence of each outcome for education groups. To minimize year-to-year fluctuations in the prevalence estimates for socioeconomic subgroups, we used a nonparametric local regression smoothing technique27 to generate smoothed prevalence estimates. The regression model used a quadratic fit over the span of calendar years and was weighted by the sample size of each year-state-education group. We then used the smoothed prevalence rates for each socioeconomic group to calculate the RCI for each state and year. We evaluated trends in socioeconomic inequality using separate linear regressions for each state, with the dependent variable as the RCI (percentage of maximum value). Based on visual inspections of the inequality trends and the previous finding of nonlinear trends in overall prevalence,6 a model was fit using both year and year2 terms. We then used the coefficients from the model to predict the RCI for each state for the first and last year of observed data. For seat belt use, Wyoming had only three data points (1995, 1997, 2002), so the year2 term was not included for this regression.
RESULTS
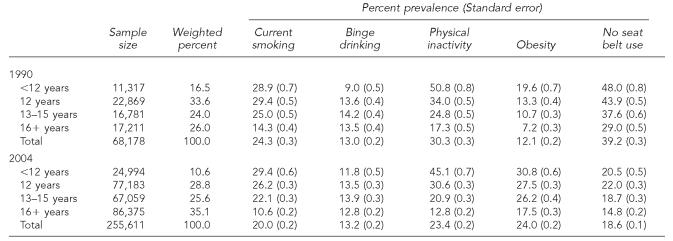
Table 1 shows the overall prevalence of health behaviors for educational groups in 1990 and 2004. With the exception of binge alcohol use, prevalence rates tended to be higher among the less educated groups for all health behaviors.
Table 1.
Prevalence of selected health behaviors among adults aged 25 and older by years of education, 1990 and 2004, Behavioral Risk Factor Surveillance System
NOTES: Latest estimate for not always wearing a seat belt was 2002; standard errors account for complex design of the BRFSS sample.
State trends in inequality of health behaviors.
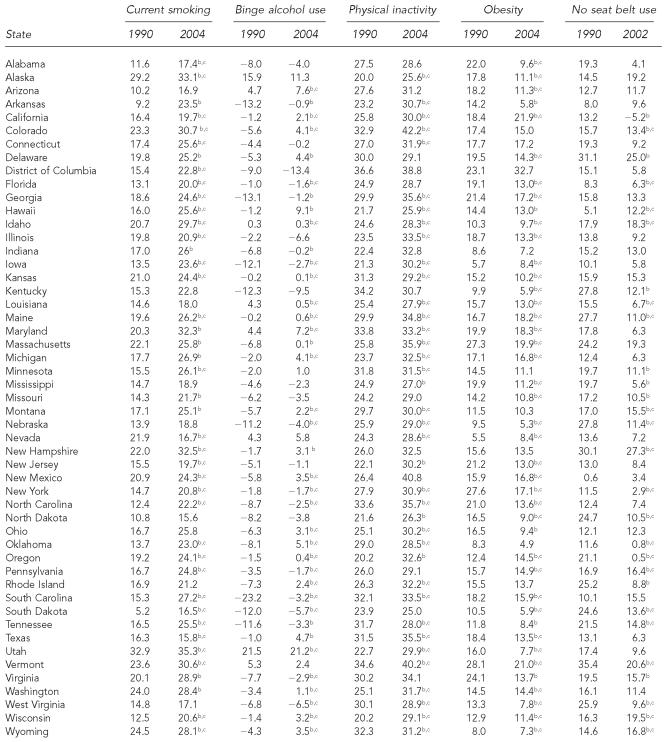
The model-based estimates of inequality in 1990 and 2004 for each of the five outcomes are presented for each state in Table 2. Most states (78.4%) showed statistically significant trends toward increasing relative socioeconomic inequality in current smoking. The median RCI for smoking increased from 16.7% of its maximum value to 24.3%. For the median state in 2004, this means that the distribution of smoking is roughly one-quarter the maximum feasible amount of inequality that would occur if, conditional on the overall prevalence, all of the smokers were concentrated in the lowest educational stratum.26 Two states, Texas and Nevada, showed statistically significant declining inequality trends for smoking. Inequalities in binge alcohol use were smaller than for other behaviors, and in 1990 binge alcohol use was slightly more concentrated among the better educated (median RCI=−4.6%). By 2004 this pattern had changed to one of virtually no socioeconomic inequality on average (median RCI=0.3%). Based on the magnitude of estimated inequality in 1990 and 2004, 27 states showed improving trends in socioeconomic inequality and 11 states showed significantly worsening trends. Notably, among states showing statistically significant trends, 19 indicated a reversal of socioeconomic inequality such that binge drinking became more concentrated among the less educated. Socioeconomic inequality trends in physical inactivity generally mirrored those for smoking with a trend toward increasing socioeconomic inequality, though the number of states with significant increasing trends in inequality (n=31) was fewer than for smoking (n=40). Obesity showed the most favorable trends with respect to relative socioeconomic inequality, with significant decreasing trends in 36 states and increasing trends in six states. Seat belt use also showed favorable inequality trends, with the median RCI decreasing from 16.2% to 10.9% of maximum inequality and only four states showing significantly worsening trends in inequality.
Table 2.
Model-based estimates of socioeconomic inequalitya trends in health behaviors, 1990–2004
Inequality expressed as proportion of maximum possible value of the Relative Concentration Index. Positive values indicate that inequality favors the better educated, and negative values indicate that inequality favors the less educated.
Trend is statistically significant at the p<0.05 level.
Non-linear trend
Improved indicates statistically significant trends of increasing relative inequality.
Worsened indicates statistically significant trends of decreasing inequality.
With the exception of a positive correlation between inequality changes in smoking and binge drinking (r=0.40; p=0.004), changes in inequality were independent across the five health behaviors (results not shown). That is, states with larger inequality increases in one behavior were unlikely to also have larger increases or decreases in inequality for other behaviors.
Inequality trends and trends in overall prevalence.
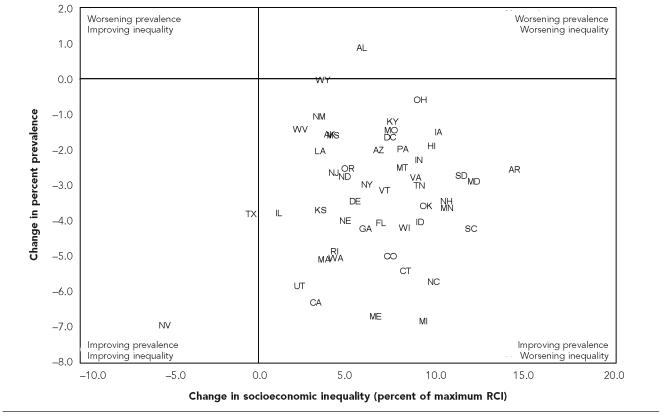
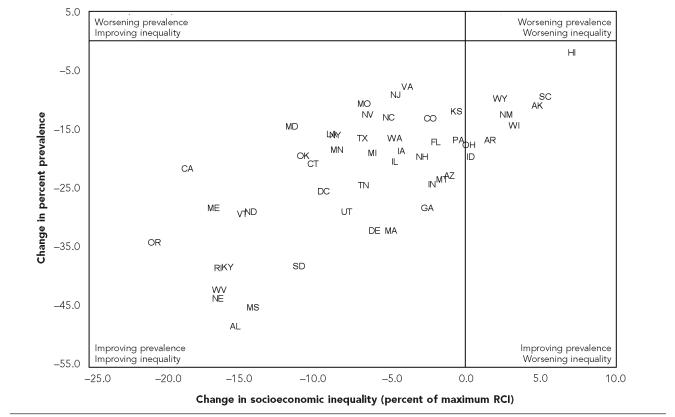
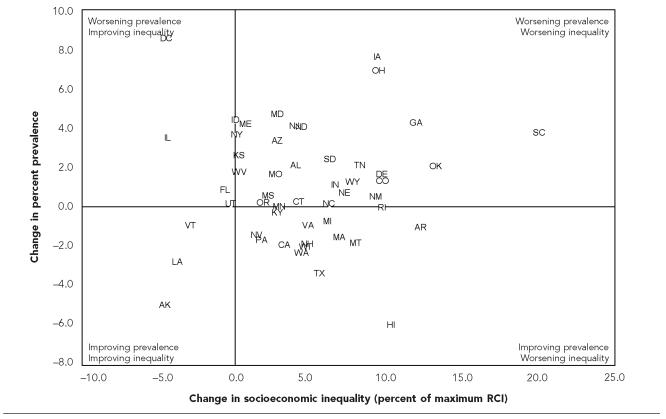
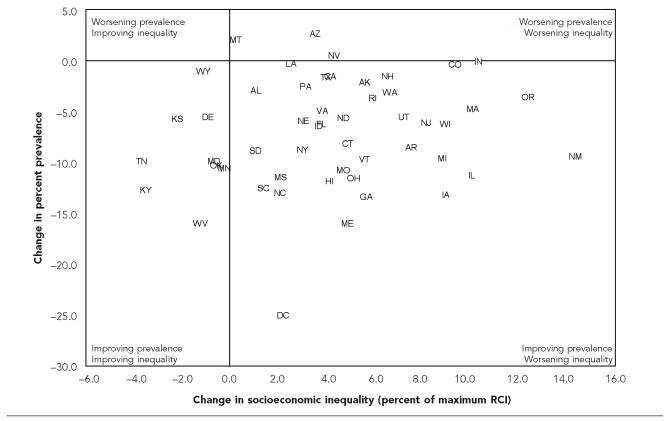
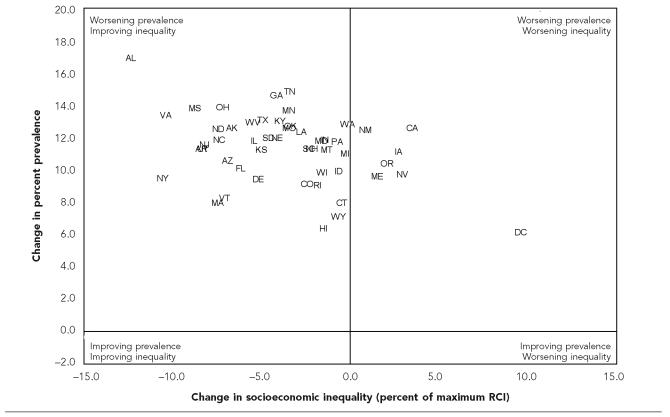
Figures 1 through 5 plot changes in overall prevalence (y-axis) against changes in socioeconomic inequality (x-axis) for each of the five outcomes. The four quadrants correspond to four possible scenarios for changes in average prevalence and socioeconomic inequality.28 For current smoking (Figure 1), virtually all states showed declines in the average prevalence of smoking and widening socioeconomic inequalities (i.e., relative improvement for the better educated). However, a handful of states (California, Maine, Massachusetts, Rhode Island, Utah, Washington) showed strong declines in average smoking and noticeably smaller increases in inequality. The pattern for binge alcohol use was much more diverse, with several states in each of the four quadrants (Figure 2). Alaska, Louisiana, and Vermont achieved both declining prevalence and narrowing inequality in binge alcohol use, but many more states showed the exact opposite pattern of rising average prevalence and worsening inequality. Changes in physical inactivity were similar to those for smoking, with most states showing declining prevalence of inactivity but increasing socioeconomic inequalities, though nine states saw declines in inequality while also decreasing overall prevalence (Figure 3). The District of Columbia, despite having one of the highest levels of inequality in 1990 (36.6% of the maximum RCI) and in 2004 (38.8%), achieved a large reduction in the overall prevalence of inactivity (48.2% in 1990, 23.0% in 2004), which was likely influenced by a substantial increase in the proportion of college graduates (29% in 1990, 49% in 2004), for whom the prevalence of inactivity is much lower. The plot for changes in obesity (Figure 4) shows all states experienced increases in the prevalence of obesity, but in most states socioeconomic inequalities declined. However, a small number of states experienced the worst possible outcome: rising obesity and widening socioeconomic inequalities. Changes in seat belt use were very positive, with all states showing declines in the prevalence of not always wearing a seat belt, and 42 states achieving the best possible outcome of declining average prevalence and declining socioeconomic inequalities (Figure 5).
Figure 1.
Changes in overall prevalence and relative socioeconomic inequality in current smoking among U.S. states, 1990–2004
Figure 5.
Changes in overall prevalence and relative socioeconomic inequality in the proportion of individuals who do not always wear a seat belt among U.S. states, 1990–2002
Figure 2.
Changes in overall prevalence and relative socioeconomic inequality in binge alcohol use among U.S. states, 1990–2004
Figure 3.
Changes in overall prevalence and relative socioeconomic inequality in physical inactivity among U.S. states, 1990–2004
Figure 4.
Changes in overall prevalence and relative socioeconomic inequality in obesity among U.S. states, 1990–2004
State-level changes in overall prevalence were not correlated with changes in inequality for current smoking, binge alcohol use, or physical inactivity (results not shown), but there was a weak negative correlation for obesity (r=−0.31; p=0.03) and a strong positive correlation for seat belt use (r=0.65; p<0.0001) such that states with the largest declines in the prevalence of not always wearing a seat belt use also tended to have the largest declines in socioeconomic inequality.
DISCUSSION
This analysis shows a heterogeneous picture for state trends in relative socioeconomic inequalities in health behaviors. Inequalities generally favored the better educated and widened for current smoking and physical inactivity, but narrowed for obesity and seat belt use. On the other hand, binge drinking was more concentrated among the better educated in 1990, but socioeconomic inequality declined and by 2004 there was little socioeconomic inequality in binge drinking on average.
Based on the inequality trends alone, it might be concluded that trends for binge drinking, obesity, and seat belt use were desirable, and trends for smoking and physical activity undesirable. However, when examined from the perspective of the dual-goal framework for population health—considering changes in both inequality and overall prevalence—the results are more ambiguous. Increasing inequality for smoking and physical inactivity occurred as the overall prevalence was declining, while the inequality declines in binge drinking and obesity occurred in the context of worsening overall prevalence, especially for obesity. The only behavior for which the all-things-considered trend could be characterized as unambiguously positive was seat belt use. All states showed declines in the prevalence of not always wearing a seat belt, and virtually all states showed declines in inequality as well. Moreover, states with the largest declines in overall prevalence also showed the largest declines in inequality, a pattern not observed for other behaviors.
Smoking.
State trends in current smoking inequalities were the probably the least favorable among the behaviors analyzed here, a distressing fact given that tobacco remains the leading cause of preventable mortality in the United States.29 The results here are consistent with national inequality trends,30,31 but the magnitude of the increase in inequality varied substantially across states and was not associated with changes in overall prevalence. For example, Texas and Oklahoma had similar declines in the overall prevalence of smoking, but Texas had virtually no change in inequality while educational inequality in Oklahoma increased from 14% to 23% (Figure 1 and Table 2). This may indicate that the determinants of changes in overall prevalence are different from the factors that affect changes in the relative socioeconomic distribution of smoking, and that such factors differ by state.
A number of state-level policy variables have been studied in relation to smoking, such as cigarette taxes,32,33 workplace restrictions on smoking,34 spending on tobacco control,35 the availability of cessation programs,36 and participation in a comprehensive tobacco control program.37 However, the extent to which state level differences in smoking policies have affected trends in socioeconomic inequalities in smoking has not been well studied. In this analysis, two states with well publicized and well funded tobacco control programs, California and Massachusetts,38–40 showed strong declines in the overall prevalence of smoking but had smaller increases in inequality than most states.
Binge alcohol consumption.
Relative inequalities in binge drinking were generally smaller than for other health behaviors. This is consistent with other studies showing relatively weaker socioeconomic gradients in alcohol use compared with other behaviors,41,42 but the overall trends seen here may indicate that binge drinking is becoming more concentrated among the less educated. With increasing attention to the negative health effects and other externalities associated with heavy alcohol use43,44 it may be that the better educated are either reducing their rate of binge consumption or increasing at a relatively slower pace. Brief advice from physicians about the possible health effects of heavy alcohol use, which may reach the better educated more readily, has been shown to lower levels of problem drinking,45 though the effects on binge drinking in particular are mixed.46
State alcohol policies vary substantially with respect to distribution systems, purchase and sales, taxation, advertising, and penalties for driving while intoxicated,47 and there is evidence to suggest that such policy differences affect both overall consumption and binge drinking in particular.48–50 However, the effects of such policies on the socioeconomic distribution of binge drinking are underinvestigated. This may result partially from the well justified focus on binge drinking among young people, though it has been estimated that nearly 70% of U.S. binge drinking episodes occur among those aged 26 and older.41 However, binge drinking during youth both decreases years of completed schooling51 and increases the likelihood of binge drinking as an adult.52 This process could, over time, serve to concentrate binge drinking among the lower educated. Finally, while inequalities in binge drinking were smaller than for other behaviors, changes in binge drinking inequality were similar in magnitude to changes for other behaviors, and were not associated with changes in average binge drinking. This suggests that the socioeconomic patterning of binge drinking is dynamic and may be affected by factors different from those that drive average prevalence.
Physical inactivity.
Socioeconomic inequality trends in physical inactivity generally increased and mirrored those for smoking. However, nine states showed improvements in inequality and decreasing overall prevalence of physical inactivity, five of which were located in the South (Kentucky, Maryland, Oklahoma, Tennessee, West Virginia). Given that rates of physical inactivity generally tend to be higher in the South53 this is a positive trend, though the reasons why these particular states were able to reduce socioeconomic inequality and the overall prevalence in physical inactivity cannot be discerned from this data.
Obesity.
The declines in relative inequalities in obesity are not surprising, given that obesity rates have increased since the late 1970s among virtually all demographic groups and U.S. regions.54,55 Even if the rates of increase were similar among education groups, inequalities would have declined when measured on the relative scale. However, there is some evidence that the rise in obesity has been more pronounced among the better educated,56 which would lead to a more rapid narrowing of socioeconomic inequality. This pattern is evident in the BRFSS data. The median prevalence rate of obesity among those with <12 years of education increased from 19% in 1990 to 29% in 2004, but more than doubled among the college-educated, increasing from 8% to 18%. However, the fact that obesity may be rising faster among the college-educated is of less public health importance than the magnitude of the rise among all education groups. Interestingly, the increases in the overall prevalence of obesity among states were more similar (roughly 10%–12%) than for other outcomes, but the magnitude of the declines in the socioeconomic gradient varied widely and actually widened in some states. This suggests that the factors that are increasing obesity rates in every state may have differential effects across states on socioeconomic inequality in obesity.
Seat belt use.
While seat belt use was on average lower among lower educated groups in this study, a finding consistent with previous studies,57 24 states showed significant improvement in educational inequality. Declines in inequality in seat belt use occurred while the average prevalence of not always wearing a seat belt declined for all states, implying more rapid improvement among the less educated. Most states thus appear to be making progress toward both of the overarching goals of Healthy People 2010: improving average health and eliminating inequalities, at least with respect to educational inequality. By 2002 at least one state, California, could be characterized as having already achieved both goals: the overall prevalence of not always wearing a seat belt (among those aged 25 and older) was only 7% (down from 29% in 1990) and the respective prevalence rates among those with <12, 12, 13–15, and 16 or more years of education were 6.9%, 6.1%, 5.9%, and 8.1%,respectively.
There was also a strong correlation between average prevalence and inequality in seat belt use, such that the states with the largest improvements in prevalence also tended to show the largest improvements in inequality. Thus, in contrast to the other outcomes analyzed here, it appears that whatever factors are improving the prevalence of seat belt use are also improving prevalence faster among the less educated. Much of the progress in safety belt use over the past 20 years is due to the adoption of mandatory seat belt laws by virtually all states. Usage rates are higher in states with primary enforcement (where motorists may be cited directly for not wearing seat belts) compared to secondary enforcement (where motorists may be cited for not wearing seat belts only after being stopped for another violation), and seat belt use increases when states move from secondary to primary enforcement.58 If primary enforcement is also more likely to increase use disproportionately among the lower educated, adopting primary enforcement may be more cost-effective than attempting to target groups with lower rates of use. It is worth noting that the only state without a mandatory seat belt law for adults, New Hampshire, had the fourth highest overall prevalence of not always wearing seat belts and was the most unequal state in 2002. The effectiveness of different types of seat belt legislation (primary vs. secondary enforcement, vehicle exemptions, fines, etc.) on changes in both overall prevalence and socioeconomic inequalities in seat belt use would seem worth further exploration.
Limitations
This study has some limitations, the most important of which is the self-reported nature of the BRFSS data. This could lead to underreporting of some behaviors due to social desirability, and the extent of underreporting may differ by socioeconomic position. However, since this analysis was focused on inequality trends, self-report biases would substantially alter the inequality trends only if they varied across states and changed over time, which seems unlikely.
The trends in overall prevalence reported here differ somewhat from those reported by Nelson et al., who also used data from the BRFSS.6 That study showed increases in smoking for a majority of states and unchanging or rising prevalence of physical inactivity, whereas the current analysis shows marginal declines in current smoking and more substantial declines in physical inactivity. This could be due to the exclusion of individuals aged 18–24 in the current study, which would likely lead to underestimates of the overall state prevalence for current smoking, binge alcohol use, and seat belt use, and overestimates of the prevalence of physical inactivity and obesity. However, the prevalence trends reported here appear consistent with national trends for similar behaviors.31
In addition, the prevalence estimates reported in this study were not adjusted for state differences in demographic composition, while those of Nelson et al. were directly adjusted to the age, gender, racial/ethnic, and education distribution of the overall BRFSS population. States differ widely in the distribution of demographic characteristics (e.g., the percent of the BRFSS population with 16 or more years of education in 2004 was 49% in the District of Columbia and 22% in West Virginia), so adjustment for such factors may alter the estimated prevalence rates. We chose a priori not to adjust for such factors because the results depicted here thus represent the “true” population health and inequality burdens of these behaviors given the actual demographic composition of each state.
It should also be pointed out that this analysis focused on state trends in relative inequality among socioeconomic groups. Had inequality been measured on an absolute scale, conclusions about the trends in inequality may have been different. For example, this analysis found that socioeconomic inequalities increased for smoking, but since smoking is generally declining, absolute differences between education groups may be narrowing in some states. This study also focused on only one dimension of health inequality—socioeconomic position measured by education. While education has the advantage of being less susceptible to bias due to reverse causation, other measures of socioeconomic position may show different associations with health behaviors. Similarly, differences in health behaviors according to gender, race/ethnicity, or other social group categories may show different trends.
Summary
In this analysis of state trends in socioeconomic inequalities in health behaviors, relative inequalities were largest for physical inactivity and smoking and smallest for binge alcohol use. From 1990 to 2004, inequalities increased most for smoking and physical inactivity, and declined for obesity and seat belt use, but wide variations were seen among states. The analysis here also uncovered substantial heterogeneity among states with respect to progress toward both improving average health and eliminating health inequality, and seat belt use was the only behavior for which trends in both overall prevalence and inequality were positive. Identifying states that have been able to make more or less progress toward both goals simultaneously and determining what social or policy factors may contribute to state differences requires further study, and states that are making progress in average health but in which relative socioeconomic inequalities are worsening may need to adopt additional prevention strategies aimed at improving health behaviors among their least advantaged populations.
REFERENCES
- 1.Department of Health and Human Services (US) Washington: U.S. Government Printing Office; 2000. Healthy people 2010: understanding and improving health. [Google Scholar]
- 2.Arizona Department of Health Services. Healthy Arizona 2010: collaborating for a healthier future. Phoenix: Arizona Department of Health Services; 2001. [Google Scholar]
- 3.Iowa Department of Public Health. Healthy Iowans 2010: advancing the boundaries of healthy living and the quality of life in the new decade. [cited 2003 Nov 7]. Available from: URL: http://www.idph.state.ia.us/bhpl/healthy_iowans_2010.asp.
- 4.Lincoln-Lancaster Health Department. Lincoln (NE): Lincoln-Lancaster Health Department; 2000. Healthy people 2010: health objectives for the year 2010 for Lincoln and Lancaster County Nebraska. [Google Scholar]
- 5.Brookmeyer R, Stroup DF, editors. Monitoring the health of populations: statistical principles and methods for public health surveillance. New York: Oxford University Press; 2004. [Google Scholar]
- 6.Nelson DE, Bland S, Powell-Griner E, Klein R, Wells HE, Hogelin G, Marks J. State trends in health risk factors and receipt of clinical preventive services among US adults during the 1990s. JAMA. 2002;287:2659–67. doi: 10.1001/jama.287.20.2659. [DOI] [PubMed] [Google Scholar]
- 7.Lynch J, Kaplan G. Socioeconomic position. In: Berkman LF, Kawachi I, editors. Social epidemiology. New York: Oxford University Press; 2000. pp. 13–35. [Google Scholar]
- 8.Pamuk E, Makuc D, Heck K, Reuben C, Lochner K. Health, United States, 1998 with socioeconomic status and health chartbook. Hyattsville (MD): National Center for Health Statistics; 1998. [Google Scholar]
- 9.Deaton A. Policy implications of the gradient of health and wealth. Health Aff (Millwood) 2002;21:13–30. doi: 10.1377/hlthaff.21.2.13. [DOI] [PubMed] [Google Scholar]
- 10.Pamuk ER, Wagener DK, Molla MT. Achieving national health objectives: the impact on life expectancy and on healthy life expectancy. Am J Public Health. 2004;94:378–83. doi: 10.2105/ajph.94.3.378. [DOI] [PMC free article] [PubMed] [Google Scholar]
- 11.Harper S, Lynch J. Methods for measuring cancer disparities: a review using data relevant to Healthy People 2010 cancer-related objectives. Washington: National Cancer Institute; 2006. [Google Scholar]
- 12.Gentry EM, Kalsbeek WD, Hogelin GC, Jones JT, Gaines KL, Forman MR, et al. The behavioral risk factor surveys: II. Design, methods, and estimates from combined state data. Am J Prev Med. 1985;1:9–14. [PubMed] [Google Scholar]
- 13.Marks JS, Hogelin GC, Gentry EM, Jones JT, Gaines KL, Forman MR, Trowbridge FL. The behavioral risk factor surveys: I. State-specific prevalence estimates of behavioral risk factors. Am J Prev Med. 1985;1:1–8. [PubMed] [Google Scholar]
- 14.Remington PL, Smith MY, Williamson DF, Anda RF, Gentry EM, Hogelin GC. Design, characteristics, and usefulness of state-based behavioral risk factor surveillance: 1981–87. Public Health Rep. 1988;103:366–75. [PMC free article] [PubMed] [Google Scholar]
- 15.Nelson DE, Holtzman D, Bolen J, Stanwyck CA, Mack KA. Reliability and validity of measures from the Behavioral Risk Factor Surveillance System (BRFSS) Soz Praventivmed. 2001;46(Suppl 1):S3–42. [PubMed] [Google Scholar]
- 16.Nelson DE, Powell-Griner E, Town M, Kovar MG. A comparison of national estimates from the National Health Interview Survey and the Behavioral Risk Factor Surveillance System. Am J Public Health. 2003;93:1335–41. doi: 10.2105/ajph.93.8.1335. [DOI] [PMC free article] [PubMed] [Google Scholar]
- 17.Wagstaff A, Paci P, van Doorslaer E. On the measurement of inequalities in health. Soc Sci Med. 1991;33:545–57. doi: 10.1016/0277-9536(91)90212-u. [DOI] [PubMed] [Google Scholar]
- 18.Harper S, Lynch J. Measuring health inequalities. In: Oakes JM, Kaufman JS, editors. Methods in social epidemiology. San Francisco: Jossey-Bass; 2006. [Google Scholar]
- 19.Kakwani N, Wagstaff A, van Doorslaer E. Socioeconomic inequalities in health: measurement, computation, and statistical inference. J Econom. 1997;77:87–103. [Google Scholar]
- 20.Chotikapanich D, Creedy J, Hopkins S. Income and health concentration in Australia. Economic Record. 2003;79(246):297–305. [Google Scholar]
- 21.van Doorslaer E, Wagstaff A, Bleichrodt H, Calonge S, Gertham UG, Gerfin M, et al. Income-related inequalities in health: some international comparisons. J Health Econ. 1997;16:93–112. doi: 10.1016/s0167-6296(96)00532-2. [DOI] [PubMed] [Google Scholar]
- 22.Wagstaff A. Child health on a dollar a day: some tentative cross-country comparisons. Soc Sci Med. 2003;57:1529–38. doi: 10.1016/s0277-9536(02)00555-5. [DOI] [PubMed] [Google Scholar]
- 23.Clarke P, Smith L, Jenkinson C. Comparing health inequalities among men aged 18–65 years in Australia and England using the SF-36. Aust N Z J Public Health. 2002;26:136–43. doi: 10.1111/j.1467-842x.2002.tb00906.x. [DOI] [PubMed] [Google Scholar]
- 24.Zhang Q, Wang Y. Socioeconomic inequality of obesity in the United States: do gender, age, and ethnicity matter? Soc Sci Med. 2004;58:1171–80. doi: 10.1016/s0277-9536(03)00288-0. [DOI] [PubMed] [Google Scholar]
- 25.Zhang Q, Wang Y. Bishop JA, Amiel Y, editors. Secular trends in socioeconomic inequality of obesity in the United States. Research on economic inequality. 2004;12:481–99. [Google Scholar]
- 26.Wagstaff A. The bounds of the concentration index when the variable of interest is binary, with an application to immunization inequality. Health Econ. 2005;14:429–32. doi: 10.1002/hec.953. [DOI] [PubMed] [Google Scholar]
- 27.Cleveland WS, Devlin SJ. Locally weighted regression: an approach to regression analysis by local fitting. J Am Stat Assoc. 1988;83:596–610. [Google Scholar]
- 28.Minujin A, Delamonica E. Mind the gap! Widening child mortality disparities. J Hum Dev. 2003;4:397–418. [Google Scholar]
- 29.Mokdad AH, Marks JS, Stroup DF, Gerberding JL. Actual causes of death in the United States, 2000. JAMA. 2004;291:1238–45. doi: 10.1001/jama.291.10.1238. [published erratum appears in JAMA 2005;293:293-4] [DOI] [PubMed] [Google Scholar]
- 30.Pierce JP, Fiore MC, Novotny TE, Hatziandreu EJ, Davis RM. Trends in cigarette smoking in the United States. Educational differences are increasing. JAMA. 1989;261:56–60. [PubMed] [Google Scholar]
- 31.National Center for Health Statistics. Hyattsville (MD): National Center for Health Statistics; 2005. Health, United States, 2005 with chartbook on trends in the health of Americans. [PubMed] [Google Scholar]
- 32.Meier KJ, Licari MJ. The effect of cigarette taxes on cigarette consumption, 1955 through 1994. Am J Public Health. 1997;87:1126–30. doi: 10.2105/ajph.87.7.1126. [DOI] [PMC free article] [PubMed] [Google Scholar]
- 33.Licari MJ, Meier KJ. Regulatory policy when behavior is addictive: smoking, cigarette taxes and bootlegging. Polit Res Q. 1997;50:5–24. [Google Scholar]
- 34.McMullen KM, Brownson RC, Luke D, Chriqui J. Strength of clean indoor air laws and smoking related outcomes in the USA. Tob Control. 2005;14:43–8. doi: 10.1136/tc.2004.007880. [DOI] [PMC free article] [PubMed] [Google Scholar]
- 35.Tauras JA, Chaloupka FJ, Farrelly MC, Giovino GA, Wakefield M, Johnston LD, et al. State tobacco control spending and youth smoking. Am J Public Health. 2005;95:338–44. doi: 10.2105/AJPH.2004.039727. [DOI] [PMC free article] [PubMed] [Google Scholar]
- 36.Shopland DR, Burns DM, editors. Smoking and tobacco control monograph 12: population based smoking cessation. Bethesda (MD): U.S. Dept. of Health and Human Services, National Cancer Institute; 2000. Cessation and cessation measures among adult daily smokers: national and state-specific data; pp. 25–97. [Google Scholar]
- 37.Stillman FA, Hartman AM, Graubard BI, Gilpin EA, Murray DM, Gibson JT. Evaluation of the American Stop Smoking Intervention Study (ASSIST): a report of outcomes. J Natl Cancer Inst. 2003;95:1681–91. doi: 10.1093/jnci/djg098. [DOI] [PubMed] [Google Scholar]
- 38.Fichtenberg CM, Glantz SA. Association of the California tobacco control program with declines in cigarette consumption and mortality from heart disease. N Engl J Med. 2000;343:1772–7. doi: 10.1056/NEJM200012143432406. [DOI] [PubMed] [Google Scholar]
- 39.Gilpin EA, Lee L, Pierce JP, Tang H, Lloyd J. Support for protection from secondhand smoke: California 2002. Tob Control. 2004;13:96. doi: 10.1136/tc.2003.007054. [DOI] [PMC free article] [PubMed] [Google Scholar]
- 40.Biener L, Harris JE, Hamilton W. Impact of the Massachusetts tobacco control programme: population based trend analysis. BMJ. 2000;321:351–4. doi: 10.1136/bmj.321.7257.351. [DOI] [PMC free article] [PubMed] [Google Scholar]
- 41.Naimi TS, Brewer RD, Mokdad A, Denny C, Serdula MK, Marks JS. Binge drinking among US adults. JAMA. 2003;289:70–5. doi: 10.1001/jama.289.1.70. [DOI] [PubMed] [Google Scholar]
- 42.Nelson DE, Naimi TS, Brewer RD, Bolen J, Wells HE. Metropolitan-area estimates of binge drinking in the United States. Am J Public Health. 2004;94:663–71. doi: 10.2105/ajph.94.4.663. [DOI] [PMC free article] [PubMed] [Google Scholar]
- 43.Wechsler H, Davenport A, Dowdall G, Moeykens B, Castillo S. Health and behavioral consequences of binge drinking in college. A national survey of students at 140 campuses. JAMA. 1994;272:1672–7. [PubMed] [Google Scholar]
- 44.Room R, Babor T, Rehm J. Alcohol and public health. Lancet. 2005;365:519–30. doi: 10.1016/S0140-6736(05)17870-2. [DOI] [PubMed] [Google Scholar]
- 45.Fleming MF, Barry KL, Manwell LB, Johnson K, London R. Brief physician advice for problem alcohol drinkers. A randomized controlled trial in community-based primary care practices. JAMA. 1997;277:1039–45. [PubMed] [Google Scholar]
- 46.Whitlock EP, Polen MR, Green CA, Orleans T, Klein J. Behavioral counseling interventions in primary care to reduce risky/harmful alcohol use by adults: a summary of the evidence for the U.S. Preventive Services Task Force. Ann Intern Med. 2004;140:557–68. doi: 10.7326/0003-4819-140-7-200404060-00017. [DOI] [PubMed] [Google Scholar]
- 47.Alcohol policies in the United States: highlights from the 50 states. Minneapolis: University of Minnesota; 2000. Alcohol Epidemiology Program. [Google Scholar]
- 48.Chaloupka FJ, Wechsler H. Binge drinking in college: the impact of price, availability, and alcohol control policies. Contemp Econ Policy. 1996;14(4):112–24. [Google Scholar]
- 49.Cook PJ, Moore MJ. Environment and persistence in youthful drinking patterns. In: Gruber J, editor. Risky behavior among youths: an economic analysis. Chicago: University of Chicago Press; 2001. pp. 375–437. [Google Scholar]
- 50.Nelson TF, Naimi TS, Brewer RD, Wechsler H. The state sets the rate: the relationship among state-specific college binge drinking, state binge drinking rates, and selected state alcohol control policies. Am J Public Health. 2005;95:441–6. doi: 10.2105/AJPH.2004.043810. [DOI] [PMC free article] [PubMed] [Google Scholar]
- 51.Cook PJ, Moore MJ. Drinking and schooling. J Health Econ. 1993;12:411–29. doi: 10.1016/0167-6296(93)90003-w. [DOI] [PubMed] [Google Scholar]
- 52.Jefferis BJMH, Power C, Manor O. Adolescent drinking level and adult binge drinking in a national birth cohort. Addiction. 2005;100:543–9. doi: 10.1111/j.1360-0443.2005.01034.x. [DOI] [PubMed] [Google Scholar]
- 53.Schoenborn CA, Adams PF, Barnes PM, Vickerie JL, Schiller JS. Washington: US Department of Health and Human Services, National Center for Health Statistics; 2004. Health behaviors of adults: United States 1999-2001. [PubMed] [Google Scholar]
- 54.Flegal KM, Carroll MD, Ogden CL, Johnson CL. Prevalence and trends in obesity among US adults, 1999–2000. JAMA. 2002;288:1723–7. doi: 10.1001/jama.288.14.1723. [DOI] [PubMed] [Google Scholar]
- 55.Mokdad AH, Serdula MK, Dietz WH, Bowman BA, Marks JS, Koplan JP. The spread of the obesity epidemic in the United States, 1991–1998. JAMA. 1999;282:1519–22. doi: 10.1001/jama.282.16.1519. [DOI] [PubMed] [Google Scholar]
- 56.Zhang Q, Wang Y. Trends in the association between obesity and socioeconomic status in US adults: 1971 to 2000. Obes Res. 2004;12:1622–32. doi: 10.1038/oby.2004.202. [DOI] [PubMed] [Google Scholar]
- 57.Nelson DE, Bolen J, Kresnow M. Trends in safety belt use by demographics and by type of state safety belt law, 1987 through 1993. Am J Public Health. 1998;88:245–9. doi: 10.2105/ajph.88.2.245. [DOI] [PMC free article] [PubMed] [Google Scholar]
- 58.Cohen A, Einav L. The effects of mandatory seat belt laws on driving behavior and traffic fatalities. Rev Econ Stat. 2003;85:828–43. [Google Scholar]


