Abstract
The kinetics of the fall in subcutaneous fluid glucose concentration in anesthetized rats (n = 7) after intravenous injection of insulin (0.5 units/kg) was studied by using 5 × 10⁻⁴ cm2 active area, <150-sec 10–90% response time, amperometric glucose sensors. The onset of the decline in the subcutaneous glucose concentration was delayed and statistically different (P < 0.001) from that in blood (8.9 ± 2.1 min vs. 3.3 ± 0.5 min). Similarly, the rate of drop in glucose concentration between 6 and 20 min after the insulin injection was different for subcutaneous tissue (3.9 ± 1.3 mg⋅dl−1⋅ min−1) and blood (6.8 ± 2.0 mg⋅dl−1⋅min−1) (P = 0.003). The hypoglycemic nadir in subcutaneous fluid occurred 24.5 ± 6.8 min after that in the blood (P < 0.001). A “forward” mass-transfer model, predicting the subcutaneous glucose concentration from the blood glucose concentrations and an “inverse” model, predicting the blood glucose concentration from the subcutaneous glucose concentration were derived. By using an algorithm based on the latter, the average discrepancy between the measured blood glucose concentration and that estimated from the subcutaneous measurement through the entire 4-hr experiment was reduced from 22.9% to 11.1% (P = 0.025). The maximum discrepancy during the 40-min period after the injection of insulin was reduced from 84.1% to 29.3% (P = 0.006).
We address the avoidance of clinical error in the treatment of diabetes when the glucose concentration is monitored not in the blood but in the subcutaneous interstitial fluid, where amperometric sensors, operating continuously, can be placed. Blood glucose concentrations are well correlated with subcutaneous glucose concentrations at steady-state (1–5). When the blood glucose concentration increases rapidly (3, 4, 6–9) or decreases (7, 9, 10) there is, however, a time lag, resulting in a transient difference between the blood and subcutaneous glucose concentrations. With recently developed 5 × 10⁻⁴ cm2 active area, <150-sec response time flexible glucose electrodes, small enough to be implanted not only subcutaneously but also in the jugular vein of rats, it became possible to continuously and simultaneously track the two concentrations and to better time resolve them (11, 12). Here we report substantial transient differences between the two, large enough to lead to clinical error, after injection of regular insulin. We also show that this transient difference can be modeled and derive an algorithm that corrects for most of the transient difference.
MATERIALS AND METHODS
Glucose Electrodes.
The electrodes were structurally similar to the earlier reported ones (12). Their 5 × 10⁻⁴ cm2 active area had three layers. Of these layers, the “wired” glucose oxidase transduction layer and the biocompatible layer were identical with those described in ref. 12. The glucose flux restricting layer however was modified by sequentially filling the 90-μm deep, 250-μm diameter recess and curing (at room temperature for 20 min) twice with a 1% solution of cellulose acetate in cyclohexanone; once with a 0.5% solution of Nafion (Aldrich) in 1-propanol; and once with a freshly prepared solution of poly(vinylpyridine) acetate (25 mg/ml in water) and polyfunctional aziridine (XAMA-7, E.I.T. Inc., Lakewilie, SC) (30 mg/ml in water) in a 1:2 volume ratio, this layer being cured for at least 8 hr.
Response Time.
The in vitro response time of the glucose electrodes was measured for both increasing and decreasing step changes in glucose concentration before implantation. The measurements were made at 37 ± 0.5°C in a rapidly stirred, jacketed electrochemical cell containing pH 7.4 PBS. The three-electrode cell had a saturated calomel reference electrode (SCE), a platinum counter electrode, and the glucose electrode, and it was poised at 200 mV vs. SCE. Step changes increasing the glucose concentration (90 mg/dl to 180 mg/dl) were made by injecting into the rapidly stirred solution an aliquot of concentrated aqueous glucose (2 M). Step changes decreasing the glucose concentration (180 mg/dl to 90 mg/dl) were made by injecting PBS into the cell.
In Vivo Experiments.
Male Sprague–Dawley rats (380–520 g) were preanesthetized with halothane (Halocarbon Laboratories, North Augusta, SC) and anesthetized by intraperitoneal injection (0.3 ml) of an equal volume mixture of acepromazine maleate (10 mg/ml), ketamine (100 mg/ml), and xylazine (20 mg/ml). The animals then were shaven about the neck, the abdomen, and the area between the scapulae, then secured on a homeothermic blanket system (Harvard Apparatus). First, the right external jugular vein was located and cleared of extraneous tissue. The distal side of the right vein was tied off with 4–0 silk, and a small cut was made in the vein. A 0.0375-inch diameter medical-grade silastic tube was inserted into the proximal portion of the right jugular vein and secured with 4–0 silk. A dose of 100 units/kg body weight of heparin solution then was administered, followed by an equal volume of saline, to clear the line. Next, the rat’s skin was sutured closed. The rat then was rolled onto its abdomen, while assuring that the line in the jugular vein was not pulled out, and an electrode was inserted in the subcutaneous tissue between the scapulae of the animal by using a 22-gauge introducing catheter needle (PER-Q-Cath, Gesco, San Antonio, TX). The animal then was returned to its back and resecured. The left external jugular vein then was located and cleared of extraneous tissue. Next, the distal side of the left jugular vein was tied off, and a small cut was made in the vein. A silastic tube of ≈1.5-cm length was inserted into the proximal side as a guide, and a glucose electrode was inserted inside the guide tube. The tube and the sensor were secured with 4–0 silk, with the electrode’s insulating gold wire protruding beyond the end of the guide tube. The incision site then was moistened and packed with gauze. An ion-conducting gel then was applied to a skin reference (Ag/AgCl) electrode, and the electrode was placed on the rat’s abdomen. The implanted electrodes as well as the reference electrode were connected to a biopotentiostat (13), the output of which was logged with a data logger. After the output of the implanted electrodes reached a stable baseline (0.5–1 hr), an intravenous injection of 0.5 units/kg of regular insulin (RU-100, Eli Lilly) was administered through the right jugular vein. Blood samples were collected at t = −20, −10, −1, 3, 6, 9, 12, 15, 20, 25, 30, 35, 40, 45, 60, 75, and 90 min after the insulin injection. The whole blood samples were obtained from the left jugular vein and were immediately placed in tubes containing heparin and sodium fluoride and kept on ice until analysis. All blood samples were analyzed in duplicate by using a YSI Model 2300 glucose analyzer (Yellow Springs Instruments). The insulin dose was injected through the infusion catheter and cleared with heparinized saline. At the end of the experiment the rat was euthanized by sodium pentobarbital injection i.p. or asphyxiation by CO2, consistent with the recommendations of the panel on Euthanasia of the American Veterinary Association. All in vivo experimentation was approved by the University of Texas Institutional Animal Use and Care Committee.
In Vivo Sensor Calibration.
The implanted electrodes were sufficiently glucose selective (12) to be calibrated by withdrawal of a single sample of blood and assay of its glucose concentration (“one-point in vivo calibration”). After the current output of the sensor stabilized, 20–40 min after implantation and electrical connection to the bipotentiostat, a single sample of blood was drawn and its glucose concentration was assayed by using the YSI glucose analyzer. From this measurement, a current to glucose concentration conversion factor (mg/dl per nA) was calculated for the implanted electrode. This factor was used to obtain all glucose estimates for the remainder of the test period.
Data Analysis.
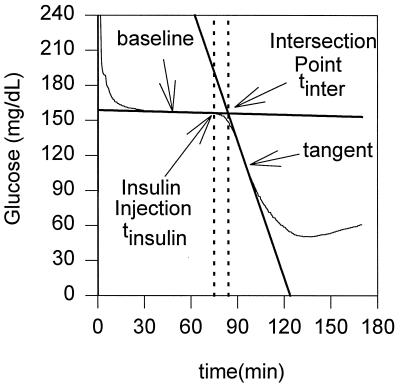
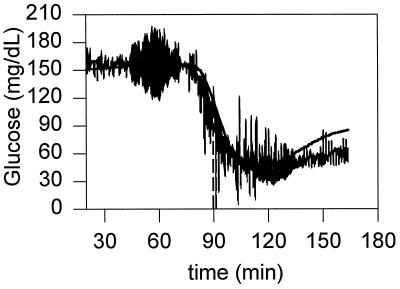
The onset of the decline in the concentrations of venous and subcutaneous glucose after the injection of insulin were determined graphically by using the time-concentration plots and a method used in process control to calculate time delays (14). The tangent line at the point of inflection was drawn (see Fig. 1) and the line, tracking the basal concentration of glucose before the injection of insulin, was extended. The intersection of the two lines defined the onset point of the decline. The onset times were referenced to the time at which insulin was injected. The rate of decline in glucose concentration in the period between 6 and 20 min after insulin injection was calculated by linear regression analyses for the periodically sampled blood from the vein where insulin was injected; the contralateral jugular vein, where an electrode was implanted; and for the subcutaneous interstitial fluid, where the second electrode was implanted. The values are presented as means ± SD, along with their statistical significance, assessed when appropriate by a Student’s t test for paired data, with P < 0.05 considered as statistically significant.
Figure 1.
Definition of the onset of the decline of glucose concentration after intravenous injection of insulin (tonset = tinter − tinsulin).
RESULTS AND DISCUSSION
In Vitro Response Time Measurements.
The intrinsic response times to increasing and decreasing step changes in glucose concentration were 2.59 ± 1.17 min and 1.55 ± 0.79 min (n = 14), respectively.
Intravenous Insulin Tests.
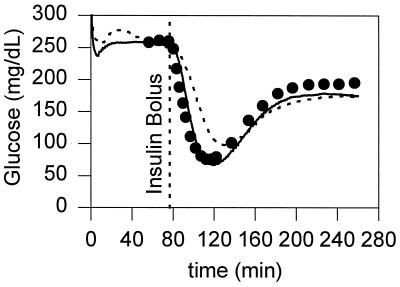
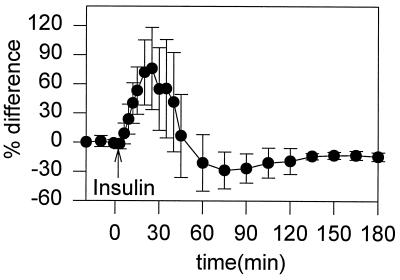
Fig. 2 shows the typical output of the subcutaneous and jugular vein electrodes during an in vivo experiment. After insulin injection, the average venous blood glucose concentrations of the rats (n = 7) decreased from 207 ± 67 mg/dl to 59 ± 12 mg/dl. The minimum in blood glucose concentration was reached 36.6 ± 7.2 min after the injection of insulin. Table 1 lists the average lag times between the lowest subcutaneous sensor readings and the point of lowest glucose concentration in the concentrations in the blood withdrawn from the vein where the insulin was injected, and also between the lowest readings by the sensor implanted in the contralateral jugular vein and the samples withdrawn from the injected jugular vein. The onsets of the decline with respect to the time of injection of insulin, measured in the injected jugular vein, the contralateral jugular vein, and the subcutaneous fluid are shown in Table 1, along with the rates of decline in the period between 6 and 20 min after insulin injection. Fig. 3 shows the average difference between the estimates of the subcutaneous glucose concentrations and the actual blood glucose concentrations as a function of time.
Figure 2.
Comparison of the estimated glucose concentrations of a subcutaneously implanted sensor (dotted line), and a intravascularly implanted sensor (solid line) with the venous blood glucose concentrations (•) measured with a YSI analyzer after an i.v. bolus of insulin.
Table 1.
Declining glucose characteristics
| Location | Onset time, min | Decline rate, mg⋅dl−1⋅min−1 | tminimum glucose, min | Lag time, min |
|---|---|---|---|---|
| Blood samples | 3.3 ± 0.5 | 6.8 ± 2.0 | 36.6 ± 7.2 | — |
| Intravenous sensor | 5.6 ± 1.7 | 7.0 ± 2.5 | 40.3 ± 5.9 | 3.7 ± 4.3 |
| Subcutaneous sensor | 8.9 ± 2.1 | 3.9 ± 1.3 | 61.2 ± 7.5 | 24.5 ± 6.8 |
Figure 3.
Plot of the average difference (n = 7) of subcutaneous glucose estimates relative to actual blood glucose measurements. % Difference = 100 × (subcutaneous − blood)/blood.
The nadir in subcutaneous glucose was statistically different from the nadir in blood glucose (P < 0.001) and occurred 24.5 ± 6.8 min later. Similarly, the onset of declining subcutaneous glucose levels (8.9 ± 2.1 min after insulin injection) was statistically different (P < 0.001) from the onset in blood glucose levels (3.3 ± 0.5 min after insulin injection). The rate of drop in glucose levels, between 6–20 min after insulin injection, was slower in the subcutaneous fluid (3.9 ± 1.3 mg⋅ dl−1⋅min−1), than in blood (6.8 ± 2.0 mg⋅dl−1⋅min−1, P = 0.003).
In the contralateral jugular vein, the minimal glucose concentration was reached 3.7 min after it was reached in the injected vein (36.6 vs. 40.3 min., P = 0.06). The rates of decline during the 6- to 20-min period were nearly identical in the two opposite jugular veins (6.8 and 7.0 mg dl−1 min−1, P = 0.59). The onsets of the decline in glucose concentrations were statistically different for the opposite veins (3.3 vs. 5.6 min, P = 0.01).
The Relationship Between Subcutaneous and Blood Glucose Concentrations and Its Mathematical Modeling.
Forward model: Predicting the subcutaneous glucose concentration from the blood glucose concentration. The relationship between the concentrations of glucose is governed by the mass transfer resistance from the blood to the subcutaneous region near the sensor and by the uptake of glucose by the surrounding subcutaneous tissue. Following a material balance, the rate of accumulation of glucose in the sensing volume V is given by the net rate of mass transfer of glucose into the region less the uptake of glucose by the surrounding cells. Mathematically, this relationship between the concentration of glucose in the subcutaneous tissue S and that in the blood B is given by,
 |
1 |
where A is the surface area of the sensing volume, km is a mass transfer coefficient, and kr is the rate constant for uptake of glucose by the subcutaneous tissue. Although the reaction rate constant also may depend on the local insulin concentration I (15), we find that the associated correction is not required because of this small value of kr. Dividing Eq. 1 by the volume of the sensor region V we find that
 |
2 |
where β = kmA/V and is the reciprocal of the time constant for mass transfer with units min−1. This model termed the forward model predicts the subcutaneous glucose concentration from that in the blood.
The results of the model are presented in Tables 2 and 3. In these tables the differences in the forward model column were calculated by averaging (Sp − Sm)/Sm over the entire data set, where S denotes the concentration of glucose in the subcutaneous region, m denotes a measured value, and P denotes a predicted value from the forward model. The differences in the no model column were calculated by (Bm − Sm)/Sm. B represents the concentration of glucose in the blood.
Table 2.
Average differences between the measured subcutaneous glucose concentrations and the predicted subcutaneous glucose concentrations
| Rat | Avg. difference, %
|
|
|---|---|---|
| Forward model | No model | |
| 1 | 12.4 | 23.8 |
| 2 | 14.6 | 23.5 |
| 3 | 11.9 | 16.2 |
| 4 | 7.4 | 24.1 |
| 5 | 6.0 | 16.0 |
| 6 | 4.9 | 14.3 |
| 7 | 5.2 | 9.6 |
| Mean | 8.9 | 18.2 |
| SD | 7.8 | 14.5 |
Table 3.
Maximum differences between the measured subcutaneous glucose concentrations and the predicted subcutaneous glucose concentrations during the 40-min period after insulin injection
| Rat | Max. difference, %
|
|
|---|---|---|
| Forward model | No model | |
| 1 | 12.5 | 22.9 |
| 2 | 15.9 | 34.8 |
| 3 | 17.7 | 21.6 |
| 4 | 2.7 | 50.4 |
| 5 | 13.9 | 35.3 |
| 6 | 9.7 | 35.8 |
| 7 | 5.2 | 14.2 |
| Mean | 11.1 | 30.7 |
| SD | 5.5 | 12.0 |
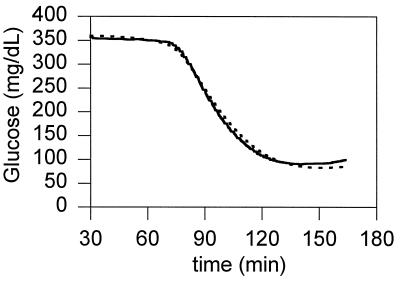
A typical plot of a prediction of the subcutaneous concentration of glucose given the concentration of glucose in the blood from the jugular sensor is shown in Fig. 4, where the only fitted parameter was β = 0.04 min−1. The uptake term of the model was found to be negligible for most of the data sets and was set to zero for all sets. This finding is not surprising, because the sensor was placed between the connective tissue and smooth muscle tissue where the rate of glucose uptake is low compared with the rate of uptake in adipose tissue or skeletal muscle (15).
Figure 4.
Comparison between the subcutaneous concentration of glucose in rat no. 4 determined by the sensor (solid line) and predicted by the forward model (dashed line) with β = 0.04 min−1. The data from the jugular sensor (not shown) were used as input to the model.
The values of β were determined by a least-squares minimization of the average error for each individual data set and ranged from 0.04 to 0.11 min−1, except for one case, where β equaled 0.22 min−1. Our results in rats show that β is relatively constant. If this constancy proves to be true also in humans then it may not be necessary to determine β for each patient, or for different subcutaneous placement sites in a particular patient. Table 2 summarizes the statistics for comparison of the prediction of the forward model with the subcutaneous sensor data. On average the forward model predicted the readings of the subcutaneous sensor from those in blood with a difference of 8.9 ± 7.8%. If the subcutaneous concentration of glucose were estimated to equal that measured by the jugular sensor (i.e., if the model was not used), the average difference would have been 18.2 ± 14.5%. The values derived through the model and those measured differed, and the difference was statistically significant (P = 0.001). In the 40-min interval after injection of the insulin, the time period that is most in need of correction, the average of the maximal differences was decreased through the model from 30.7% to 11.1% (Table 3, P = 0.01).
Inverse model: Predicting the blood glucose concentration from the subcutaneous glucose concentration.
To predict the concentration of blood glucose B given the subcutaneous sensor data S, requires solving the inverse transport problem by using Eq. 2. This creates a problem in that the derivative, dS/dt, must be evaluated numerically, an operation that amplifies noise. To circumvent this problem, Eq. 2 was rewritten in the form of a Volterra integral equation, both sides of Eq. 2, neglecting the term representing uptake by the cells, being multiplied by the function
 |
3 |
to yield
 |
4 |
If one takes the definite integral of Eq. 4 between times θ and t, and divides both sides by φ(t) then,
 |
5 |
where the variable θ is the initial time for the present window of computation, and t is the final time for that window. For a given window, B is being computed at time t. Now one must solve the integral equation for B(τ), given values of Sμ=S(tμ), at discrete times tμ. If the model were a perfect representation of the relationship between concentration of glucose in the blood and that in the subcutaneous tissue and if the experimental data were perfect, then this treatment would suffice. However, the data are noisy, and the model, although good, is not perfect. The solution to Eq. 5 is sensitive to noise, its application, without further refinement, resulting in high-frequency oscillatory glucose concentrations (Fig. 5). To condition the solution of B(τ) to be smooth, in addition to closely satisfying Eq. 5 with experimental measurements of S(t), the functional f[B], given by,
 |
6 |
was minimized over the windows of data points, where
 |
7 |
and
 |
8 |
with θ = ti and N being the number of points in the window of computation. The functional χ2 represents the fit between the prediction of the model and the experimental data, and the functional Ψ indicates the smoothness of the prediction. The last term in Eq. 8 is a finite difference estimate of the integral, where Δτ is the time difference between data points. The variable λ is a weight, balancing the amount of smoothing to data-matching and it may in principle range from 0 to ∞ (16). Eq. 6 was discretized and minimized by setting df/dB equal to 0 to yield a linear set of algebraic equations for the concentration of blood glucose. It was solved for each time at which a measurement was made in the experiment. The condition for smoothing minimizes large first derivatives within the window of computation.
Figure 5.
Comparison between the concentration in the blood of rat no. 1 determined by the sensor (solid line) and predicted by the inverse model (dashed line) without regularization and for β = 0.09 min−1. Any small imperfection in the data or in the model is amplified when using this method.
In addition to assuring a relatively smooth solution for B(τ), this regularization method avoided a lag in the output of the results. The direct application of Eq. 2 would have required smoothing the sensor readings before processing the data. However, application of real-time inversion implies that future data are unknown. By using the regularization method, one can smooth in real time.
The value of B(τ) in Eqs. 6-8 was determined by using standard methods (16). The weight factor λ first was estimated by the method outlined in ref. 16. The initial condition of B(0) = S(0) was then enforced within 10% to find a more exact value of λ based on the initial guess. Further refining of the value of λ had little effect on the results. Time t = 0 for modeling purposes was taken to be 20 min before insulin injection.
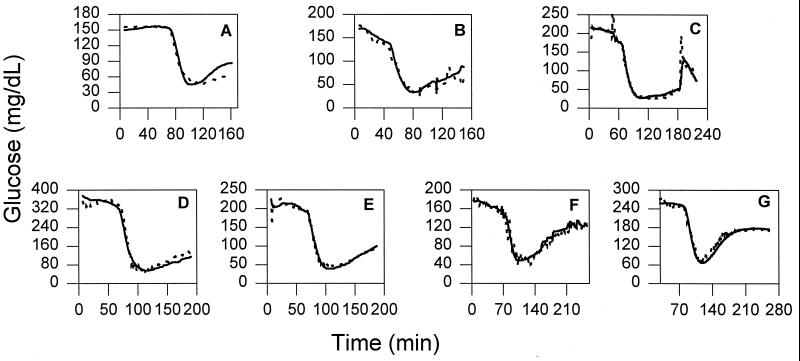
On average, the inverse model predicted in all experiments the performance of blood glucose concentrations sensed in the jugular veins, even when the blood and subcutaneous glucose concentrations were dropping rapidly and from a steady state, within 11.1 ± 10.6% (Table 4). If the subcutaneous concentration of glucose were considered to equal that given by the jugular sensor (i.e., if the inverse model were not used), the average difference would have been greater 22.9 ± 14.4% (P = 0.025). Furthermore, during the 40-min period after insulin injection, when the dynamic difference was greatest, the maximum difference between the blood and the subcutaneous glucose concentrations was 84.1 ± 36.1%. By using the inverse model the maximum difference between the computed blood glucose concentration and the actual concentration was reduced to 29.3 ± 8.4% (Table 5, P = 0.006). Plots of the inverse model predictions are shown in Fig. 6.
Table 4.
Average differences between the measured blood glucose concentrations and the blood glucose concentrations predicted from the subcutaneous measurements
| Rat | Avg. difference, %
|
|
|---|---|---|
| Inverse model | No model | |
| 1 | 13.3 | 22.7 |
| 2 | 13.3 | 20.5 |
| 3 | 13.6 | 15.9 |
| 4 | 14.8 | 48.9 |
| 5 | 8.2 | 23.2 |
| 6 | 7.9 | 15.7 |
| 7 | 6.9 | 13.7 |
| Mean | 11.1 | 22.9 |
| SD | 10.6 | 14.4 |
Table 5.
Maximum differences between the measured blood glucose concentrations and the blood glucose concentrations predicted from the subcutaneous measurements during the 40-min period after insulin injection
| Rat | Max. difference, %
|
|
|---|---|---|
| Inverse model | No model | |
| 1 | 22.8 | 72.8 |
| 2 | 38.8 | 67.8 |
| 3 | 18.0 | 41.3 |
| 4 | 31.5 | 157.3 |
| 5 | 28.5 | 94.9 |
| 6 | 40.9 | 72.7 |
| 7 | 24.8 | 82.1 |
| Mean | 29.3 | 84.1 |
| SD | 8.4 | 36.1 |
Figure 6.
Comparison between the concentration of glucose in the blood determined by the sensor (solid line) and predicted by the inverse model (dashed line) with regularization for rats 1–7.
CONCLUSIONS
After injection of insulin in the jugular vein of a rat, the concentrations of glucose differed in the subcutaneous fluid from those in the contralateral jugular vein in three ways. First, the onset of the decline in glucose concentration in the subcutaneous fluid was delayed relative to that in blood; second, the maximum rate of decline in the subcutaneous interstitial fluid was slower than that in blood; and third, the minimal glucose concentration was reached considerably later in the subcutaneous fluid than in the blood. These differences can be explained by the mass-transfer resistance between the blood and subcutaneous fluid. Because of the differences, the estimation of blood glucose concentrations from measurements of glucose concentrations in the subcutaneous fluid requires application of a model on which a correction algorithm can be based. This paper provides this model and the sought algorithm.
Application of the algorithm reduced the transient discrepancies between the blood and the subcutaneous glucose concentration after insulin injection in the rat. This raises the hope that related studies in humans also will show that the likelihood of a severe clinical error can be reduced by applying the same or a similar algorithm. In the rat the model predicted the blood glucose concentration from the subcutaneous measurements, even during periods where the blood glucose concentration was dropping rapidly (Fig. 6) with an error that was below the total system error of today’s home blood glucose monitors (17–19). As seen in Tables 4 and 5, the model allows more accurate prediction of the blood glucose concentrations from the subcutaneous measurements, the average discrepancy between the measured and predicted blood glucose concentration dropping from 22.9% to 11.1% for the 4-hr experiments and the maximum differences from 84.1% to 29.3% for the 40-min periods after insulin injection (Table 5).
The results are of particular clinical interest in the context of the danger of rapidly developing hypoglycemia in type I diabetic patients. Although the Diabetes Control and Complications Trials showed that intensive insulin therapy reduced the likelihood of developing the secondary complications of diabetes, such as nephropathy, neuropathy, and retinopathy, (20) it also led, because of the lower average glucose concentration maintained, to a 3-fold increase in the occurrence of severe hypoglycemia (21). What are the potential clinical implications of these results? If the uncorrected measurements of subcutaneous glucose concentration were used to estimate the actual blood glucose concentration after intravenous injection of an insulin bolus, an overestimate of the blood glucose concentration leading to a clinical error, would have resulted (Fig. 3). The model, and the algorithm based on it, improve the ability to correctly determine from subcutaneous glucose concentration measurements actual hypoglycemia and, from measurement of the rate of drop in glucose concentration in the subcutaneous fluid, also to predict impending hypoglycemia.
Acknowledgments
We thank Dr. Masahiko Ishikawa for his helpful comments in designing the insulin experiments, Dr. Chris Quinn for the bipotentiostats, and Dr. Joe Qin for his help in analyzing some of the data. The National Institutes of Health supported this work through Grant DK42015.
References
- 1.Bolinder J, Ungerstedt U, Arner P. Diabetologia. 1992;35:1177–1180. doi: 10.1007/BF00401374. [DOI] [PubMed] [Google Scholar]
- 2.Fischer U, Ertle R, Abel P, Rebrin K, Brunstein E, Hahn von Dorsche H, Freyse E J. Diabetologia. 1987;30:940–945. doi: 10.1007/BF00295878. [DOI] [PubMed] [Google Scholar]
- 3.Jansson P A, Fowlein J, Smith U, Lönnroth P. Am J Physiol. 1988;255:E218–220. doi: 10.1152/ajpendo.1988.255.2.E218. [DOI] [PubMed] [Google Scholar]
- 4.Meyerhoff C, Bischof F, Sternberg F, Zier H, Pfeiffer E F. Diabetologia. 1992;35:1087–1092. doi: 10.1007/BF02221686. [DOI] [PubMed] [Google Scholar]
- 5.Reach G, Wilson G S. Anal Chem. 1992;64:381A–386A. doi: 10.1021/ac00030a001. [DOI] [PubMed] [Google Scholar]
- 6.Pfeiffer E F, Meyerhoff C, Bischof F, Keck F S, Kerner W. Horm Metab Res. 1993;25:121–124. doi: 10.1055/s-2007-1002057. [DOI] [PubMed] [Google Scholar]
- 7.Pickup J C, Shaw G S, Claremont D J. Diabetologia. 1989;32:213–217. doi: 10.1007/BF00265097. [DOI] [PubMed] [Google Scholar]
- 8.Quinn C P, Pishko M V, Schmidtke D W, Ishikawa M, Wagner J G, Raskin P, Hubbell J A, Heller A. Am J Physiol. 1995;269:E155–E161. doi: 10.1152/ajpendo.1995.269.1.E155. [DOI] [PubMed] [Google Scholar]
- 9.Velho G, Froguel Ph, Reach G. Diabetologia. 1989;32:331–336. doi: 10.1007/BF00277254. [DOI] [PubMed] [Google Scholar]
- 10.Thome-Duret V, Reach G, Gangnerau M N, Lemonnier F, Klein J C, Zhang Y, Hu Y, Wilson G S. Anal Chem. 1996;68:3822–3826. doi: 10.1021/ac960069i. [DOI] [PubMed] [Google Scholar]
- 11.Csöregi E, Quinn C P, Schmidtke D W, Lindquist S, Pishko M V, Ye L, Katakis I, Hubbell J A, Heller A. Anal Chem. 1994;66:3131–3138. doi: 10.1021/ac00091a022. [DOI] [PubMed] [Google Scholar]
- 12.Csöregi E, Schmidtke D W, Heller A. Anal Chem. 1995;67:1240–1244. doi: 10.1021/ac00103a015. [DOI] [PubMed] [Google Scholar]
- 13.Quinn C P, Wagner J G, Yarnitzky C Y, Heller A. Instrumentation Sci Technol. 1996;24:263–275. [Google Scholar]
- 14.Seborg D E, Edgar T F, Mellichamp D A. Process Dynamics & Control. New York: Wiley; 1989. pp. 169–173. [Google Scholar]
- 15.Yeh J I, Verhey K J, Birnbaum M J. Biochemistry. 1995;34:15523–15531. doi: 10.1021/bi00047a018. [DOI] [PubMed] [Google Scholar]
- 16.Press W H, Teukolsky S A, Vetterling W T, Flannery B P. Numerical Recipes in Fortran. 2nd Ed. Cambridge, MA: Cambridge Univ. Press; 1992. p. 126. , 786–803. [Google Scholar]
- 17.American Diabetes Association. Diabetes Care. 1994;17:81–86. doi: 10.2337/diacare.17.1.81. [DOI] [PubMed] [Google Scholar]
- 18.Trajanoski Z, Brunner G A, Gfrerer R J, Wach P, Pieber T R. Diabetes Care. 1996;19:1412–1415. doi: 10.2337/diacare.19.12.1412. [DOI] [PubMed] [Google Scholar]
- 19.Zenobi P D, Keller A, Jaeggi-Groisman S E, Glatz Y. Diabetes Care. 1995;18:587–588. doi: 10.2337/diacare.18.4.587. [DOI] [PubMed] [Google Scholar]
- 20.The Diabetes Control and Complications Trial Research Group. N Engl J Med. 1993;329:977–986. doi: 10.1056/NEJM199309303291401. [DOI] [PubMed] [Google Scholar]
- 21.The Diabetes Control and Complications Trial Research Group. Diabetes Care. 1995;18:1415–1427. doi: 10.2337/diacare.18.11.1415. [DOI] [PubMed] [Google Scholar]


