

Abstract
The role of type I interferons (IFNs) in mediation of acute viral symptoms (fever, somnolence, anorexia, etc.) is unknown. To determine the role of type I IFN in selected symptom development, body temperature and sleep responses to a marginally lethal dose of X-31 influenza virus were examined in mice with a targeted mutation of the IFN receptor type I (IFN-RI knockouts) and compared to wild-type 129 SvEv control mice. Mice were monitored for 48 hr to determine baseline temperature and sleep profiles prior to infection, and then for 9 days following infection. Hypothermic responses to virus were perceptible beginning at 64 hr post-infection (PI) and were more marked in KO mice until 108 hr, when hypothermia became more exaggerated in wild-type controls. Temperatures of wild-type mice continued to decline through day 9 while temperatures in IFN-RI KO mice stabilized. Time spent in non-rapid eye movement sleep (NREMS) increased in KO mice when hypothermia was marked and then returned to baseline levels, while NREMS continued to increase in wild-type mice through day 9. Other sleep parameters [time spent in rapid eye movement sleep (REMS), relative NREMS EEG slow wave activity, NREMS EEG power density] were all reduced in wild-type mice compared to KOs from days 3 to 8 while REMS low frequency EEG power density increased in wild-type relative to KOs. In conclusion, our results indicate that the presence of functional type I IFN slightly ameliorates disease symptoms early in the X-31 infection while exacerbating disease symptoms later in the infection.
Keywords: Influenza, Virus, Interferon, Knockout Mice, REM sleep, NREM sleep, Hypothermia, Acute Phase Response
1. Introduction
In recent years it has been recognized that the collective symptoms of an acute infection [variously termed the ‘flu’ syndrome, sickness behavior, or the acute phase response (APR)] reflect adaptive physiological responses that promote recovery from infection (Dantzer, 2004). Therefore, the APR can be considered a form of innate immunity to infection that is regulated predominantly by proinflammatory cytokines (Dantzer, 2004). While the viral APR cannot be distinguished from the bacterial APR on symptomatic grounds, viral illness is frequently accompanied by circulating type I interferons (IFNs) (Gendrel et al., 1999) that are rarely detectable in bacterial infections. Type I IFNs are considered protective in viral infections and are defined currently as those antiviral cytokines that bind to the type I IFN receptor. Type I IFNs consist of IFNα (several subtypes), IFNβ, IFNω, IFNκ, IFNε, IFNτ and IFNζ at present (Chen et al., 2004a); IFNα and IFNβ are the best characterized type I IFNs. Highly purified or cloned type I IFNs induce a flu-like syndrome when given in pharmacological doses (Quesada et al., 1986; Goebel et al., 2002). Therefore, it is generally assumed that type I IFNs potentiate the viral APR, though many other cytokines known to be APR mediators are also induced by viruses (Majde, 2000). The exact role of type I IFNs as mediators of viral disease symptoms is unknown.
The availability of mice with a targeted disruption in the IFN type I receptor gene (IFN-RI knockout [KO] mice) offers the opportunity to determine if type I IFNs are indeed significant mediators or modulators of viral symptoms. Such studies are potentially complicated by the putative antiviral role of type I IFNs, but it has been shown that if a sufficiently low dose of virus is employed, recovery from an influenzal infection in IFN-RI KO mice is not impaired (Price et al., 2000). In this report we compare the body temperature response (hypothermia in mice) and sleep alterations in IFN-RI KO mice and their 129 SvEv wild-type controls challenged intranasally (IN) with a marginally lethal dose of highly purified X-31 influenza virus.
2. Methods
2.1. Mice
Two to four month old male 129 SvEv and IFN-RI KOs (on a 129 SvEv background) mice were obtained from B&K Universal, Ltd (Hull, UK). This IFN-RI KO strain lacks a functional alpha chain in the type I receptor (Mogensen et al., 1999) and shows greatly increased susceptibility to several viruses (Muller et al., 1994). Mice were quarantined in AAALAC-approved animal quarters, and then housed individually in filter-top cages in sound-attenuated environmental chambers maintained at the thermoneutral temperature (for mice) of 29 ± 1oC for all experiments. [Mice need to be maintained at a thermoneutral temperature to fully express body temperature responses to an inflammatory stimulus (Hoffman-Goetz et al., 1985).] Animals were kept on a 12:12 hr light-dark cycle with lights on at 0900 PDT. Food and water were available ad libitum. All experiments were conducted in the spring. These experiments were approved by the Washington State University Animal Care and Use Committee and conformed to National Institutes of Health guidelines.
2.2. Virus
Purified X-31 [a recombinant strain comprised of six internal genes from A/Puerto Rico/8/34 (H1N1) and two surface protein genes (hemagglutinin, neuraminidase) from A/Aichi/2/68 (H3N2)] was used for the infections. X-31 is pathogenic for mice, but is about 10-fold less lethal than its parental strain, A/Puerto Rico/8/34 (PR8), that is commonly employed in mouse influenza studies. The diminished pathogenicity of the X-31 strain is attributed to surface glycosylation that facilitates virus opsonization by serum collectins (Price et al., 2000).
The X-31 virus employed was purified from allantoic fluid harvested from specific pathogen-free chicken eggs prepared under pyrogen-free conditions by Specific Pathogen-Free Avian Supply (SPAFAS, Storrs, CT). The virus was washed 4 times and purified by sucrose density gradient centrifugation, suspended in Dulbecco’s phosphate buffered saline with Ca++ and Mg++ plus 0.2% bovine albumin (DPBS-A) (Sigma, St. Louis, MO) at 200 μg/ml of viral protein (Bio-Rad Protein Assay), and stored at −80oC (Chen et al., 2004b). Viral samples were diluted 1:10 in DPBS-A, heat inactivated by boiling for 15 min, and tested for endotoxin contamination by the Limulus lysate gel-clot assay (Cambrex BioScience, Walkersville, MD); no endotoxin was detected (detection limit = 0.125 endotoxin units/mL). The virus stock also tested negative for mycoplasma and acholeplasma species by nested PCR using a kit (American Type Culture Collection, Manassas, VA). The starting titer of the purified virus stock was 1 x 10⁶ median tissue culture infectious doses (TCID50)/mL as determined by 50% end-point dilution in triplicate at 72 hr in Madin-Darby canine kidney cells cultured with residual trypsin from cell transfer.
The stock virus was diluted 1:2000 in Hank’s Balanced Salt Solution containing Ca++ and Mg++ (Invitrogen, Carlsbad, CA) and mice were inoculated intranasally using a 100 μL micropipette with 100 TCID50 X-31 in a volume of 50 μL/mouse (25 μL each nostril) under light methoxyfluorane (Metofane, Pitman-Moore, Inc., Mundelein, IL) inhalation anesthesia. All inoculations were performed within 10 min of light onset at 0900 hr PDT. The dose of virus used was approximately 1 median lethal dose (LD50) as determined by titration in 129 SvEv mice.
In summary, this study compares the body temperature and sleep responses to approximately 1 LD50 of purified X-31 virus in 129 SvEv wild-type mice to those responses seen in IFN-RI KOs given the same IN inoculum.
2.3. Body temperature measurements
Mice (n = 6) were anesthetized intraperitoneally with ketamine/xylazine [0.1 mL/10 g body weight of ketamine stock (87 mg/kg) and xylazine stock (13 mg/kg) prepared in pyrogen-free saline]. Radio transmitters (XM-FH, Minimitter, Bend, OR) were implanted into the peritoneums of mice to remotely monitor body temperature without disturbing the animals. Following surgery, mice were placed back in their home cages and given 7 days to recover. Telemetry receivers (TR-3000, Minimitter) were placed under individual cages for recording body temperature using VitalView data acquisition software (Minimitter). Baseline temperature values were collected over 24 hr prior to infection, and then for 9 days post-infection (PI). Temperature values were averaged for 120 min episodes for each animal. These mice were subsequently implanted with EEG and EMG electrodes for sleep studies as described below. Temperature and sleep data were collected simultaneously in the same animals, as we have previously determined that the two data collection systems do not interfere with one another.
2.4. Sleep measurements
Both non-rapid-eye-movement sleep (NREMS) (Toth et al., 1995) and rapid-eye-movement sleep (REMS) are altered during a severe influenza infection (Fang et al., 1995) in a manner characteristic of acute infections with numerous microorganisms (Toth, 1999). These characteristic sleep changes are now considered a component of the viral APR. To assess sleep alterations in this study, mice (n = 8 wild-type and 9 IFN-RI KOs) were implanted with two stainless-steel electromyogram (EMG) electrodes and two stainless-steel electroencephalogram (EEG) electrodes (Plastics One Inc., Roanoke, VA) under ketamine-xylazine anesthesia as above. EEG electrodes were positioned on the dura over the parietal and occipital cortices. EMG electrodes were placed in the dorsal neck muscles to measure muscle activity. The EEG and EMG electrodes were fixed in place on top of the skull with dental cement (Duz-All, Coralite Dental Products, Skokie, IL). Following surgery, mice were placed back into their home cages and given 7 days to recover. During the last two days of this period mice were connected to lightweight recording cables for habituation to the experimental conditions. Each recording cable was suspended from a commutator (Plastics One, Inc.,), which fed into model 7D Grass amplifiers (Grass Instruments, Quincy, MA), amplifying EEG and EMG signals. The EEG one-half cutoffs for low and high frequencies were 0.5 and 35 Hz respectively. Signals from the amplifiers were fed to an analog-to-digital (AD) converter (128-Hz sampling rate) to digitize the EEG and EMG signals that were subsequently collected on a computer.
2.5. Sleep analysis
NREMS, REMS and wakefulness were visually scored off-line in 10-s epochs using criteria previously reported (Obal, Jr. et al., 2003). The behavioral state for each epoch was determined by the predominant state during the epoch. In brief, fast low-amplitude EEG with body movement and a high EMG characterized wakefulness. NREMS was associated with a high-amplitude slow wave (0.5–4 Hz) EEG, a midlevel EMG and a lack of body movements. REMS was associated with low-amplitude, consistently regular theta EEG activity, a flat EMG and no body movements other than occasional twitches. Sleep data were analyzed over 24 to 48 hr under baseline conditions (prior to inoculation) and during 12–36 hr (prodrome), 60–83 hr (acute illness), and 180–203 hr (late illness/recovery) post-inoculation with X-31. The two later time intervals were those at which body temperature changes indicated an active disease process in the mice (Fig. 1). The average amount of time spent in each vigilance state was calculated in 2-hr intervals for graphical representation. In addition, the number of NREMS and REMS episodes, and mean episode lengths, were determined using a computer program with the criterion that each episode lasted ≥ 30 s (Tables 1–2). For EEG power spectrum analyses, the EEG power density was calculated in 1 Hz intervals in the 0.5–25 Hz range during either NREMS or REMS. The values obtained during baseline recordings in each 1 Hz frequency bin for each mouse and for each state were normalized to 100. Each corresponding 1 Hz bin post-treatment value was subsequently expressed as a relative percentage of the baseline values for the mouse strain employed. Similarly, the average power of EEG NREMS slow-wave activity (SWA) (0.5–4 Hz) during a given time block in the control period was normalized to 100% for each animal for comparison to the corresponding time block in the treatment period.
Figure 1.
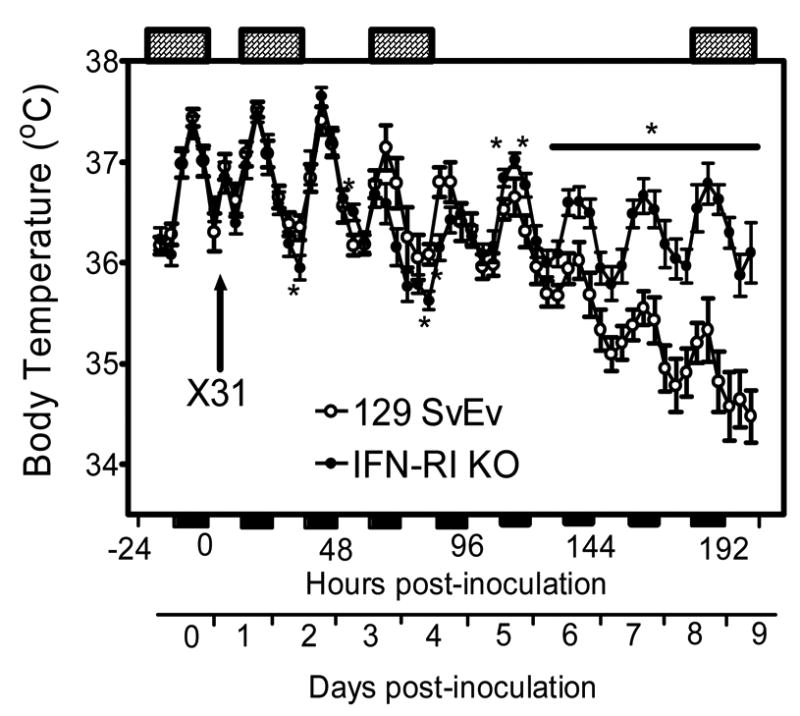
Time course of body temperature changes in 129 SvEv wild-type and IFN-RI KO mice following IN inoculation with approximately 1 LD50 of X-31 influenza virus. Data points represent the means ± SE at 4-hr intervals, n = 6 animals for each group. * P < 0.05 for IFN-RI versus 129 SvEv. The solid horizontal bars along the X axis mark the 12-hr dark periods; the cross-hatched horizontal bars at the top of the graph indicate the 24 hr periods during which sleep characteristics were analyzed (−24-0, 12–36, 60–83, and 180–203 hr PI).
Table 1.
Sleep Characteristics of X-31-infected 129 SvEv Wild-type Mice
| NREMS
| ||||
|---|---|---|---|---|
| Hours PI | Time Period | Minutes in NREMS | Number of episodes | Episode duration (min) |
| −24 – 0 hr (Baseline) | 24 hr | 596 ± 23 | 224.8 ± 11.4 | 2.78 ± .09 |
| Dark | 260 ± 15 | 106.1 ± 5.7 | 2.53 ± 0.11 | |
| Light | 336 ± 11 | 118.6 ± 8.9 | 3.02 ± 0.13 | |
| 12 – 36 hr (Stage 1) | 24 hr | 591 ± 20 | 234.3 ± 6.9 | 2.59 ± 0.07 |
| Dark | 262 ± 14 | 111.8 ± 3.4 | 2.43 ± 0.11 | |
| Light | 330 ± 8 | 122.5 ± 4.3 | 2.75 ± 0.08 | |
| 60 – 83 hr (Stage 2) | 24 hr | 602 ± 28 | 274.8 ± 16.3* | 2.30 ± 0.08* |
| Dark | 269 ± 24 | 131.0 ± 9.1* | 2.12 ± 0.10* | |
| Light | 333 ± 8 | 140.1 ± 7.8 | 2.44 ± 0.11* | |
| 180 – 203 hr (Stage 3) | 24 hr | 696 ± 20* | 264.6 ± 9.4* | 2.72 ± 0.08 |
| Dark | 367 ± 12* | 135.3 ± 3.9* | 2.81 ± 0.08 | |
| Light | 329 ± 23 | 129.4 ± 6.8 | 2.63 ± 0.08* | |
|
REMS
| ||||
| Hours PI | Time Period | Minutes in REMS | Number of episodes | Episode duration (min) |
|
| ||||
| −24 – 0 hr (Baseline) | 24 hr | 98.4 ± 8.8 | 63.9 ± 7.4 | 1.80 ± 0.08 |
| Dark | 39.0 ± 3.8 | 23.8 ± 3.2 | 2.01 ± 0.14 | |
| Light | 59.3 ± 6.6 | 40.1 ± 5.2 | 1.60 ± 0.07 | |
| 12 – 36 hr (Stage 1) | 24 hr | 97.5 ± 10.4 | 68.3 ± 8.5 | 1.63 ± 0.07 |
| Dark | 43.2 ± 5.1 | 30.3 ± 4.8 | 1.64 ± 0.10* | |
| Light | 54.2 ± 6.7 | 38.0 ± 5.1 | 1.62 ± 0.10 | |
| 60 – 83 hr (Stage 2) | 24 hr | 75.9 ± 8.8* | 44.5 ± 7.2 | 1.64 ± 0.08 |
| Dark | 28.4 ± 3.7* | 13.6 ± 4.0 | 1.64 ± 0.09 | |
| Light | 47.5 ± 4.7* | 30.9 ± 3.7 | 1.63 ± 0.09 | |
| 180 – 203 hr (Stage 3) | 24 hr | 69.3 ± 8.1* | 46.9 ± 6.6 | 1.73 ± 0.09 |
| Dark | 35.6 ± 5.0 | 23.4 ± 4.3 | 1.81 ± 0.10 | |
| Light | 33.7 ± 3.2* | 23.5 ± 3.1* | 1.65 ± 0.07 | |
Sleep times are expressed as the number of minutes spent in NREMS or REMS for a given 24-hr period following infection with approximately 1 LD50 of X-31 virus. Values are given for the total 24 hr interval or separated into 12 hr light and dark periods. The number and duration of the episodes were determined using a computer program with the criterion that each episode lasted at least 30 sec. All values are expressed as mean ± SE; n = 8 for each period.
P < 0.05 versus the respective baseline period.
Table 2.
Sleep Characteristics of X-31-infected IFN-RI KO Mice
| NREMS
| ||||
|---|---|---|---|---|
| Hours PI | Time Period | Minutes in NREMS | Number of episodes | Episode duration (min) |
| −24–0 hr (Baseline) | 24 hr | 550 ± 26 | 221.0 ± 6.6 | 2.61 ± 0.10 |
| Dark | 232 ± 12 | 107.8 ± 3.4 | 2.19 ± 0.09 | |
| Light | 318 ± 16 | 113.2 ± 5.3 | 3.02 ± 0.15 | |
| 12 – 36 hr (Stage 1) | 24 hr | 571 ± 25 | 224.3 ± 5.4 | 2.60 ± 0.07 |
| Dark | 249 ± 17 | 105.4 ± 3.2 | 2.40 ± 0.09 | |
| Light | 322 ± 12 | 118.9 ± 4.6 | 2.79 ± 0.09 | |
| 60 – 83 hr (Stage 2) | 24 hr | 680 ± 53* | 280.4 ± 9.6* | 2.61 ± 0.11 |
| Dark | 361 ± 27* | 137.6 ± 6.8* | 2.80 ± 0.20* | |
| Light | 319 ± 31 | 143.4 ± 5.6* | 2.47 ± 0.13* | |
| 180 – 203 hr (Stage 3) | 24 hr | 541 ± 24 | 237.7 ± 9.4 | 2.36 ± 0.08* |
| Dark | 274 ± 13* | 125.2 ± 6.1* | 2.31 ± 0.11 | |
| Light | 267 ± 20* | 112.4 ± 5.5 | 2.42 ± 0.10* | |
|
REMS
| ||||
| Hours PI | Time Period | Minutes in REMS | Number of episodes | Episode duration (min) |
|
| ||||
| −24 – 0 hr (Baseline) | 24 hr | 63.8 ± 5.0 | 43.3 ± 4.3 | 1.64 ± 0.06 |
| Dark | 24.9 ± 1.9 | 16.0 ± 1.7 | 1.59 ± 0.09 | |
| Light | 39.0 ± 3.2 | 27.3 ± 2.8 | 1.71 ± 0.09 | |
| 12 – 36 hr (Stage 1) | 24 hr | 63.5 ± 5.5 | 42.2 ± 4.5 | 1.74 ± 0.08 |
| Dark | 28.1 ± 2.9 | 19.1 ± 2.0 | 1.67 ± 0.11 | |
| Light | 35.4 ± 3.2 | 23.1 ± 2.9 | 1.80 ± 0.12 | |
| 60 – 83 hr (Stage 2) | 24 hr | 46.5 ± 5.9* | 24.6 ± 3.7* | 1.78 ± 0.08 |
| Dark | 21.7 ± 2.9 | 10.2 ± 2.7 | 1.64 ± 0.09 | |
| Light | 24.7 ± 2.9* | 14.3 ± 1.6* | 1.90 ± 0.12* | |
| 180 – 203 hr (Stage 3) | 24 hr | 65.5 ± 5.9 | 44.7 ± 4.6 | 1.64 ± 0.07 |
| Dark | 33.6 ± 3.2* | 23.0 ± 2.1* | 1.55 ± 0.08 | |
| Light | 31.7 ± 3.3 | 21.7 ± 3.0 | 1.72 ± 0.10 | |
Sleep times are expressed as the number of minutes spent in NREMS or REMS for a given 24-hr period following IN infection with approximately 1 LD50 of X-31 virus. Values are given for the total 24 hr interval or separated into 12-hr light and dark periods. The number and duration of the episodes were determined using a computer program with the criterion that each episode lasted at least 30 sec. All values are expressed as mean ± SE; n = 9 for each period.
P < 0.05 versus the respective baseline period.
A state-of-the art electronic sleep scoring system developed at Washington State University by Dr. David Rector (Rector et al., 2005) was used to score NREMS values across the entire 10 days of monitoring. This scoring process allowed assessment of any NREMS alterations that might have occurred outside the time intervals scored manually. Due to technical problems with the digital records of the infected KO mice, the use of this electronic system was limited to analysis of NREMS in six wild-type mice.
2.7. Illness monitoring
Mice were visually assessed daily for illness or death. Because the wild-type controls began to manifest severe symptoms (immobility, hunched posture, emaciation) on day 7 (and one died on day 8) the experiment was terminated on day 9 PI for humane reasons.
2.8 Disease staging
In the course of data analysis we observed that the symptoms could be assigned to three disease stages: Stage 1 (0–59 hr PI)—the prodrome, when the virus is present but no symptoms are manifest; Stage 2 (60–144 hr PI)—acute illness, when temperature and sleep changes become evident but are variable; and Stage 3 (145–203 hr PI)—late illness, when symptoms are unremitting and the prognosis appears predictable. These stage designations will be employed to assist the reader with conceptualization of the progression of the infection.
2.9. Statistical analysis
Two-way analysis of variance (ANOVA) for repeated measures was used to compare values between wild-type and KO mice of body temperature, NREMS, and REMS in 6 or 12 hr time blocks, followed by use of a post hoc Bonferroni t test. The GraphPad Prism 4.0 computer program was used for statistical analysis. A value of p < 0.05 was considered to indicate significant differences from control values for all tests performed.
3. Results
3.1 Baseline body temperature and sleep responses in mice lacking the IFN-RI
Baseline body temperature, locomotor activity, and sleep values in IFN-RI KOs and 129 SvEv mice have been described in detail elsewhere (Bohnet et al., 2004). In brief, body temperature and locomotor activity of the control and IFN-RI KO mice do not differ significantly from each other over the 12:12 hr light-dark cycle under baseline conditions. IFN-RI KO mice have similar amounts of NREMS compared to 129 SvEv controls with the exception of the 2 hr period prior to dark onset when the KO mice show a small (10%) but significant reduction in NREMS (Bohnet et al., 2004). In contrast, the amount of time IFN-RI KO mice spend in REMS was significantly reduced over nearly the entire light/dark cycle, with a total reduction in REMS of 30% averaged over the entire 24 hr period (Bohnet et al., 2004). The reduced time spent in REMS by IFN-RI KO mice is the result of a decrease in the total number of REMS episodes but average episode duration is unchanged from wild-type. Due to the combined effects of reduced REMS and NREMS, total wakefulness of IFN-RI KO mice is significantly increased by 11% during the 2-hr period prior to dark onset and by 15% during the last 4 hr of the dark period. Thus, the absence of the IFN-RI in the KO mice results in a substantial reduction in total time spent in spontaneous REMS and relatively minor changes in time spent in spontaneous NREMS and wakefulness. These REMS changes are accompanied by changes in hypothalamic expression of the REMS regulators hypocretin A and prolactin in the IFN-RI KOs (Bohnet et al., 2004).
Assessment of time spent in NREMS and REMS in this study confirmed the reduction in REMS time in the KOs (KO REMS mean is 36% of the wild-type control REMS mean, p < 0.0001) but did not show a significant difference in NREMS time (p = 0.169) during baseline observations. The minimal impact of REMS reduction on NREMS time is due largely to the fact that only 4–7% of the total sleep time in these mouse strains is spent in REMS.
3.2. Body temperature responses of mice challenged with X-31 influenza virus
During the first 2 days PI body temperature was unaffected in both infected mouse strains other than during the few hours immediately PI when a characteristic stress-associated temperature increase occurred (Kozak et al., 1994) (this ‘stress fever’ is not discernible in Fig. 1 because the first 24 hr of data are not shown). Hypothermia relative to baseline was seen briefly on day 2 PI in the IFN-RI KOs at dark onset (36 hr PI) and then returned to normal values (Fig. 1). Temperatures of both wild-type and KO mice declined compared to baseline during the dark period beginning at 60 hr PI (Stage 2), with a trend toward more hypothermia in the KO mice compared to wild-type during the time interval from 60 to 84 hr PI (Fig. 1). KO temperatures recovered to wild-type values at 96 hr PI (Fig. 1), though temperatures of both animal groups were below baseline (see below) at 96 hr and for the duration of the monitoring period. During the dark period from 108–120 hr PI the KO temperatures significantly exceeded those of the wild-type mice and remained higher than wild-type for the duration of the monitoring period (Fig. 1). Average body temperatures of the wild-type mice continued to decline from dark onset on day 6 (132 hr PI) through the first 12 hr of day 9 (Fig. 1), when the observation period ended. In contrast, during Stage 3 (days 6–8 PI) the KO mice retained their slightly increased average body temperatures and stabilized at day 6 values for the duration of the monitoring period (3.5 days). During the last 3.5 days of monitoring (120–204 hr PI), the KO temperature values were substantially higher than wild-type values at every time point (Fig. 1).
Though the KO mice appeared to be recovering with respect to body temperature, KO peak temperatures during the last 3.5 days of observation were lower than those measured during baseline conditions. The KO peak temperature on day 8 was 36.7°C (baseline peak 37.5ºC) while the nadir was 36.1°C (baseline nadir 36.4ºC). However, KO temperature values throughout day 8 did not differ significantly from paired baseline values (p = 0.13). Hypothermia was more prominent in 129 SvEv controls with a functional type I IFN receptor beginning at 108 hr PI, and average body temperature declined steadily in the wild-type controls for the duration of the monitoring (3.5 days). On day 8 the wild-type peak temperature was 35.3°C (baseline 37.4ºC) while the wild-type nadir was 34.8°C (baseline nadir 36.4ºC). Total temperature values for wild-type mice on day 8 differed significantly from paired baseline values (p = 0.0001).
In summary, body temperatures of both strains were not consistently altered during the first 59 hr PI (Stage 1, prodrome). Temperatures fell below baseline, with a slightly greater decline in the KOs than in the wild-type during Stage 2 (60–144 hr PI), and stabilized slightly below baseline in the KOs during Stage 3 (145 to 203 hr PI). The most striking change was the progressive decline in temperatures during Stage 3 in the wild-type mice (Fig. 1), which was accompanied by more marked illness and the death of 1/8 wild-type mice (see Section 3.7).
3.3. Sleep states of wild-type129 SvEv mice challenged with X-31 influenza virus
NREMS and REMS changes were evaluated prior to temperature changes after infection and during selected time intervals when body temperatures were changed in KOs relative to wild-type mice. No changes in temperature (Fig. 1) or sleep parameters (Table 1) were perceptible in 129 SvEv mice during the time interval 12–36 hr PI (Stage 1). Compared to baseline sleep characteristics, 129 SvEv wild-type mice showed a significant increase in the number of NREMS episodes and a reduction in NREMS episode duration during the dark period of the 60–83 hr PI observation interval (days 3–4, Stage 2), though total time spent in NREMS did not increase (Table 1, Fig. 2). During this same time interval time spent in REMS significantly declined during both light and dark periods (Table 1, Fig. 3) and REMS episode number and episode duration also declined, but not significantly (Table 1).
Figure 2.
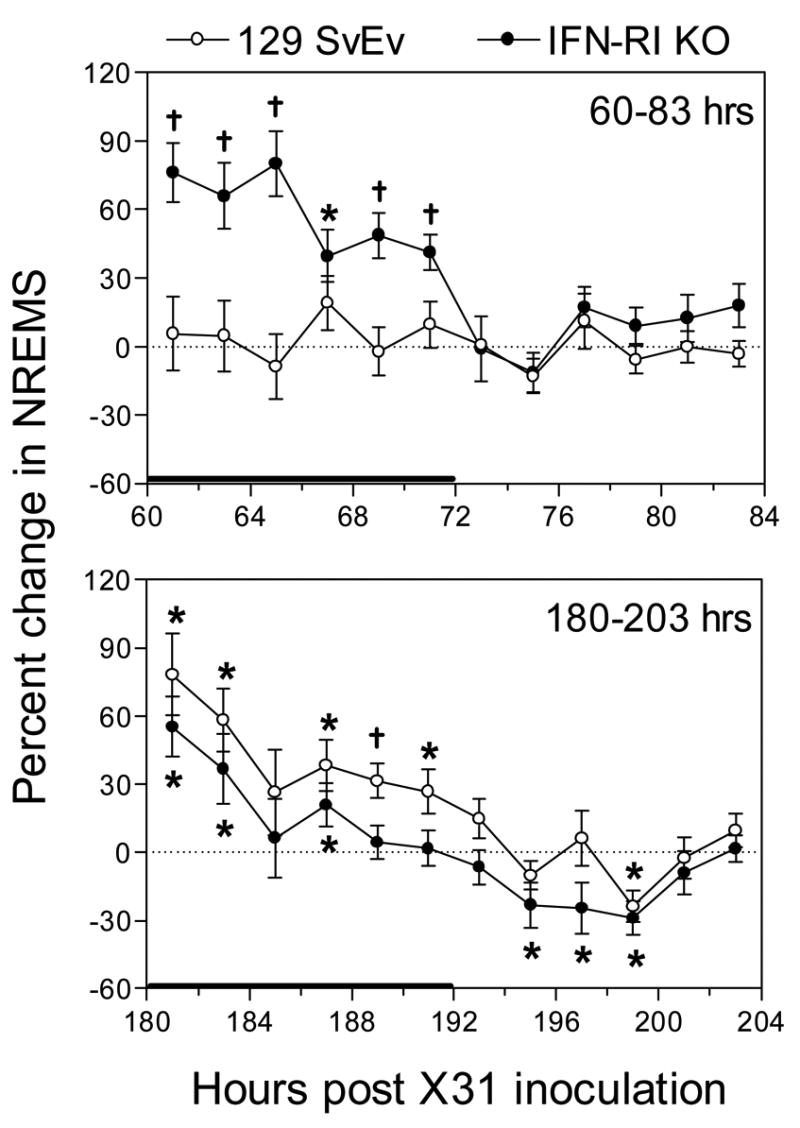
Percent change in NREMS from baseline values in 129 SvEv wild-type and IFN-RIKO mice, respectively, at 60–83 hr (top panel) and 180–203 hr (bottom panel) PI with approximately 1 LD50 of X-31. For each strain, the percent change of time spent in NREMS was determined at each time point by comparing NREMS time during the baseline period (−24–0 hr) to the corresponding NREMS value obtained during the treatment periods (either 60–83 or 180–203 hr) for each animal. Data points represent the means ± SE at 2-hr intervals, n = 8 – 9 animals for each group. A solid horizontal bar along the x-axis marks the 12-hr dark period. * P < 0.05 comparing treatment versus control within a strain; †P < 0.05 for treatment versus control within a strain and for comparing the percent change between strains. The solid horizontal bar along the x-axis marks the 12-hr dark period.
Fig. 3.
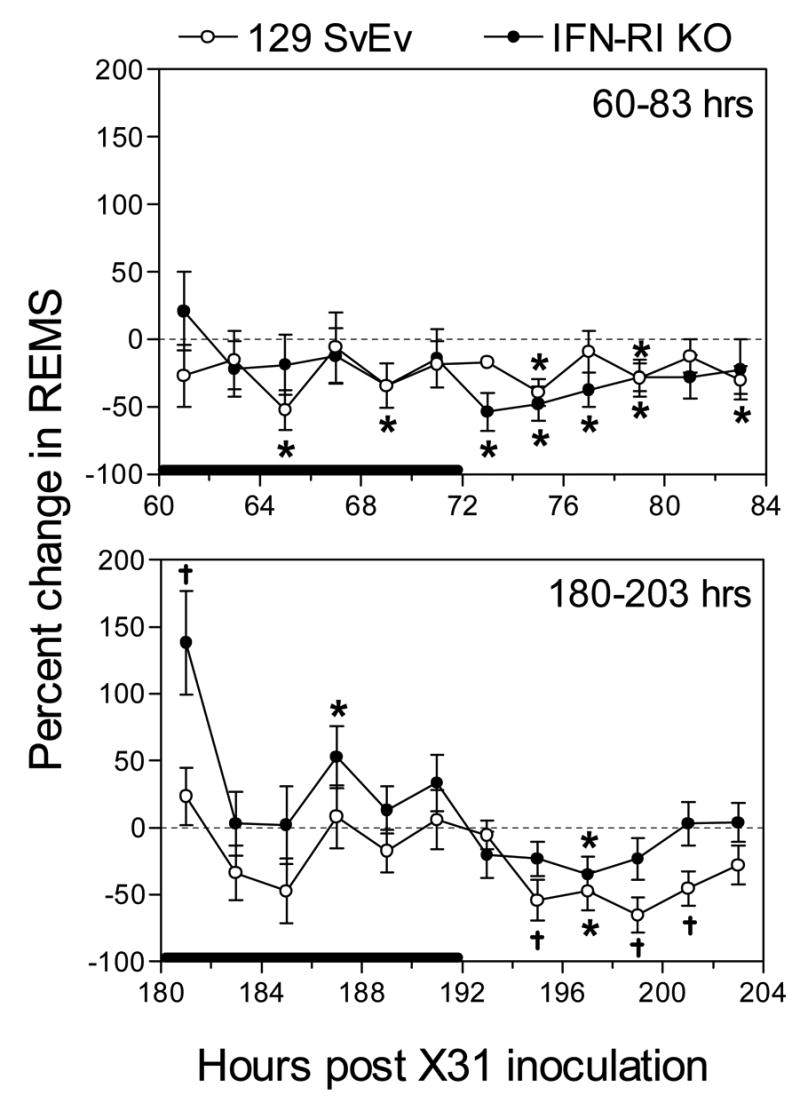
Percent change in REMS from baseline values in 129 SvEv wild-type and IFN-RI KO mice, respectively, at 60–83 hr (top panel) and 180–203 hr (bottom panel) PI with approximately 1 LD50 of X-31. For each strain, the percent change of time spent in REMS was determined at each time point by comparing REMS time during the control period (−24 to 0 hr) to the corresponding REMS value obtained in the treatment period (either 60 – 83 or 180 – 203 hr). Data points represent the means ± SE at 2-hr intervals, n = 8 – 9 animals for each group. The solid horizontal bar along the x-axis marks the 12-hr dark period. * P < 0.05 comparing treatment versus control within a strain; †P < 0.05 for treatment versus control within a strain and for comparing the percent change between strains.
During the 180–203 hr PI observation interval (days 8–9, Stage 3), when wild-type mice were severely hypothermic, the time spent in NREMS significantly increased in wild-type mice compared to baseline values during the dark period, but not during the light period (Table 1, Fig. 2). Values relative to KO mice are shown in Fig. 2 and are analyzed below. The number of NREMS episodes also increased significantly during the dark period of the 180–203 hr interval, but episode duration was significantly increased from baseline values only during the light period of the 180–203 hr interval (Table 1). Time spent in REMS during this late time interval was significantly reduced during the light period (Table 1, Fig. 3) and the number of REMS episodes was also significantly reduced during the light period at 180–203 hr PI; episode duration did not change compared to baseline values (Table 1).
Electronic scoring of NREMS data over the first 180 hr PI of the observation period revealed a gradual and steady increase in time spent in NREMS in the 6 wild-type mice that could be analyzed by this method (data not shown), confirming the manual scoring results seen in Table 1 and indicating that the time intervals scored manually are representative of the wild-type NREMS response to X-31 during all disease stages.
In summary, wild-type mice revealed no NREMS changes during the prodrome (Stage 1). During Stage 2 total time spent in NREMS was not increased but NREMS was more fragmented (i.e., more but shorter episodes, Table 1). During Stage 3 NREMS remained fragmented but the total time spent in NREMS was also increased (Fig. 2). Most of the changes in NREMS were seen during the dark periods of the respective stages (Table 1, Fig. 2). Time spent in REMS was also unchanged during Stage 1, but was reduced during Stage 2 (both light and dark periods, Table 1, Fig. 3) and Stage 3 (light period only, Table 1, Fig. 3). REMS fragmentation tended to decline in Stage 2 and Stage 3 (Table 1).
3.4. Sleep states of IFN-RI KO mice challenged with X-31 influenza virus
As in the wild-type mice, no temperature (Fig. 1) or sleep (Table 2) changes were perceptible during the 12-36 hr time interval (Stage 1). However, as in wild-type mice, sleep characteristics (and body temperatures, Fig. 1) of infected KOs were significantly altered during the 60–83 hr PI interval (Stage 2) compared to baseline values (Table 2) and wild-type values (Fig. 2). During the 60–83 hr PI interval (days 3–4 PI), time spent in NREMS increased significantly only during the dark period (Table 2, Fig. 2), and the number of sleep episodes increased during both light and dark periods (Table 2). NREMS episode duration during the 60–83 hr PI interval was significantly elevated during the dark period and significantly suppressed during the light period (Table 2). Total time spent in REMS was significantly reduced during the 60–83 hr PI interval but significance was achieved only during the light period (Table 2, Fig. 3). The total number of REMS episodes was significantly reduced, but only during the light period when the episode duration was significantly increased compared to baseline (Table 2).
During the 180–203 hr PI time interval (Stage 3), time spent in NREMS by IFNRI KO mice significantly increased during the dark period, but significantly decreased during the light period (Table 2, Fig. 2), resulting in no change in total time spent in NREMS sleep. The number of NREMS episodes increased during the dark period of the 180–203 hr PI time interval but episode duration, while increased relative to baseline, was not significantly increased during the dark period (Table 2). On the other hand, NREMS episode duration was significantly reduced during the light period (Table 2). Time spent in REMS during the 180–203 hr PI time interval significantly increased during the dark period and decreased (statistical significance not achieved) during the light period (Table 2, Fig. 3), as did time spent in NREMS during this time interval. The increased time spent in REMS during the dark period of the 180–203 hr PI time interval correlated with an increase in the number of REMS episodes during the dark period but no increase in episode duration was seen (Table 2). Similarly, the decreased time spent in REMS during the light period correlated with a reduced number of episodes, though neither value was statistically significant (Table 2).
In summary, no changes in time spent in NREMS were seen in IFNRI KO mice during the prodrome, though the large increase in NREMS time captured at the beginning of Stage 2 (Fig. 2, 60–72 hr PI) suggests that NREMS increases began in the KOs before temperature changes were manifested. NREMS time was also increased slightly relative to baseline during the dark period of Stage 3 but was below baseline during the light period. Fragmentation of NREMS was marked during Stage 2 but less so during Stage 3. NREMS changes were most marked in KOs during the dark period in both Stage 2 and Stage 3. As in wild-type controls, REMS time was markedly reduced during Stage 2 but less so during Stage 3, when it was only reduced during the dark period. REMS fragmentation was reduced during Stage 2 but slightly increased during Stage 3 (dark period only).
3.5. NREMS responses of X-31- infected wild-type mice compared to infected IFN-RI KO mice
The time spent in NREMS by the two X-31-infected mouse strains during the 60–83 hr (Stage 2) and 180–203 hr PI (Stage 3) time intervals are compared graphically in Fig. 2. The values reflect the percent change from the respective baseline values. In the 60–83 hr PI panel, a substantial increase in time spent in NREMS was seen during the dark period in the KO mice, while the wild-type control mice showed no change from baseline (Fig. 2 upper panel, as depicted numerically in Tables 1 and 2). Neither strain showed a difference from baseline during the light period (Fig. 2, upper panel) in Stage 2. During the time interval of 180–203 hr PI (Stage 3), time spent in NREMS was increased significantly for wild-type mice during the dark period at five time-points compared to baseline and one time-point compared to KO mice (Fig. 2, lower panel). The time spent in NREMS by infected KO mice was significantly increased at three time points during the dark period, but the increase is reduced relative to wild-type (Fig. 2, lower panel). NREMS time in KOs was significantly decreased during the early light period while wild-type values tend towards baseline values (Fig. 2, lower panel).
When the EEG slow wave activity (SWA) component of NREMS was examined, wild-type values were significantly decreased compared to baseline during the latter half of the dark period and sporadically decreased at six time-points during the light period of the 60–83 hr PI time interval, while KO values were not significantly altered during this interval (Fig. 4, upper panel). A striking feature of the KO values was their variability relative to wild-type values during Stage 2. EEG SWA during the 180–203 hr PI time interval (Stage 3) was unchanged in both mouse strains (Fig. 4, lower panel), but variability was substantial in both strains.
Figure 4.
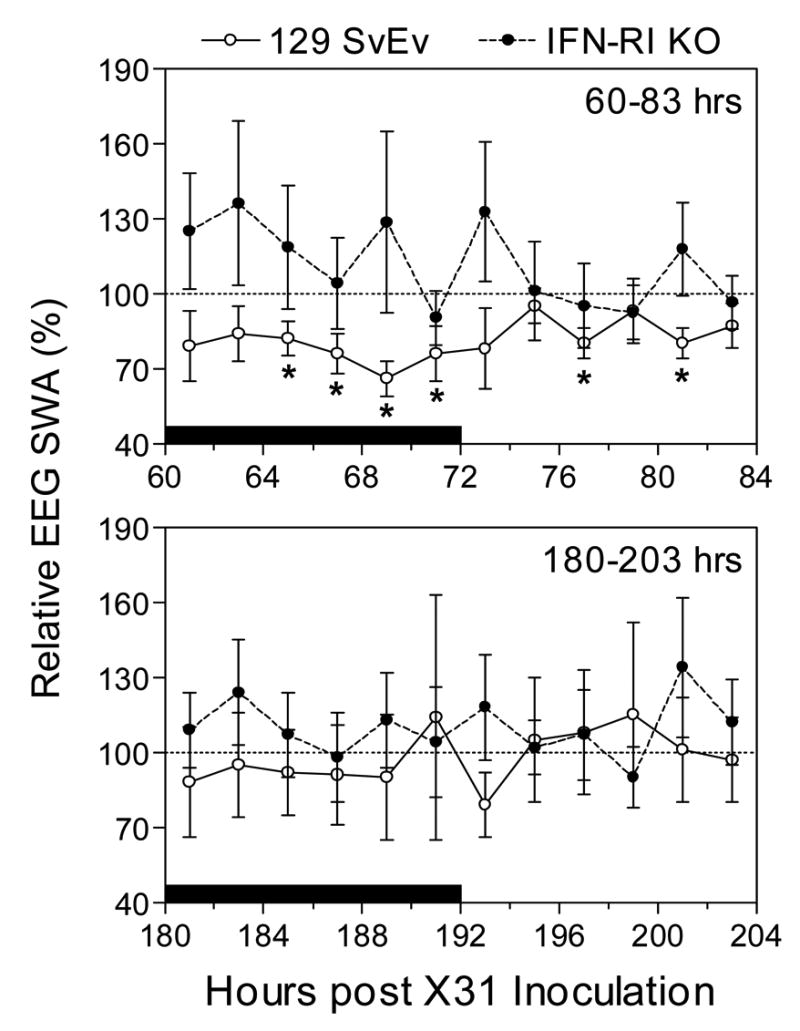
Means values of normalized EEG SWA during NREMS in 129 SvEv wild-type and IFN-RI KO mice at 60–83 hr (top panel) and 180–203 hr (bottom panel) post-infection with approximately 1 LD50 of X-31. Data points represent the means ± SE at 2-hr intervals derived by normalizing the value for a given animal and 2-hr period during the treatment phase to the corresponding SWA value obtaining during baseline recording (−24 to 0 hr), n = 8 – 9 animals for each group. * P < 0.05 for 129 SvEv versus IFN-RI KO mice. The solid horizontal bar along the x-axis marks the 12-hr dark period.
Relative NREMS EEG power density during the dark period of the 60–83 hr PI time interval (60–71 hr PI, Stage 2) was increased only in the low frequency band in KOs, while EEG power density was decreased during the dark period for wild-type mice throughout the frequency spectrum (Fig. 5, upper left panel). A similar pattern was seen during the last dark period examined (180–191 hr PI), though the NREMS power density declined in both mouse strains throughout the frequency spectrum (Fig. 5, lower left panel).
Fig. 5.

Relative power density for NREMS and REMS in 129 SvEv wild-type and IFN-RIKO mice at 60–71 hr (top panels) and 180–191 hr (bottom panels) post-infection with approximately 1 LD50 of X-31. Data points represent the means ± SE for the average treatment dark period power normalized to the baseline dark period (−13 to 0 hr) power as represented by the dotted line at 100%, n = 8 – 9 animals for each group. * P < 0.05 for 129 SvEv versus IFN-RI KO mice.
In summary, time spent in NREMS was increased more markedly in the KOs than in wild-type mice during Stage 2 (dark period only) but was increased less in KOs during Stage 3 (both dark and light periods) when the wild-type animals were severely hypothermic (Fig. 1). EEG SWA during NREMS was higher, though variable in the KOs relative to the wild type during Stage 2; these differences persisted during Stage 3, but were less marked than during Stage 2 (Fig. 4). EEG power in higher frequency bands was also greater in the KOs compared to the wild type during NREMS in both Stage 2 and Stage 3 (Fig. 5). Conversely, during REMS in both Stages 2 and 3, low frequency EEG power was less in the KOs than in the wild-type mice. Changes in EEG power, including SWA during NREMS, reflect sleep intensity and characteristically vary with state and treatments such as sleep loss or drug administration.
3.6. REMS responses of X-31-infected wild-type mice compared to infected IFN-RI KOs
During the 60–83 hr PI time interval (Stage 2), total time spent in REMS declined in both mouse strains (Tables 1 and 2, Fig. 3). Significant reduction in REMS time was seen during the light period in both strains (Tables 1 and 2) and during the dark period in wild-type only (Table 1), though a downward trend was also seen during the dark period in KO mice (Table 2, Fig. 3). Baseline REMS time was reduced about 35% in the KO mice compared to wild-type, as previously observed (Bohnet et al., 2004) (Table 2 compared to Table 1).
During the 180–203 hr PI time interval (Stage 3), time in REMS returned to baseline values during the dark period in KO mice due to an increase in the number of REMS episodes, but decreased slightly during the light period (Table 2, Fig. 3). Wild-type REMS time values during the 180–203 hr time interval, when the animals were severely hypothermic, were slightly below both baseline and KO values during the dark period (Table 1, Fig. 3), but declined significantly below both baseline and KO values during the light period (Table 1, Fig. 3). Relative EEG power density during REMS was increased significantly in wild-type mice compared to KO mice in the same low frequency range where wild-type NREMS power density decreased (Fig. 5). REMS power density in KO mice did not increase relative to baseline (Fig. 5) in either Stage 2 or Stage 3.
3.7. Lethality of X-31 in 129 SvEv and IFN-RI KO mice
All mice were infected with approximately 1 LD50 X-31 virus as previously determined in 129 SvEv mice. In this study one death occurred in 129 SvEv controls (n = 8) on day 8, but no deaths were seen in the 9 IFN-RI KOs over the 9-day PI observation period. The steadily declining temperatures in the wild-type mice suggest that all of these mice would have died if observed longer (Wong et al., 1997). However, as indicated previously, the surviving mice were euthanized at 9 days PI for humane reasons as the wild-type controls were conspicuously ill.
Discussion
Type I IFNs are significantly elevated in the serum of virus-infected patients (Bernier et al., 1984; Green et al., 1982), and administering large pharmacological doses of type I IFNs causes a severe flu-like syndrome that includes fever, anorexia (Quesada et al., 1986), and excess sleep in humans (Smedley et al., 1983) and animals (Hori et al., 1998; Krueger et al., 1987; Kimura et al., 1994). The most commonly employed IFNs in the clinic are recombinant IFNα subtypes, and generally patients receive the highest tolerated dose, resulting in rather severe toxic symptoms. Recombinant IFNβ (Salmon et al., 1996; Goebel et al., 2002) and IFNγ (Thompson et al., 1987) (which binds to a different receptor) have also been shown to be similarly toxic in pharmacological doses. When efforts are made to simulate the circulating levels of IFNα detected in mice during acute viral infections (Segall et al., 1990), flu-like symptoms are seen. These observations are consistent with a primary role of type I IFNs in mediation of the viral APR. However, pharmacological doses of IFNα result in circulating IFN levels in humans approximately 10–20 times higher than those seen during acute viral infections (Bernier et al., 1984), and may give a misleading clinical picture. In addition, we now know that numerous other cytokines known to induce the APR are induced during acute viral infections (Majde, 2000). To date IL1s, IL6 and TNFα have all been implicated as mediators of influenzal systemic symptoms in both mice (Zheng et al., 1995; Kozak et al., 1997; Kurokawa et al., 1996; Swiergiel et al., 1999) and human subjects (Kaiser et al., 2001; Hayden et al., 1998). Therefore the role of type I IFNs in mediation of viral disease symptoms remains unclear.
The temperature responses to the marginally lethal dose of X-31 influenza that we have used in this study are consistent with those seen in other, more severe mouse influenza models (Conn et al., 1995; Toth et al., 1995; Fang et al., 1995). It is generally thought that acute phase responses are protective (Dantzer, 2004), and this protective role is well established in the case of fever (Kluger et al., 1996). Hypothermia, rather than fever, tends to occur in mice and other small rodents in response to infectious challenge, especially if biotelemetry is used for temperature monitoring in place of a rectal probe [which can result in an apparent fever due to handling stress (Dilsaver et al., 1992), or even sepsis as a consequence of intestinal injury (Clement, 1993)]. Like fever, hypothermia appears to be adaptive (Romanovsky et al., 2005; Leon, 2004) and is protective in a model of lethal mouse PR8 influenza (Klein et al., 1992). Hypothermia is mediated in small rodents by the same cytokines that are pyrogenic in larger species, such as TNFα (Leon, 2004), and is accompanied by characteristic thermoregulatory behaviors, such as nesting, piloerection and hunched posture suggestive of efforts to keep warm even in a thermoneutral environment. Spontaneous hypothermia (also termed light torpor) in mice and other small animals occurs in response to cold and food deprivation (Gavrilova et al., 1999), and helps conserve energy reserves in these small mammals with a high metabolic rate. It is likely that hypothermia in response to inflammatory challenges also helps the animals conserve energy reserves.
Increased total NREMS is also associated with acute infections in all species examined (Toth, 1999), including influenza infections in mice (Fang et al., 1995; Toth et al., 1995). Increased NREMS may also preserve energy reserves as the metabolic rate falls during NREMS (Heller et al., 2004). However, the function(s) of NREMS, (and sleep in general) in health and disease remains unknown. Intuitively, getting more sleep is thought to be protective in infections. The only experimental study supporting a protective role for increased NREMS (Toth et al., 1993) (in which rabbits infected with various microbes show a better outcome when the animals express more NREMS) is correlational but supports the common perception that more sleep is beneficial. Efforts to demonstrate a benefit of sleep during mouse influenza infections using sleep deprivation have not given consistent results and are complicated by associated stress (Majde et al., 2005). In the X-31 model described here, increased NREMS (and reduced REMS) in the wild-type mice during Stage 3 (180–203 hr PI, Fig. 2) correlated with a poor prognosis (perhaps reflecting the severity of their illness), while an increase in NREMS during Stage 2 of the infection (60–83 hr PI, Fig. 2) in KO mice correlated with apparent recovery. Relating increased NREMS to disease recovery remains highly speculative as the changes may reflect immune changes during the infection rather the impact of increased NREMS per se.
Considerable indirect evidence implicates viral double-stranded RNA (dsRNA) as a major inducer of cytokines that mediate viral symptoms (Majde, 2000; Guillot et al., 2005). Based on this concept we developed a model of high-dose PR8 influenza, in which mice are challenged intratracheally (IT) with the synthetic dsRNA polyriboinosinic•polyribocytidylic acid (poly[rI•rC]) in combination with a low dose of IFNγ (Traynor et al., 2004). Using this model we have characterized the APR in the same mouse strains employed in this X-31 study (Traynor et al., 2006). While the duration of the IT poly[rI•rC]/IFNγ APR is much shorter (24 hr) than the X-31 APR described here (203 hr plus), the early increase in NREMS seen in the IT poly[rI•rC]/IFNγ-challenged IFNRI KOs is similar to that seen in our X-31 model during the 60–83 hr PI time interval. The total time spent in NREMS in the KO mice challenged IT with poly[rI•rC]/IFNγ was not increased, while total time spent in NREMS in the wild-type mice was significantly increased in a manner similar to the X-31 model described here. Hypothermia responses to IT poly[rI•rC]/IFNγ were much more exaggerated in the IFN-RI KO mice compared to the X-31 response during the 60–83 hr PI time interval. However the relationship of temperature responses in IFN-RI KO mice relative to wild-type mice was similar to that seen in the X-31 influenza model, i.e., hypothermia in KO mice was greater than that seen in wild-type mice during the Stage 2 of the infection (60–83 hr PI) when the KO mice also expressed increased NREMS relative to controls. Therefore in the absence of a functional type I IFN receptor, mice stimulated with either dsRNA or live virus in the lung experience more marked early symptoms.
The X-31 influenza model described in this report has been characterized as a classical three-stage disease model based on both temperature and sleep data: (Stage 1) the prodrome, when virus is present but no symptoms are perceptible (12–30 hr PI sleep data); (Stage 2) acute illness, when temperature and sleep changes become evident (60–83 hr PI sleep data); and (Stage 3) late illness, when symptoms are unremitting and prognosis is predictable (180–203 hr PI sleep data). Analyzed in this context, the ability of type I IFNs to bind to their receptor in the wild-type mice ameliorates the symptoms during the acute illness (Stage 2) relative to KOs, but exacerbates symptoms during the late illness phase. An important aspect of the genetic background of the 129 SvEv strain of mouse (and most inbred mouse strains commonly employed for influenza studies) is that the mice lack a functional Mx1 gene product; this IFN-inducible enzyme is central to the IFN-mediated innate resistance of mice to influenza (Staeheli, 1990). Thus the antiviral activity of type I IFNs towards influenza virus is not manifested in such mice, and therefore it is not surprising that the mice that are capable of responding to type I IFNs receive no ultimate protective benefit.
We anticipate that the effects of functioning type I IFNs on symptoms in influenza-infected mice result from interaction of type I IFNs with other components of the cytokine network as well as cells involved in innate and acquired resistance to viruses (Bogdan, 2000). Type I IFNs induce over 300 gene products in 50 different functional categories (De Veer et al., 2001) ranging from complement factors to chemokines. Of particular relevance to the responses examined in this study is the interaction of type I IFNs with cytokines known to induce hypothermia (Leon, 2004) and alter NREMS (Krueger et al., 2003), i.e., proinflammatory cytokines such as IL1β and TNFα. Several proinflammatory cytokines have been implicated in the temperature changes that occur during more severe PR8 influenza infections: IL1α (Kurokawa et al., 1996), IL1β (Zheng et al., 1995), IL6 (Kozak et al., 1997) and TNFα (Swiergiel et al., 1999) have all been shown to participate in temperature regulation in response to high dose PR8. IL1β and TNFα are also well-established regulators of spontaneous NREMS as well as NREMS alterations in response to an inflammatory stimulus (Krueger et al., 2003). The interaction of type I IFNs with proinflammatory cytokines is complex, as these IFNs induce both proinflammatory factors such as IL1 (Taylor et al., 1998) and macrophage-inflammatory protein (MIP)1α (Bug et al., 1998) as well as their endogenous regulators, such as IL1 receptor antagonist and IL10 (Tilg et al., 1993; Corssmit et al., 2000).
While it was unexpected that the absence of functional type I IFN would protect the mice from influenza, it is possible that lung inflammation, the primary cause of death in influenza-infected mice, is ameliorated by the sequence of events set in motion early in the infected IFN-RI KO mice. One mediator of interest in this context is the chemokine MIP-1α which is induced by type I IFN in vitro (Bug et al., 1998) and in vivo (Salazar-Mather et al., 2002); this chemokine is also implicated in NREMS regulation during influenza (Toth et al., 2004) as well as influenza lung pathology (Cook et al., 1995) and its synthesis is reduced in the IFN-RI KO mice (Salazar-Mather et al., 2002). However, the absence of a type I IFN receptor in the KO mice may impact on many cytokine networks in the X-31 model. Antibody neutralization of type I IFN blocks the elevation of IL1α in mouse influenza and the fever response seen in this model (Kurokawa et al., 1996). Furthermore, influenza virus levels may be changed in the absence of a functional type I IFN receptor due to non-Mx1 related mechanisms. But the net result is a more intense APR during Stage 2 of the infection in KO mice, followed by apparent recovery of the KO mice and exacerbation of symptoms in the presence of a functional type I IFN receptor late in the infection.
Acknowledgments
This work was supported by grants from the National Institutes of Health (Grant numbers HD36520 and NS31453).
Footnotes
Publisher's Disclaimer: This is a PDF file of an unedited manuscript that has been accepted for publication. As a service to our customers we are providing this early version of the manuscript. The manuscript will undergo copyediting, typesetting, and review of the resulting proof before it is published in its final citable form. Please note that during the production process errors may be discovered which could affect the content, and all legal disclaimers that apply to the journal pertain.
References
- Bernier J, Reuter A, Vrindts-Gevaert Y, Franchimont P. Radioimmunoassay of leukocyte (alpha) interferon and its application to some clinical conditions. J Nucl Med. 1984;25:765–772. [PubMed] [Google Scholar]
- Bogdan C. The function of type I interferons in antimicrobial immunity. Curr Opin Immunol. 2000;12:419–424. doi: 10.1016/s0952-7915(00)00111-4. [DOI] [PubMed] [Google Scholar]
- Bohnet SG, Traynor TR, Majde JA, Kacsoh B, Krueger JM. Mice deficient in the interferon type I receptor have reduced REM sleep and altered hypothalamic hypocretin, prolactin and 2′,5′-oligoadenylate synthase expression. Brain Res. 2004;1027:117–125. doi: 10.1016/j.brainres.2004.08.041. [DOI] [PubMed] [Google Scholar]
- Bug G, Aman MJ, Tretter T, Huber C, Peschel C. Induction of macrophage-inflammatory protein 1alpha (MIP-1alpha) by interferon-alpha. Exp Hematol. 1998;26:117–123. [PubMed] [Google Scholar]
- Chen J, Baig E, Fish EN. Diversity and relatedness among the type I interferons. J Interferon Cytokine Res. 2004a;24:687–698. doi: 10.1089/jir.2004.24.687. [DOI] [PubMed] [Google Scholar]
- Chen L, Duricka D, Nelson S, Mukherjee S, Bohnet SG, Taishi P, Majde JA, Krueger JM. Influenza virus-induced sleep responses in mice with targeted disruptions in neuronal or inducible nitric oxide synthases. J Appl Physiol. 2004b;97:17–28. doi: 10.1152/japplphysiol.01355.2003. [DOI] [PubMed] [Google Scholar]
- Clement JG. Experimentally induced mortality following repeated measurement of rectal temperature in mice. Lab Anim Sci. 1993;43:381–382. [PubMed] [Google Scholar]
- Conn CA, McClellan JL, Maassab HF, Smitka CW, Majde JA, Kluger MJ. Cytokines and the acute phase response to influenza virus in mice. Am J Physiol. 1995;268:R78–R84. doi: 10.1152/ajpregu.1995.268.1.R78. [DOI] [PubMed] [Google Scholar]
- Cook DN, Beck MA, Coffman TM, Kirby SL, Sheridan JF, Pragnell IB, Smithies O. Requirement for MIP-1α for an inflammatory response to viral infection. Science. 1995;269:1583–1585. doi: 10.1126/science.7667639. [DOI] [PubMed] [Google Scholar]
- Corssmit EPM, De Metz J, Sauerwein HP, Romijn JA. Biologic responses to IFN-α administration in humans. J Interferon Cytokine Res. 2000;20:1039–1047. doi: 10.1089/107999000750053690. [DOI] [PubMed] [Google Scholar]
- Dantzer R. Cytokine-induced sickness behaviour: a neuroimmune response to activation of innate immunity. Eur J Pharmacol. 2004;500:399–411. doi: 10.1016/j.ejphar.2004.07.040. 10-1- [DOI] [PubMed] [Google Scholar]
- De Veer MJ, Holko M, Frevel M, Walker E, Der S, Paranjape JM, Silverman RH, Williams BRG. Functional classification of interferon-stimulated genes identified using microarrays. J Leukoc Biol. 2001;69:912–920. [PubMed] [Google Scholar]
- Dilsaver SC, Overstreet DH, Peck JA. Measurement of temperature in the rat by rectal probe and telemetry yields compatible results. Pharmacology Biochemistry and Behavior. 1992;42:549–552. doi: 10.1016/0091-3057(92)90154-8. [DOI] [PubMed] [Google Scholar]
- Fang J, Sanborn CK, Renegar KB, Majde JA, Krueger JM. Influenza viral infections enhance sleep in mice. Proc Soc Exp Biol Med. 1995;210:242–252. doi: 10.3181/00379727-210-43945. [DOI] [PubMed] [Google Scholar]
- Gavrilova O, Leon LR, Marcus-Samuels B, Mason MM, Castle AL, Refetoff S, Vinson C, Reitman ML. Torpor in mice is induced by both leptin-dependent and -independent mechanisms. Proceedings of the National Academy of Sciences. 1999;96:14623–14628. doi: 10.1073/pnas.96.25.14623. 12-7- [DOI] [PMC free article] [PubMed] [Google Scholar]
- Gendrel D, Raymond J, Coste J, Moulin F, Lorrot M, Guerin S, Ravilly S, LeFevre H, Royer C, Lacombe C, Palmer P, Bohuon C. Comparison of procalcitonin with C-reactive protein, interleukin 6 and interferon-alpha for differentiation of bacterial vs. viral infections. Pediatr Infect Dis J. 1999;18:875–881. doi: 10.1097/00006454-199910000-00008. [DOI] [PubMed] [Google Scholar]
- Goebel M, Basse J, Pithan V, Exton M, Saller B, Schedlowski M, Limmroth V. Acute interferon beta-1b administration alters hypothalamic-pituitary-adrenal axis activity, plasma cytokines and leukocyte distribution in healthy subjects. Psychoneuroendocrinol. 2002;27:881. doi: 10.1016/s0306-4530(01)00099-3. [DOI] [PubMed] [Google Scholar]
- Green JA, Charette RP, Yeh TJ, Smith CB. Presence of interferon in acute- and convalescent-phase sera of humans with influenza or an influenza-like illness of undertermined etiology. J Infect Dis. 1982;145:837–841. doi: 10.1093/infdis/145.6.837. [DOI] [PubMed] [Google Scholar]
- Guillot L, Le Goffic R, Bloch S, Escriou N, Akira S, Chignard M, Si-Tahar M. Involvement of Toll-like receptor 3 in the immune response of lung epithelial cells to double-stranded RNA and influenza A virus. J Biol Chem. 2005;280:5571–5580. doi: 10.1074/jbc.M410592200. 2-18- [DOI] [PubMed] [Google Scholar]
- Hayden FG, Fritz RS, Lobo MC, Alvord WG, Strober W, Straus SE. Local and systemic cytokine responses during experimental human influenza A virus infection. Relation to symptom formation and host defense J Clin Invest. 1998;101:643–649. doi: 10.1172/JCI1355. [DOI] [PMC free article] [PubMed] [Google Scholar]
- Heller HC, Ruby NF. Sleep and circadian rhythms in mammalian torpor. Annu Rev Physiol. 2004;66:275–289. doi: 10.1146/annurev.physiol.66.032102.115313. [DOI] [PubMed] [Google Scholar]
- Hoffman-Goetz L, Keir R. Fever and survival in aged mice after endotoxin challenge. J Gerontol. 1985;40:15–22. doi: 10.1093/geronj/40.1.15. [DOI] [PubMed] [Google Scholar]
- Hori T, Katafuchi T, Take S, Shimizu N. Neuroimmunomodulatory actions of hypothalamic interferon-α. Neuroimmunomod. 1998;5:172–177. doi: 10.1159/000026334. [DOI] [PubMed] [Google Scholar]
- Kaiser L, Fritz RS, Straus SE, Gubareva L, Hayden FG. Symptom pathogenesis during acute influenza: interleukin-6 and other cytokine responses. J Med Virol. 2001;64:262–268. doi: 10.1002/jmv.1045. [DOI] [PubMed] [Google Scholar]
- Kimura M, Majde JA, Toth LA, Opp MR, Krueger JM. Somnogenic effects of rabbit and recombinant human interferons in rabbits. Am J Physiol. 1994;267:R53–R61. doi: 10.1152/ajpregu.1994.267.1.R53. [DOI] [PubMed] [Google Scholar]
- Klein MS, Conn CA, Kluger MJ. Behavioral thermoregulation in mice inoculated with influenza virus. Physiol Behav. 1992;52:1133–1139. doi: 10.1016/0031-9384(92)90472-e. [DOI] [PubMed] [Google Scholar]
- Kluger M, Kozak W, Conn CA, Leon LR, Soszynski D. The adaptive value of fever. Infect Dis Clin North Am. 1996;10:1–20. doi: 10.1016/s0891-5520(05)70282-8. [DOI] [PubMed] [Google Scholar]
- Kozak W, Conn CA, Kluger MJ. Lipopolysaccharide induces fever and depresses locomotor activity in unrestrained mice. Am J Physiol. 1994;266:R125–R135. doi: 10.1152/ajpregu.1994.266.1.R125. [DOI] [PubMed] [Google Scholar]
- Kozak W, Poli V, Soszynski D, Conn CA, Leon LR, Kluger MJ. Sickness behavior in mice deficient in interleukin-6 during turpentine abscess and influenza pneumonitis. Am J Physiol. 1997;272:R621–R630. doi: 10.1152/ajpregu.1997.272.2.R621. [DOI] [PubMed] [Google Scholar]
- Krueger JM, Dinarello CA, Shoham S, Davenne D, Walter J, Kubillus S. Interferon alpha-2 enhances slow-wave sleep in rabbits. Int J Immunopharmacol. 1987;9:23–30. doi: 10.1016/0192-0561(87)90107-x. [DOI] [PubMed] [Google Scholar]
- Krueger JM, Majde JA, Obal F., Jr Sleep in host defense. Brain Behav Immun. 2003;17:S41–S47. doi: 10.1016/s0889-1591(02)00065-x. [DOI] [PubMed] [Google Scholar]
- Kurokawa M, Imakita M, Kumeda CA, Shiraki K. Cascade of fever production in mice infected with influenza virus. J Med Virol. 1996;50:152–158. doi: 10.1002/(SICI)1096-9071(199610)50:2<152::AID-JMV8>3.0.CO;2-9. [DOI] [PubMed] [Google Scholar]
- Leon LR. Hypothermia in systemic inflammation: role of cytokines. Front Biosci. 2004;9:1877–1888. doi: 10.2741/1381. [DOI] [PubMed] [Google Scholar]
- Majde JA. Viral double-stranded RNA, cytokines and the flu. J Interferon Cytokine Res. 2000;20:259–272. doi: 10.1089/107999000312397. [DOI] [PubMed] [Google Scholar]
- Majde JA, Krueger JM. Links between the innate immune system and sleep. J Allergy Clin Immunol. 2005;116:1188–1198. doi: 10.1016/j.jaci.2005.08.005. [DOI] [PubMed] [Google Scholar]
- Mogensen KE, Lewerenz M, Reboul J, Lutfalla G, Uze G. The type I interferon receptor: structure, function, and evolution of a family business. J Interferon Cytokine Res. 1999;19:1069–1098. doi: 10.1089/107999099313019. [DOI] [PubMed] [Google Scholar]
- Muller U, Steinhoff U, Reis LF, Hemmi S, Pavlovic J, Zinkernagel RM, Aguet M. Functional role of type I and type II interferons in antiviral defense. Science. 1994;264:1918–1921. doi: 10.1126/science.8009221. [DOI] [PubMed] [Google Scholar]
- Obal F, Jr, Alt J, Taishi P, Gardi J, Krueger JM. Sleep in mice with nonfunctional growth hormone-releasing hormone receptors. Am J Physiol Regul Integr Compar Physiol. 2003;284:R131–R139. doi: 10.1152/ajpregu.00361.2002. [DOI] [PubMed] [Google Scholar]
- Price GE, Gaszewska-Mastarlarz A, Moskophidis D. The role of alpha/beta and gamma interferons in development of immunity to influenza A virus in mice. J Virol. 2000;74:3996–4003. doi: 10.1128/jvi.74.9.3996-4003.2000. [DOI] [PMC free article] [PubMed] [Google Scholar]
- Quesada JR, Talpaz M, Rios A, Kurzrock R, Gutterman JU. Clinical toxicity of interferons in cancer patients: a review. J Clin Oncol. 1986;4:234–243. doi: 10.1200/JCO.1986.4.2.234. [DOI] [PubMed] [Google Scholar]
- Rector DM, Topchiy IA, Carter KM, Rojas MJ. Local functional state differences between rat cortical columns. Brain Res. 2005;1047:45–55. doi: 10.1016/j.brainres.2005.04.002. [DOI] [PubMed] [Google Scholar]
- Romanovsky A, Almeida MC, Aronoff DM, Ivanov AI, Konsman JP, Steiner AA, Turek FW. Fever and hypothermia in systemic inflammation: recent discoveries and revisions. Front Biosci. 2005;10:2193–2216. doi: 10.2741/1690. [DOI] [PubMed] [Google Scholar]
- Salazar-Mather TP, Lewis CA, Biron CA. Type I interferons regulate inflammatory cell trafficking and macrophage inflammatory protein 1α delivery to the liver. J Clin Invest. 2002;110:321–330. doi: 10.1172/JCI15376. 8-1- [DOI] [PMC free article] [PubMed] [Google Scholar]
- Salmon P, Le Cotonnec JY, Galazka A, Adbul-Ahad A, Darrach A. Pharmacokinetics and pharmacodynamics of recombinant human interferon-β in healthy male volunteers. J Interferon Cytokine Res. 1996;16:759–764. doi: 10.1089/jir.1996.16.759. [DOI] [PubMed] [Google Scholar]
- Segall MA, Crnic LS. An animal model for the behavioral effects of interferon. Behav Neurosci. 1990;104:612–618. doi: 10.1037//0735-7044.104.4.612. [DOI] [PubMed] [Google Scholar]
- Smedley H, Katrak M, Sikola K, Wheeler T. Neurological effects of recombinant human interferon. Br Med J. 1983;286:262–264. doi: 10.1136/bmj.286.6361.262. [DOI] [PMC free article] [PubMed] [Google Scholar]
- Staeheli P. Interferon-induced proteins and the antiviral state. Adv Virus Res. 1990;38:147–200. doi: 10.1016/s0065-3527(08)60862-3. [DOI] [PubMed] [Google Scholar]
- Swiergiel AH, Dunn AJ. The roles of IL-1, IL-6, and TNF-alpha in the feeding responses to endotoxin and influenza virus infection in mice. Brain Behav Immun. 1999;13:252–265. doi: 10.1006/brbi.1999.0565. [DOI] [PubMed] [Google Scholar]
- Taylor JL, Grossberg SE. The effects of interferon-α on the production and action of other cytokines. Semin Oncol. 1998;25(Suppl 1):23–29. [PubMed] [Google Scholar]
- Thompson JA, Cox WW, Lindgren CG, Collins C, Neraas KA, Bonnem EM, Fefer A. Subcutaneous recombinant gamma interferon in cancer patients: toxicity, pharmacokinetics, and immunomodulatory effects. Cancer Immunol Immunother. 1987;25:47–53. doi: 10.1007/BF00199300. [DOI] [PMC free article] [PubMed] [Google Scholar]
- Tilg H, Mier JW, Vogel W, Aulitzky WE, Wiedermann CJ, Vannier E, Huber C, Dinarello CA. Induction of circulating IL-1 receptor antagonist by IFN treatment. J Immunol. 1993;150:4687–4692. [PubMed] [Google Scholar]
- Toth LA. Microbial modulation of sleep. In: Lydic R, editor. Handbook of Behavioral State Control: Cellular and Molecular Mechanisms. Boca Raton: CRC Press; 1999. pp. 641–657. [Google Scholar]
- Toth LA, Rehg JE, Webster RG. Strain differences in sleep and other pathophysiological sequelae of influenza virus infection in naive and immunized mice. J Neuroimmunol. 1995;58:89–99. doi: 10.1016/0165-5728(94)00193-r. [DOI] [PubMed] [Google Scholar]
- Toth LA, Tolley EA, Krueger JM. Sleep as a prognostic indicator during infectious disease in rabbits. Proc Soc Exp Biol Med. 1993;203:179–192. doi: 10.3181/00379727-203-43590. [DOI] [PubMed] [Google Scholar]
- Toth LA, Hughes LF. Macrophage participation in influenza-induced sleep enhancement in C57BL/6J mice. Brain Behav Immun. 2004;18:375–389. doi: 10.1016/j.bbi.2003.12.005. [DOI] [PubMed] [Google Scholar]
- Traynor TR, Majde JA, Bohnet SG, Krueger JM. Intratracheal double-stranded RNA plus interferon-gamma: A model for analysis of the acute phase response to respiratory viral infections. Life Sci. 2004;74:2563–2576. doi: 10.1016/j.lfs.2003.10.010. [DOI] [PubMed] [Google Scholar]
- Traynor TR, Majde JA, Bohnet SG, Krueger JM. Sleep and body temperature reponses in an acute viral infection model are altered in interferon type I receptor-deficient mice. Brain Behav Immun. 2006;20:290–299. doi: 10.1016/j.bbi.2005.08.008. [DOI] [PubMed] [Google Scholar]
- Wong JP, Saravolac EG, Clement JG, Nagata LP. Development of a murine hypothermia model for study of respiratory tract influenza virus infection. Lab Anim Sci. 1997;47:143–147. [PubMed] [Google Scholar]
- Zheng H, Fletcher D, Kozak W, Jiang M, Hofmann KJ, Conn CA, Soszynski D, Grabiec C, Trumbauer ME, Shaw A, Kostura MJ, Stevens K, Rosen H, North RJ, Chen HY, Tocci MJ, Kluger MJ, Van der Ploeg LHT. Resistance to fever induction and impaired acute-phase response in interleukin-1β-deficient mice. Immun. 1995;3:9–19. doi: 10.1016/1074-7613(95)90154-x. [DOI] [PubMed] [Google Scholar]