Abstract
Clostridium thermocellum is an anaerobic, thermophilic, cellulolytic, and ethanogenic bacterium. It produces an extracellular multiprotein complex termed the cellulosome, which consists of >70 subunits, most of them glycosyl hydrolases. It also produces many free glycosyl hydrolases. How the organism commands such a large number of genes and proteins for biomass degradation is an intriguing yet unresolved question. We identified glyR3, which is cotranscribed with the cellulase/hemicellulase genes celC and licA, as a potential cellulase transcription regulator. The gel-shift assay (EMSA) revealed that the recombinant GlyR3 bound specifically to the celC promoter region. GlyR3 was also identified from the lysate of the lichenan-grown cells, which bound to the same sequence. DNase I footprinting and competitive EMSA showed the binding site to be an 18-bp palindromic sequence with one mismatch. The DNA-binding activity was specifically inhibited by laminaribiose, a β-1-3 linked glucose dimer, in a dose-dependent manner. In in vitro transcription analysis, celC expression was repressed by rGlyR3 in a dose-dependent manner. The repression was relieved by laminaribiose, also in a dose-dependent manner. These results indicate that GlyR3 is a negative regulator of the celC operon consisting of celC, glyR3, and licA, and inducible by laminaribiose. Thus, the bacterium may modulate the biosynthesis of its enzyme components to optimize its activity on an available biomass substrate, in this case, β-1-3 glucan, because both CelC and LicA are active on the substrate. The results further indicate that, despite the insolubility of the biomass substrate, regulation of the degradative enzymes can be accomplished through soluble sugars generated by the action of the enzymes.
Keywords: cellulase, cellulosome, transcription regulation
Clostridium thermocellum is an anaerobic, thermophilic, cellulolytic, and ethanogenic bacterium. It produces a cellulase system highly active on crystalline cellulose (1). The extracellular cellulase components form an ordered protein complex termed the cellulosome (2). In addition, many free glycosyl hydrolases are produced. The core of the cellulosome is CipA, a 250-kDa noncatalytic, scaffold protein (2–5). CipA contains nine cohesin domains. Binding to the cohesin is mediated by the dockerin domain borne on the catalytic subunit (6–9). CipA further contains a cellulose-binding module (CBM), which anchors the array of catalytic components to the cellulose surface (4, 10, 11).
Searching the genome sequence of C. thermocellum revealed >70 genes encoding dockerin-containing proteins, which are presumed to be the cellulosome components (12, 13). Thus, including the genes encoding the cellulosome components, the scaffold proteins, and the free enzymes but without counting the regulatory and sugar-transport genes, there are likely >100 genes involved in biomass degradation by this bacterium. How the organism regulates the expression of such a large number of genes and proteins for biomass degradation is an intriguing question, yet so little is known. The issue is further complicated by the fact that biomass is typically a solid substrate incapable of diffusing into the cell to regulate gene expression.
It has been demonstrated that production of the overall cellulase activity by C. thermocellum is influenced by the carbon source (14–18). But it is not clear how many individual genes are subject to carbon source regulation. Recent studies focus on a few specific cellulase components. The most abundant catalytic component of the cellulosome is an exoglucanase called CelS (10, 11, 19–24). At the protein level, CelS (25, 26) and CipA (26) are up-regulated by growth on cellulose as compared with cellobiose. In addition, growth rate has been shown to affect the expression of several cellulase genes. The expression of celS is growth rate-dependent as revealed by chemostat experiments (25, 27). Similarly, the transcript levels of cipA, olpB, orf2p, celB, celG, and celD are dependent on growth rate (28, 29). In contrast, the expression of sdbA and xynC are independent from growth rate.
Despite these studies, molecular mechanisms governing the carbon-source regulation of the cellulase biosynthesis in this bacterium remain unidentified. Here we report the first cellulase gene transcriptional regulatory protein, GlyR3, of C. thermocellum. GlyR3 specifically binds to an 18-bp near perfect palindrome in the promoter region of the noncellulosomal cellulase gene celC. GlyR3 is shown to repress celC in an in vitro transcription assay. The repression is reversed by laminaribiose, a β-1-3 linked glucose dimer, which inhibits GlyR3's DNA-binding activity. The negative regulation is the first cellulase regulation mechanism found in C. thermocellum. Because celC, glyR3, and licA are cotranscribed into a polycistronic mRNA (M.N. and J.H.D.W., unpublished work), these three genes form a cellulase operon, the first demonstrated in C. thermocellum.
Results
GlyR3 Structure.
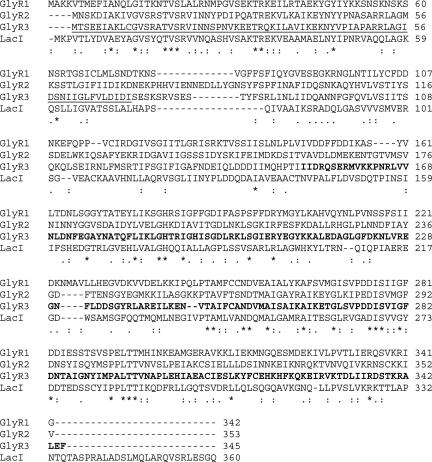
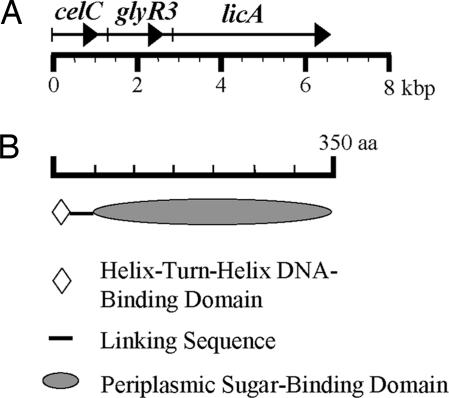
GlyR3 (353 aa) is homologous to LacI (360 aa) of Escherichia coli (27% identical and 49% similar; Fig. 1). A BLAST search (30) revealed two other C. thermocellum proteins homologous to LacI, GlyR1 (342 aa, 22% identical and 43% similar), and GlyR2 (345 aa, 29% identical and 49% similar). GlyR3 was particularly interesting because its gene is a member of the celC gene cluster and is cotranscribed with celC and licA, two cellulase or hemicellulase genes (Fig. 2A) (M.N. and J.H.D.W., unpublished work). GlyR3, as GlyR1 and GlyR2, contains two distinct domains (31, 32): a helix–turn–helix DNA-binding motif at the N-terminal end and a sugar-binding domain at the C-terminal end (Fig. 2B), suggesting that it is a regulatory protein controlled by a sugar. The location of glyR3 suggests that GlyR3 controls the expression of the celC gene cluster by binding to its promoter region.
Fig. 1.
Alignment of GlyR1, GlyR2, GlyR3, and LacI. The putative DNA-binding domain of GlyR3 is underlined, and the putative sugar-binding domain is in bold type. Asterisks indicate identical residues, colons indicate conserved residues, and single dots indicate semiconserved residues, according to the convention of the European Bioinformatics Institute (www.ebi.ac.uk/clustalw). GenBank accession numbers for the sequences are as follows: ZP_00509723 (GlyR1), ZP_00503684 (GlyR2), and ZP_00504673 (GlyR3).
Fig. 2.
Schematic drawing of the celC operon (A) and the domain structure of GlyR3 (B) of C. thermocellum.
rGlyR3 Binds to the celC Promoter Region.
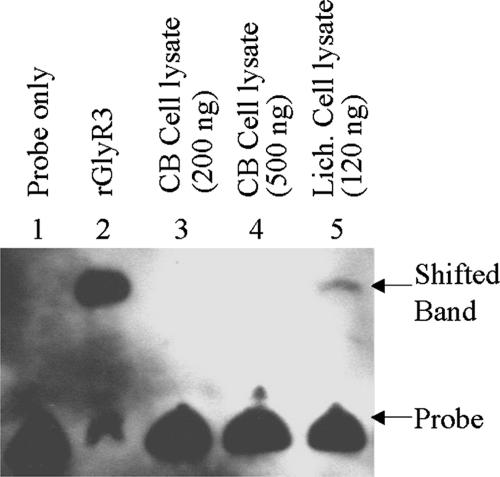
To study the function of GlyR3, we cloned its gene into E. coli with a chitin-binding domain (CBD) fused to the C terminus of the recombinant protein. Fusion with the CBD facilitated purification by affinity chromatography using chitin beads as the affinity ligand. rGlyR3 was cleaved off from the CBD, which bound to the chitin bead, by DTT treatment and appeared as the predominant protein species with the expected size (39,330 Da) on an SDS gel (data not shown). The ability of rGlyR3 to bind to the promoter region of the celC gene cluster was examined by EMSA (electrophoretic mobility shift assay). The EMSA probe, prepared by PCR using biotin-labeled primers 3 and 5 (Table 1), represented the DNA sequence 100–200 bp upstream from the start codon of the celC gene, considered as the promoter region. In EMSA, adding rGlyR3 to the reaction resulted in gel-shift of the probe (Fig. 3, lane 2), indicating that rGlyR3 binds to the celC promoter region. On the other hand, under the same condition, rGlyR3 did not bind to the probe representing the CipA promoter region (data not shown), indicating that the binding of rGlyR3 is specific. The apparent dissociation constant (KD), estimated as the concentration of rGlyR3 needed to shift 50% of the probe, was 4 × 10⁻¹⁴ M.
Table 1.
Primer and probe sequences
| No. | Sequence |
|---|---|
| 1 | F: glyR3-F-EcoRV-GCGCGATATCACCAGTGAAGAAATAGCAAAATTA |
| 2 | R: glyR3-R-XhoI-GCGCCTCGAGGAATTCCAAAGCCCTCTTGGTT |
| 3 | F: Entire celCProm-F-biotin (or fluorescein)-CCGAATAAAAACTGGACAGAG |
| 4 | R: Entire celCProm-R-Unlab-TCCTCCTGAAATATTGTGTTTTA |
| 5 | R: celCProm 1st 100bp-R-Unlab-TGAAACCATTTAACACTGGATTAT |
| 6 | F: BS-F-Biotin(or Unlab)-AATGAACGCGCGTACATT |
| 7 | R: BS-R-Unlab-AATGTACGCGCGTTCATT |
| 8 | F: Control 18-mer-F-Unlab-AACTGGACAGAGAAGAAG |
| 9 | R: Control 18-mer-R-Unlab-CTTCTTCTCTGTCCAGTT |
| 10 | F: Invt-F-CCGAATAAAAACTGGACAGAAG |
| 11 | R: Invt-R-CCAGTGGGCTTTCTGATGC |
| 12 | F: celC-F-CGGGAACATATTGCCTTTGAAC |
| 13 | R: celC-R-GGTGGAATCAATTTCCCTGATTG |
F, forward; R, reverse. Restriction sites are underlined.
Fig. 3.
Binding of rGlyR3 to the celC promoter region as revealed by EMSA. All reactions contained 5 ng of a biotin-labeled 100-bp DNA fragment corresponding to the celC promoter region. Lane 1, no protein; lane 2, rGlyR3 (1 ng); lanes 3 and 4, cell lysate from the cellobiose-grown C. thermocellum culture (200 and 500 ng of protein, respectively); lane 5, cell lysate from the lichenan-grown C. thermocellum culture (120 ng of protein). The shifted band from lane 5 was excised and subjected to MALDI-TOF analysis, confirming the binding protein to be GlyR3.
To determine that GlyR3 is indeed expressed in vivo and the protein thus expressed binds to the same sequence, the EMSA was carried out by using the cell lysate of C. thermocellum as the source of the DNA-binding protein. Although the lysate of the cellobiose-grown cells failed to bind to the celC promoter probe in two different concentrations (Fig. 3, lanes 3 and 4), the lysate of the lichenan-grown cells retarded the probe's gel mobility to the same level as rGlyR3 (Fig. 3, lane 5). To verify that the lysate protein responsible for this shift is indeed GlyR3, we eluted the shifted band from the EMSA gel and subjected it to SDS/PAGE analysis. The silver-stained protein, which was the only protein detected, had an apparent molecular mass of 39 kDa as expected for GlyR3 (data not shown). The 39-kDa protein was further eluted from the SDS gel. MALDI-TOF (matrix-assisted laser desorption/ionization time-of-flight) analysis demonstrated that the eluted protein was GlyR3 (33% sequence coverage; data not shown). These results indicate that GlyR3 is induced by lichenan and binds specifically to the celC promoter region.
Determination of the GlyR3 Binding Site by DNase I Footprinting.
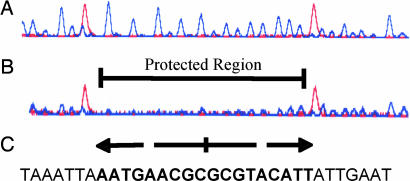
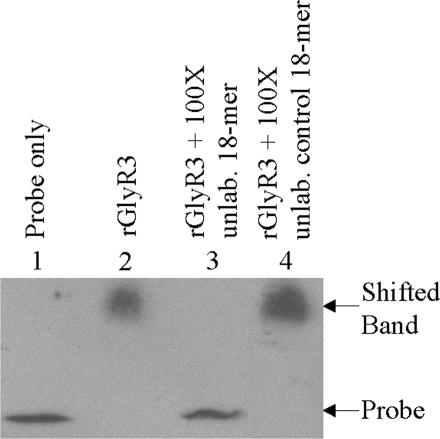
To determine the GlyR3 binding site, we developed a nonisotope DNase I footprinting technique. In this method, a fluorescein-labeled DNA fragment corresponding to the 200-bp region immediately upstream of the start codon of celC was partially digested by DNase I in the presence and absence of rGlyR3. The digested products were resolved by capillary electrophoresis and detected by using a fluorescence detector. As shown in Fig. 4, the fluorescence signals of a stretch of 18 bp were suppressed by rGlyR3 (comparing Fig. 4 A and B). The protected region corresponds to an 18-bp palindromic sequence, typical for a DNA-binding site, with only one mismatch: AATGAACGC GCGTACATT (Fig. 4C). The ability of rGlyR3 to bind to this 18-bp sequence was verified by competitive EMSA, in which an excessive amount of unlabeled, double-stranded 18-bp sequence was used to compete for binding to rGlyR3 with the biotin-labeled 100-bp celC promoter probe previously mentioned (Fig. 3). As shown in Fig. 5, the unlabeled 18-bp sequence at 100-fold concentration completely inhibited the binding of rGlyR3 to the 100-bp celC promoter probe (lane 3). In contrast, an unrelated 18-bp sequence from another site of the celC promoter region (Table 1, probes 8 and 9) failed to compete in the EMSA at the same concentration (Fig. 5, lane 4). These results indicate that rGlyR3 binds specifically to the 18-bp palindromic sequence.
Fig. 4.
GlyR3 DNA-binding site as determined by DNase I footprinting analysis. The fluorescein-labeled 200-bp DNA fragment corresponding to the celC promoter region was subjected to DNase I digestion without (A) and with (B) rGlyR3. The digested products were resolved by capillary electrophoresis and detected by a fluorescence detector. The DNA sequence corresponding to the suppressed peaks (Protected Region) is palindromic with one mismatch (C). The peaks shown in red are the internal size standards.
Fig. 5.
Competitive EMSA confirming the rGlyR3 DNA-binding site. All reactions contained 5 ng of a biotin-labeled 100-bp DNA fragment corresponding to the celC promoter region. Lane 1, no protein; lane 2, 0.5 ng of rGlyR3; lane 3, 0.5 ng of rGlyR3 and 100-fold unlabeled 18-bp binding site; lane 4, 0.5 ng of rGlyR3 and 100-fold unlabeled18-bp control fragment.
Laminaribiose Inhibits GlyR3 Binding to the celC Promoter Region.
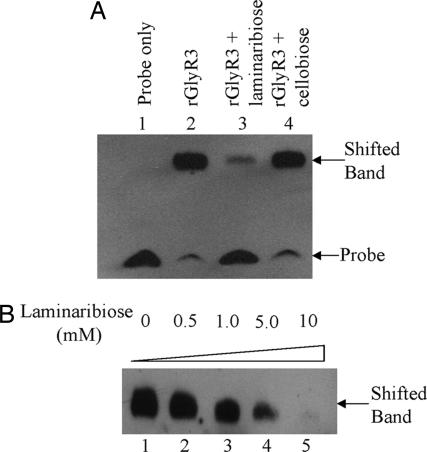
The existence of a sugar-binding domain suggests that the DNA-binding activity of GlyR3 is regulated by a sugar. Various sugars were examined for their effects on the GlyR3's DNA-binding activity by using EMSA. Among all of the sugars tested, only laminaribiose, a β-1,3-linked glucose disaccharide, was found to inhibit rGlyR3's ability to bind the 100-bp celC promoter probe at the concentration of 15 mM (Fig. 6A, lane 3). In contrast, cellobiose at the same concentration had no effect (Fig. 6A, lane 4). Other sugars, including cellotriose, cellotetraose, cellopentose, glucose, sucrose, lactose, maltose, and gentibiose, as cellobiose, showed little effect on the binding reaction (data not shown). Laminaribiose similarly inhibited the formation of the DNA-protein complex when the 18-bp binding site was used as the probe (Fig. 6B). The inhibition was dose-dependent with an observable inhibitory effect at 0.5 mM laminaribiose (lane 2).
Fig. 6.
Inhibition of GlyR3 DNA-binding activity by laminaribiose as analyzed by EMSA. (A) One hundred-base pair DNA fragment corresponding to the celC promoter region as the probe. All reactions contained 5 ng of biotin-labeled probe. Lane 1, probe only; lane 2, probe and 0.5 ng of rGlyR3; lanes 3 and 4, probe and 0.5 ng of rGlyR3 plus 15 mM laminaribiose and cellobiose, respectively. (B) Eighteen-base pair GlyR3 DNA-binding site as the probe. All reactions contained 5 ng of biotin-labeled probe and 0.5 ng of rGlyR3. Lane 1, no laminaribiose; lanes 2–5, 0.5, 1, 5, and 10 mM laminaribiose, respectively.
rGlyR3 Is a Negative Regulator Subject to Inactivation by Laminaribiose as Revealed by in Vitro Transcription Assay.
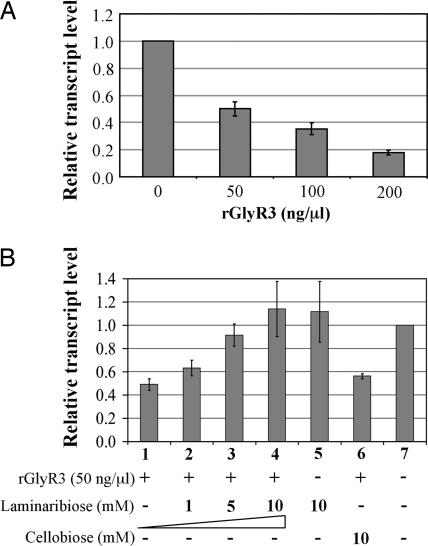
To determine whether GlyR3 serves as a transcription regulator for the expression of celC, we examined its ability to modulate the transcription of celC in an in vitro transcription assay. The assay used a DNA template consisting of the celC promoter region and the 5′ end of the celC gene. The resulting celC transcript was quantified by using quantitative reverse transcriptase- (RT-) mediated, Real-Time PCR. As shown in Fig. 7A, transcription of celC was repressed by rGlyR3 in a dose-dependent manner. Furthermore, laminaribiose reversed the repressive effect of rGlyR3, also in a dose-dependent manner (Fig. 7B, bars 1–4). The rGlyR3-repressed transcription was completely restored at 10 mM laminaribiose (Fig. 7B, bar 4). In contrast, cellobiose did not reverse the adverse effect of rGlyR3 (Fig. 7B, bar 6). Laminaribiose alone at 10 mM had little effect on transcription (Fig. 7B, bar 5). These results indicate that rGlyR3 serves as a negative regulator for the celC gene in these experiments, presumably by binding to the promoter region. The gene is induced by laminaribiose, which inactivates the binding.
Fig. 7.
Laminaribiose induction of celC by inactivating GlyR3 as revealed by in vitro transcription assay. (A) Relative transcript level determined by quantitative RT-PCR in the presence of various amounts of rGlyR3. (B) Relative transcript level in the presence of rGlyR3 and cellobiose or various amounts of laminaribiose. The data represent the averages of the results from triplicate experiments. Vertical bars represent standard deviations.
Discussion
C. thermocellum produces a highly complicated biomass-degrading enzyme system, including the cellulosome that contains >70 subunits and many free enzymes. Despite intensive studies, how the organism coordinates the expression of such a large number of enzymes to degrade a particular biomass substrate or a mixture of substrates remains elusive.
GlyR3 is the first transcriptional regulator of glycosyl hydrolase genes identified in C. thermocellum. It binds specifically to a near perfect 18-bp palindrome in the celC promoter region. Its binding site notably bears similarity to many previously reported binding sites for transcriptional regulators that are homologous to LacI and control carbon metabolism in a variety of microorganisms (Table 2). The dissociation constant (KD) for GlyR3 is estimated to be 4 × 10⁻¹⁴ M. This is near the same order of magnitude as the value for LacI (KD = 10−13 M) (33). At this time, we cannot rule out the possibility of the existence of a second binding site with a lower affinity as has been reported for LacI.
Table 2.
The DNA-binding half-sites of GlyR3 and other regulatory proteins in the GalR/LacI family
| Regulator | Sequence* | Species |
|---|---|---|
| GlyR3 | AATGAACGC | C. thermocellum |
| CelR | TGGGAGC | Thermobifida fusca |
| LacI | TTGTGAGC | E. coli |
| CcpA | TGTAAGC | Bacillus subtilis |
| GalR | GTGKAANC | E. coli |
| GalS | GTGKAANC | E. coli |
CelR–GalS binding half-sites were taken from ref. 34. K, G/T; N, any base. Conserved nucleotides are in bold type.
The role of GlyR3 as a negative regulator is evidenced by the results of the in vitro transcription assay, in which the transcription of celC was repressed by GlyR3 in a dose-dependent manner. The repression is presumed to be due to the binding of GlyR3 to the 18-bp binding site (the operator) in the promoter region. Laminaribiose serves as an inducer, presumably by binding to the sugar-binding domain of GlyR3 and inhibiting its DNA-binding activity. Because we demonstrated that celC-glyR3-licA are cotranscribed (M.N. and J.H.D.W., unpublished work), the three genes therefore form an operon repressible by GlyR3 and inducible by laminaribiose. The celC operon thus is similar to the lac operon, both operating in a negative mode. On the other hand, because glyR3 is part of the celC operon, induction of the operon would increase the level of the repressor and create a feedback loop. A continuous supply of the inducer, laminaribiose, would be needed to keep the operon in the induced state. In this regard, the celC operon functions like the E. coli hut operon, in which the repressor is part of the operon. In the absence of a continuous supply of the inducer, we expect the induction of the operon to be transient. In the soil bacterium Thermobifida fusca, a similar regulator, CelR, has been reported (34). CelR binds to a 14-bp inverted repeat in the promoter region of each of the six cellulase genes. The binding is inactivated by cellobiose, the presumed inducer. Recent data suggests that laminaribiose might also be involved in the induction (35).
Both CelC (36, 37) and LicA (38) are active on polysaccharides containing β-1,3 glucan such as lichenan and laminarin. In addition, callose, a plant cell wall polysaccharide, consists of β-1,3-linked glucose. Constitutive low-level expression of the celC operon likely generates low levels of CelC and LicA. When a substrate containing β-1,3 glucan becomes available, these two enzymes would generate the inducer, laminaribiose, as the hydrolysis product. Laminaribiose diffused or transported into the cell would turn on the operon for the biosynthesis of more enzymes. This regulation scheme is corroborated by our observation that GlyR3 was detected in the cell lysate only when the bacterium was grown on lichenan. This regulation scheme further implies that CelC and LicA are the major β-1,3 glucan-degrading enzymes in this bacterium. LicA has indeed been reported to be the major enzyme that degrades β-1,3 glucan (38). LicA was characterized as an endo-1,3(4)-β-glucanase active on barley-β-glucan and laminarin. It was shown to be up-regulated when growing on laminarin or barley-β-glucan as opposed to cellobiose or cellulose. We independently found that C. thermocellum grows on laminaribiose as the sole carbon source (data not shown). These results are consistent with the proposed regulation mechanism of the celC operon presented above. It is noteworthy that both CelC and LicA are noncellulosomal enzymes, suggesting that degradation of β-1,3 glucan does not benefit from the enzymes serving as the cellulosomal components in C. thermocellum.
Our results indicate that, despite the water insolubility of the biomass substrates, coordination of the expression of biomass-degrading enzymes can be accomplished through soluble sugars. The celC operon as a unit of gene regulation provides the first clue to the puzzle of how the bacterium coordinates the biosynthesis of such a large number of glycosyl hydrolases. GlyR3 is the first transcription regulator found in C. thermocellum. It is also the first time laminaribiose is found to serve as an inducer. It is foreseeable that more transcription factors and inducers will be found, which will further illuminate how the bacterium commands a myriad of enzymes to attack the complicated biomass substrate containing many different forms of glycans. The results will be particular illuminating in understanding whether a particular set of the cellulosome components are selected by the bacterium to optimize its activity on a particular biomass substrate.
Materials and Methods
Bacterial Strains and Plasmids.
C. thermocellum ATCC 27405 was used as the source for genomic DNA, RNA, and cell lysates. E. coli Top10 (Invitrogen) was used as the cloning host for plasmid pTXB1 (New England Biolabs). E. coli strain BL21(DE3) (Stratagene) was used for expressing recombinant GlyR3.
Culture Conditions.
C. thermocellum was grown in Hungate tubes or anaerobic flasks in chemically defined MJ medium (39) containing 0.5% carbon source (cellobiose, lichenan, or laminaribiose). Seed cultures were grown on cellobiose. The cultures were incubated at 60°C. E. coli strains containing recombinant plasmids were grown at 37°C in a shaker or on agar plates containing Luria–Bertani medium (40) supplemented with 0.1 mg/ml ampicillin. Isopropyl thiogalactoside (IPTG) (50 mM) was used to induce the expression of cloned glyR3.
Cloning of glyR3.
PCR was used to clone glyR3 with C. thermocellum genomic DNA as the template, primers 1 and 2 (Table 1), which incorporated the EcoRV and XhoI restriction sites, respectively, and a high-fidelity DNA polymerase (Extensor; Abgene). The PCR product was digested with EcoRV and XhoI, cloned into the NruI and XhoI sites of pTXB1, and transformed by electroporation into E. coli TOP10 cells. Restriction digests and DNA sequencing with the dye termination cycle sequencing method and an Applied Biosystems Model 3100 genetic analyzer were used to verify the cloned gene.
Expression and Purification of rGlyR3.
E. coli BL21(DE3) harboring pTXB1 containing the cloned glyR3 was induced with 50 mM IPTG in the exponential growth phase for 4 h. The cells were harvested by centrifugation and lysed by sonication. rGlyR3 in the lysate was purified by affinity chromatography with chitin beads as the affinity ligand following the IMPACT system protocol (New England Biolabs). The purified protein was concentrated by ultrafiltration with a Microsep 3K column (Pall) and examined for size and purity by using SDS/PAGE on a 12% gel (41).
Protein Assay.
Protein concentrations were determined by using the Bradford (42) reagent (Bio-Rad) and BSA (Sigma) as a standard.
EMSA.
The 100-bp EMSA probe was made by PCR using TaqDNA polymerase (Thermo-Start; Abgene), primer 3 labeled with biotin, and primer 5 (Table 1). The 18-bp probe consisted of complementary DNA fragments annealed by heating to 94°C and slowly cooling to room temperature (Table 1, probes 6 and 7). All EMSA experiments were performed on 4% polyacrylamide gels in Tris-borate-EDTA buffer (45 mM Tris-borate/1 mM EDTA). Each EMSA reaction mixture contained 500 ng of poly(dI-dC), 1× LightShift EMSA kit binding buffer (Pierce), 1× LightShift loading dye (Pierce), and appropriate amounts of the DNA probe and protein preparations. Sugars were added in some experiments to test their inhibitory effect as indicated. EMSA gels were electroblotted onto Biodyne B membrane (Pall). Signal development followed the LightShift Chemiluminescent EMSA kit protocol (Pierce) with BioMax films (Kodak) for luminescence detection.
DNase I Footprinting.
PCR was used to amplify the 200-bp celC promoter region, using primer 3 labeled with fluorescein and primer 4 (Table 1). The reaction mixture contained 400 ng of the amplified DNA fragment, binding buffer (10 mM Tris/50 mM KCl/1 mM DTT), 300 ng of dI-dC, 1 unit of DNase I (Invitrogen), and with or without 60 ng of rGlyR3. After incubation at 37°C for 7 min, 1 mM EDTA was added, and the mixture was heated to 70°C for 15 min. The DNase I-digested DNA products were resolved and detected by using an Applied Biosystems Model 3100 genetic analyzer.
In Vitro Transcription Assay.
In this assay (43, 44), the DNA template was generated by using primers 10 and 11 (Table 1) to amplify the 200-bp celC promoter region along with the first 650 bp of celC of the C. thermocellum genomic DNA. Each assay mixture contained 10 μl of C. thermocellum cell lysate (cellobiose-grown), 2 μl of RNase inhibitor (RNase Out; Invitrogen), 1× RNA polymerase buffer, 1 μg of DNA template, 25 nM rNTPs, different amounts of rGlyR3 and laminaribiose, and DEPC-water to a total volume of 50 μl. The reactions were incubated at 60°C for 50 min. The resulting RNA was isolated by using the TRIzol method (Invitrogen), subjected to DNase I digestion, reverse-transcribed by using random primers, and quantified by using real-time PCR with the primers specific to celC as described below.
Quantitative Real-Time PCR.
Each reaction mixture contained 1 μl of cDNA template, 7.5 μl of SYBR Green SuperMix (Bio-Rad), 5.75 μl of water, and 250 nM each primer (Table 1, primers 12 and 13). Real-time PCR was carried out by using an iCycler IQ (Bio-Rad).
Acknowledgments
We thank David Russell and Robert Zagursky for assistance in the analysis of the genomic sequence. This work was supported by U.S. Department of Energy Grant DE-FG02-94ER20155.
Footnotes
The authors declare no conflict of interest.
Data deposition: The sequences reported in this paper have been deposited in the GenBank database [accession nos. ZP_00509723 (GlyR1), ZP_00503684 (GlyR2), and ZP_00504673 (GlyR3)].
References
- 1.Johnson EA, Sakajoh M, Halliwell G, Madia A, Demain AL. Appl Environ Microbiol. 1982;43:1125–1132. doi: 10.1128/aem.43.5.1125-1132.1982. [DOI] [PMC free article] [PubMed] [Google Scholar]
- 2.Lamed R, Setter E, Bayer EA. J Bacteriol. 1983;156:828–836. doi: 10.1128/jb.156.2.828-836.1983. [DOI] [PMC free article] [PubMed] [Google Scholar]
- 3.Gerngross UT, Romaniec MP, Kobayashi T, Huskisson NS, Demain AL. Mol Microbiol. 1993;8:325–334. doi: 10.1111/j.1365-2958.1993.tb01576.x. [DOI] [PubMed] [Google Scholar]
- 4.Kruus K, Lua AC, Demain AL, Wu JHD. Proc Natl Acad Sci USA. 1995;92:9254–9258. doi: 10.1073/pnas.92.20.9254. [DOI] [PMC free article] [PubMed] [Google Scholar]
- 5.Romaniec MP, Kobayashi T, Fauth U, Gerngross UT, Demain AL. Appl Biochem Biotechnol. 1991;31:119–134. doi: 10.1007/BF02921783. [DOI] [PubMed] [Google Scholar]
- 6.Fujino T, Beguin P, Aubert JP. FEMS Microbiol Lett. 1992;73:165–170. doi: 10.1016/0378-1097(92)90602-k. [DOI] [PubMed] [Google Scholar]
- 7.Lytle BL, Volkman BF, Westler WM, Heckman MP, Wu JHD. J Mol Biol. 2001;307:745–753. doi: 10.1006/jmbi.2001.4522. [DOI] [PubMed] [Google Scholar]
- 8.Lytle BL, Volkman BF, Westler WM, Wu JHD. Arch Biochem Biophys. 2000;379:237–244. doi: 10.1006/abbi.2000.1882. [DOI] [PubMed] [Google Scholar]
- 9.Lytle BL, Westler WM, Wu JHD. In: Genetics, Biochemistry, and Ecology of Cellulose Degradation. Ohmiya K, Hayashi K, Sakka K, Kobayashi Y, Karita S, Kimura T, editors. Tokyo: Uni Publishers; 1999. pp. 444–449. [Google Scholar]
- 10.Wu JHD, Demain AL. In: Biochemistry and Genetics of Cellulose Degradation. Aubert JP, Beguin P, Millet J, editors. New York: Academic; 1988. pp. 117–131. [Google Scholar]
- 11.Wu JHD, Orme-Johnson WH, Demain AL. Biochemistry. 1988;27:1703–1709. [Google Scholar]
- 12.Demain AL, Newcomb M, Wu JHD. Microbiol Mol Biol Rev. 2005;69:124–154. doi: 10.1128/MMBR.69.1.124-154.2005. [DOI] [PMC free article] [PubMed] [Google Scholar]
- 13.Zverlov VV, Kellermann J, Schwarz WH. Proteomics. 2005;5:3646–3653. doi: 10.1002/pmic.200401199. [DOI] [PubMed] [Google Scholar]
- 14.Bayer EA, Setter E, Lamed R. J Bacteriol. 1985;163:552–559. doi: 10.1128/jb.163.2.552-559.1985. [DOI] [PMC free article] [PubMed] [Google Scholar]
- 15.Johnson EA, Bouchot F, Demain AL. J Gen Microbiol. 1985;131:2303–2308. [Google Scholar]
- 16.Lamed R, Kenig R, Setter E, Bayer EA. Enzyme Microb Technol. 1985;7:37–41. [Google Scholar]
- 17.Freier D, Mothershed CP, Wiegel J. Appl Environ Microbiol. 1988;54:204–211. doi: 10.1128/aem.54.1.204-211.1988. [DOI] [PMC free article] [PubMed] [Google Scholar]
- 18.Nochur SV, Roberts MF, Demain AL. FEMS Microbiol Lett. 1990;71:199–204. [Google Scholar]
- 19.Guimaraes BG, Souchon H, Lytle BL, Wu JHD, Alzari PM. J Mol Biol. 2002;320:587–596. doi: 10.1016/s0022-2836(02)00497-7. [DOI] [PubMed] [Google Scholar]
- 20.Kruus K, Andreacchi A, Wang WK, Wu JHD. Appl Microbiol Biotechnol. 1995;44:399–404. doi: 10.1007/BF00169935. [DOI] [PubMed] [Google Scholar]
- 21.Kruus K, Wang WK, Ching J, Wu JHD. J Bacteriol. 1995;177:1641–1644. doi: 10.1128/jb.177.6.1641-1644.1995. [DOI] [PMC free article] [PubMed] [Google Scholar]
- 22.Wang WK, Kruus K, Wu JHD. J Bacteriol. 1993;175:1293–1302. doi: 10.1128/jb.175.5.1293-1302.1993. [DOI] [PMC free article] [PubMed] [Google Scholar]
- 23.Wang WK, Kruus K, Wu JHD. Appl Microbiol Biotechnol. 1994;42:346–352. doi: 10.1007/BF00902740. [DOI] [PubMed] [Google Scholar]
- 24.Wang WK, Wu JHD. Appl Biochem Biotechnol. 1993;39/40:149–158. doi: 10.1007/BF02918985. [DOI] [PubMed] [Google Scholar]
- 25.Dror TW, Morag E, Rolider A, Bayer EA, Lamed R, Shoham Y. J Bacteriol. 2003;185:3042–3048. doi: 10.1128/JB.185.10.3042-3048.2003. [DOI] [PMC free article] [PubMed] [Google Scholar]
- 26.Zhang YH, Lynd LR. J Bacteriol. 2005;187:99–106. doi: 10.1128/JB.187.1.99-106.2005. [DOI] [PMC free article] [PubMed] [Google Scholar]
- 27.Stevenson DM, Weimer PJ. Appl Environ Microbiol. 2005;71:4672–4678. doi: 10.1128/AEM.71.8.4672-4678.2005. [DOI] [PMC free article] [PubMed] [Google Scholar]
- 28.Dror TW, Rolider A, Bayer EA, Lamed R, Shoham Y. J Bacteriol. 2003;185:5109–5116. doi: 10.1128/JB.185.17.5109-5116.2003. [DOI] [PMC free article] [PubMed] [Google Scholar]
- 29.Dror TW, Rolider A, Bayer EA, Lamed R, Shoham Y. J Bacteriol. 2005;187:2261–2266. doi: 10.1128/JB.187.7.2261-2266.2005. [DOI] [PMC free article] [PubMed] [Google Scholar]
- 30.Altschul SF, Gish W, Miller W, Myers EW, Lipman DJ. J Mol Biol. 1990;215:403–410. doi: 10.1016/S0022-2836(05)80360-2. [DOI] [PubMed] [Google Scholar]
- 31.Marchler-Bauer A, Panchenko AR, Shoemaker BA, Thiessen PA, Geer LY, Bryant SH. Nucleic Acids Res. 2002;30:281–283. doi: 10.1093/nar/30.1.281. [DOI] [PMC free article] [PubMed] [Google Scholar]
- 32.Marchler-Bauer A, Anderson JB, DeWeese-Scott C, Fedorova ND, Geer LY, He S, Hurwitz DI, Jackson JD, Jacobs AR, Lanczycki CJ, et al. Nucleic Acids Res. 2003;31:383–387. doi: 10.1093/nar/gkg087. [DOI] [PMC free article] [PubMed] [Google Scholar]
- 33.Lewis M. C R Biol. 2005;328:521–548. doi: 10.1016/j.crvi.2005.04.004. [DOI] [PubMed] [Google Scholar]
- 34.Spiridonov NA, Wilson DB. J Biol Chem. 1999;274:13127–13132. doi: 10.1074/jbc.274.19.13127. [DOI] [PubMed] [Google Scholar]
- 35.McGrath CE, Wilson DB. Biochemistry. 2006;45:14094–14100. doi: 10.1021/bi061757r. [DOI] [PubMed] [Google Scholar]
- 36.Petre D, Millet J, Longin R, Beguin P, Girard H, Aubert JP. Biochimie. 1986;68:687–695. doi: 10.1016/s0300-9084(86)80162-6. [DOI] [PubMed] [Google Scholar]
- 37.Schwarz WH, Schimming S, Rucknagel KP, Burgschwaiger S, Kreil G, Staudenbauer WL. Gene. 1988;63:23–30. doi: 10.1016/0378-1119(88)90542-2. [DOI] [PubMed] [Google Scholar]
- 38.Fuchs KP, Zverlov VV, Velikodvorskaya GA, Lottspeich F, Schwarz WH. Microbiology. 2003;149:1021–1031. doi: 10.1099/mic.0.26153-0. [DOI] [PubMed] [Google Scholar]
- 39.Johnson EA, Madia A, Demain AL. Appl Environ Microbiol. 1981;41:1060–1062. doi: 10.1128/aem.41.4.1060-1062.1981. [DOI] [PMC free article] [PubMed] [Google Scholar]
- 40.Sambrook J, Russell D. Molecular Cloning: A Laboratory Manual. Cold Spring Harbor, NY: Cold Spring Harbor Lab Press; 2001. p. A2.2. [Google Scholar]
- 41.Laemmli UK. Nature. 1970;227:680–685. doi: 10.1038/227680a0. [DOI] [PubMed] [Google Scholar]
- 42.Bradford MM. Anal Biochem. 1976;72:248–254. doi: 10.1006/abio.1976.9999. [DOI] [PubMed] [Google Scholar]
- 43.Miyazaki K, Miyamoto H, Mercer DK, Hirase T, Martin JC, Kojima Y, Flint HJ. J Bacteriol. 2003;185:2219–2226. doi: 10.1128/JB.185.7.2219-2226.2003. [DOI] [PMC free article] [PubMed] [Google Scholar]
- 44.Ohki R, Tateno K, Takizawa T, Aiso T, Murata M. J Bacteriol. 2005;187:5946–5954. doi: 10.1128/JB.187.17.5946-5954.2005. [DOI] [PMC free article] [PubMed] [Google Scholar]


