Abstract
Signal transduction in bacterial chemotaxis is initiated by the binding of extracellular ligands to a specialized family of methyl-accepting chemoreceptor proteins. Chemoreceptors cluster at distinct regions of the cell and form stable ternary complexes with the histidine autokinase CheA and the adapter protein CheW. Here we report the direct visualization and spatial organization of chemoreceptor arrays in intact Escherichia coli cells by using cryo-electron tomography and biochemical techniques. In wild-type cells, ternary complexes are arranged as an extended lattice, which may or may not be ordered, with significant variations in the size and specific location among cells in the same population. In the absence of CheA and CheW, chemoreceptors do not form observable clusters and are diffusely localized to the cell pole. At disproportionately high receptor levels, membrane invaginations containing nonfunctional, axially interacting receptor assemblies are formed. However, functional chemoreceptor arrays can be reestablished by increasing cellular levels of CheA and CheW. Our results demonstrate that chemotaxis in E. coli requires the presence of chemoreceptor arrays and that the formation of these arrays requires the scaffolding interactions of the signaling molecules CheA and CheW.
Keywords: cryo-tomography, signal transduction, molecular architecture
Bacteria respond to changes in their chemical environment by activating an assembly of proteins that collectively represent the bacterial chemotaxis apparatus (1–3). The key components in the early stages of the signaling pathway include membrane-bound chemoreceptors, the histidine autokinase CheA, and the adapter protein CheW. Chemoreceptors are localized at the poles of the cell and bind ligands through their N-terminal periplasmic domains (4–6). The cytoplasmic C-terminal signaling domains of the receptors form stable ternary complexes with CheA and CheW, both of which are important components in signal transduction. Ligand binding and release from the chemoreceptors results in conformational changes, which in turn modulate the phosphorylation state of CheA. Phosphate transfer from CheA to the response regulator CheY mediates its interaction with the flagellar rotor complex, thereby coupling sensory reception to cellular motility (1–3, 7).
Chemoreceptors form parallel homodimers in the inner membrane, with the cytoplasmic ends providing binding sites for CheA and CheW (7). A second level of receptor organization potentially involving trimers of receptor dimers has been suggested on the basis of x-ray crystallographic studies of receptor fragments and cross-linking studies of receptor mutants carrying cysteine replacements (8–11). This scenario could account for the experimentally determined average stoichiometries of chemotaxis signaling components (12) if the signaling complex units at the cell membrane are composed of two CheW monomers, one CheA dimer, and one trimer of receptor dimers. Alternate arrangements of receptor dimers have been recently suggested that also could be consistent with this stoichiometry (13). Irrespective of the precise packing arrangement of the receptors, there is considerable evidence that chemoreceptors and CheA and CheW proteins form higher-ordered assemblies at the poles of the cells (2, 4–6); however, the spatial extent of these assemblies and the interactions that hold them together remain unclear. It has been proposed that formation of polar clusters depends on either receptor associations with CheA and CheW (4, 5, 14) or receptor–receptor interactions (15–17). Estimates of cluster sizes have also varied from small discrete arrangements based on stoichiometric predictions (12, 18) to models of larger continuous signaling lattices (19–22). The association of signaling components into higher-ordered assemblies has been implicated in modulating chemoreceptor sensitivity (23) and signal gain (24), and the characterization of these assemblies will undoubtedly be critical for defining other mechanisms of chemotaxis. Here, we have carried out 2D and 3D cryo-electron microscopic analyses of wild-type Escherichia coli cells as well as a variety of engineered mutants to directly visualize chemotaxis receptor arrays at the poles of intact cells and to explore the connection between the spatial organization of these arrays and their function in bacterial chemotaxis.
Results and Discussion
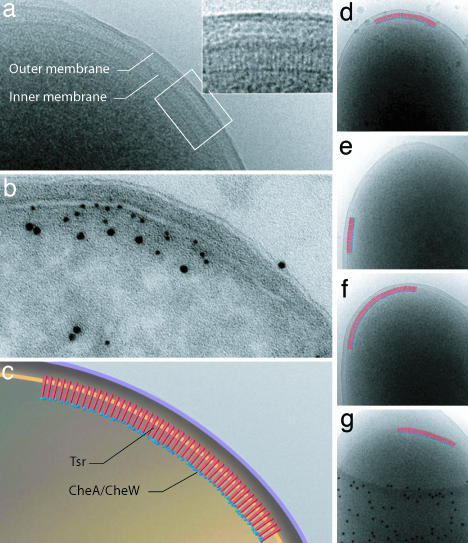
We directly visualized the arrangement of chemoreceptors in the polar region of wild-type E. coli RP437 cells by using low-dose electron microscopy (EM). Most cells displayed striations orthogonal to the cytoplasmic membrane, located near the pole; the length of these striations closely matched the expected length (≈35 nm) of chemoreceptors (11, 25). A thin line of density running parallel to the cytoplasmic membrane accompanied these striations (Fig. 1a). Neither the striations nor the additional line of density were observed in RP3098, an E. coli strain devoid of chemoreceptors, CheA, and CheW [see supporting information (SI) Fig. 6a]. Using immuno-EM, we confirmed that Tsr and CheA are present in these polar assemblies (Fig. 1b). On the basis of the expected dimensions of chemoreceptors (11, 25), the distal position of CheA relative to Tsr and the membrane (Fig. 1b) and the extensive literature on the association of chemoreceptors with CheA and CheW (26–29), we conclude that these assemblies represent extended arrays of chemoreceptors in complex with CheA and CheW (Fig. 1c).
Fig. 1.
Visualization and identification of chemoreceptor arrays. (a) Low-dose cryo-projection image of the polar region in a wild-type E. coli cell, with the chemoreceptor array shown in greater detail in Inset. (b) Immunolabeling of cryo-sections from the same culture shown in a with anti-Tsr (5 nm gold) and anti-CheA (10 nm gold) antisera. (c) Schematic representation of the polar region of wild-type E. coli cells illustrating the assembly and orientation of the chemotaxis receptor array, based on a and b. (d–g) A selection of projection images demonstrating variability in size and location of chemoreceptor arrays within a single population of cells from the same EM specimen.
Although chemoreceptor arrays were almost always observed at the poles of the cell, they demonstrated remarkable variability in location within the polar region of each cell from a single population (Fig. 1 d–g). On the basis of these observations and previous studies documenting the effect of varying nutrient conditions on chemotaxis protein expression levels (12), we imaged wild-type E. coli RP437 cells cultured in different media. Irrespective of the nutrient content of the medium used, a similar size distribution of receptor arrays was observed; the average chemoreceptor array lengths for cells grown in H1, TB, and LB media (see Materials and Methods) were 253 ± 114, 251 ± 116, and 207 ± 79 nm, respectively (SI Fig. 7a). However, the nutrient content of the media did have a clear effect on the average number of chemoreceptor arrays, with cells grown in H1 minimal medium demonstrating a greater propensity to form arrays (≈75%) than cells grown in either TB (≈58%) or LB (≈20%) medium (SI Fig. 7a). Consistent with these findings, cells grown in minimal medium displayed the highest levels of Tsr, CheA, and CheW expression (SI Fig. 7b).
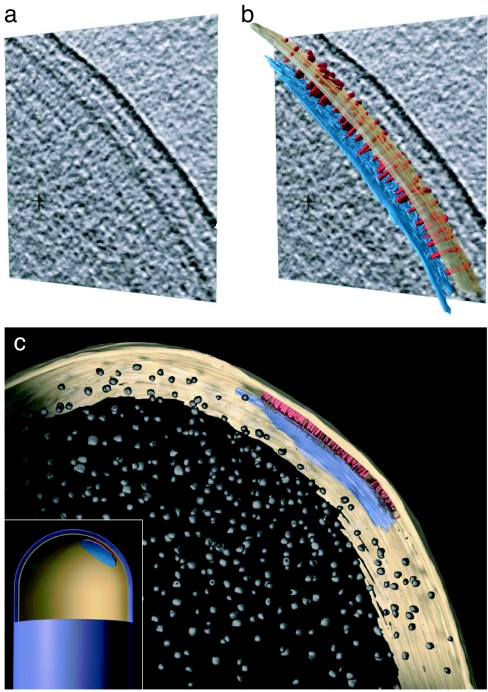
We then used cryo-electron tomography to determine the 3D architecture and extent of chemoreceptor arrays. Both the striated lateral receptor density and contributions from CheA and CheW densities were identified in raw (Fig. 2a) and segmented (Fig. 2b) tomographic slices taken from the reconstructed 3D volume of an intact cell. The arrays were generally circular or ellipsoidal in shape and spanned an area of ≈50 nm2 in the example shown (Fig. 2c). An array of this size is estimated to contain ≈6,500 receptor molecules on the basis of receptor-packing densities from previous EM studies of Tsr-containing assemblies (25); the actual values, of course, could be slightly different depending on the packing densities of ternary receptor–CheA–CheW complexes. These tomographic studies also allowed for the determination of the relative spatial location of the chemoreceptor array with respect to the pole of the cell and other prominent cellular components such as ribosomes (Fig. 2 c and Inset). At the present resolution of our studies, we cannot confirm that receptors are packed in either a strictly hexagonal (25, 22) or linear hedgerow (13) pattern. It is also possible that unlike the case of quasicrystalline receptor-only assemblies (30, 31), some or all of the chemoreceptor arrays in wild-type cells could be disordered or accommodate hybrid receptor-packing arrangements within a single array.
Fig. 2.
3D architecture of chemoreceptor arrays. (a and b) Cryo-tomography of intact wild-type E. coli highlighting the polar receptor array as seen in a single 5-nm tomographic slice (a) and as a segmented 3D representation of the chemoreceptor array (b). Densities corresponding to the inner membrane and CheA/CheW were manually segmented from a 279-slice cryo-tomogram by using the Amira visualization suite (TGS, San Diego, CA). For the sake of clarity, only a random subset of the striated densities have been segmented. Also shown is an expanded view of a manually segmented 3D representation (c) and a schematic representation of the chemoreceptor array displaying its position relative to the pole of the cell and to putative ribosomes in the cytoplasm (Inset). CheA/CheW and chemoreceptors are colored in blue and red, respectively, with the inner membrane in yellow and putative ribosomes in gray.
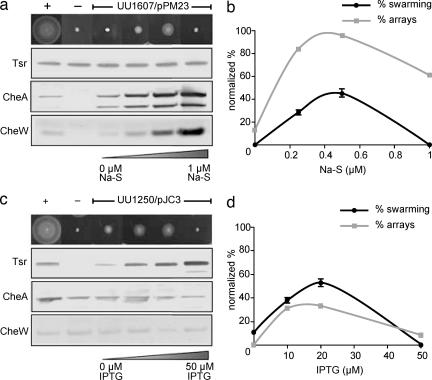
To test whether formation of chemoreceptor arrays is directly linked to the chemotaxis response, we carried out combined cryo-EM and functional studies. Using a cheA−/cheW− E. coli strain (UU1607) that expressed wild-type levels of all chemoreceptors, we regulated the expression of CheA and CheW from a single inducible plasmid (Fig. 3a). In the absence of CheA and CheW, no swarming motility was observed on soft agar plates, and no receptor arrays were observed by cryo-EM (Fig. 3 a and b). As reported in previous immuno-EM analyses, we confirmed that chemoreceptors were diffusely localized in the vicinity of the poles in cells lacking CheA and CheW and did not form detectable clusters of gold labels (4). As the expression levels of CheA and CheW were increased, swarming ability was restored in conjunction with an increase in receptor array formation (Fig. 3b), with an average chemoreceptor array length of 264 ± 79 nm at 0.5 μM Na-S. It is interesting to note that, under conditions in which CheA and CheW were greatly overexpressed (1 μM Na-S), the swarming ability of the cells was abolished (Fig. 3a) even though chemoreceptor arrays were clearly present (Fig. 3b). This deficiency in swarming could be caused by interference of excess CheA with the activity of CheY, a key regulator of flagellar motility, or a perturbation in the chemoreceptor array caused by excess CheA and CheW.
Fig. 3.
Effects of CheA, CheW, and Tsr expression on chemoreceptor array formation and chemotaxis phenotype. (a) Cells with wild-type levels of Tsr, CheA, and CheW display classical swarming behavior, which is absent in cells lacking CheA and CheW. Progressive titration of CheA/W levels results in an increase in the extent of swarming, with optimal activity observed for induction at 0.5 μM Na-S concentration. (b) Correlation between the percentages of cells displaying detectable polar arrays and the observed chemotaxis function in cheA−/cheW− cells (UU1607) carrying the inducible plasmid pPM23. (c) In cells lacking chemoreceptors, swarming behavior is absent. However, progressive titration of Tsr levels results in an increase in the extent of swarming, with optimal activity observed for induction at 20 μM IPTG concentration. (d) Correlation between the percentages of cells displaying detectable polar arrays and the observed chemotaxis function in chemoreceptor− cells (UU1250) carrying the inducible plasmid pJC3.
We further tested the correlation between array formation and chemotaxis by regulating expression levels of the serine chemoreceptor Tsr in a chemoreceptor-deficient E. coli strain (UU1250) that expressed wild-type levels of CheA and CheW. In the absence of all chemoreceptors, neither swarming motility nor array formation was observed, whereas both were progressively restored in response to increases in Tsr levels (Fig. 3 c and d), with an average chemoreceptor array length of 284 ± 105 nm at 20 μM isopropyl β-d-thiogalactopyranosidase (IPTG). It is interesting to note that functional arrays were reestablished after expression of Tsr at levels similar to those seen for all chemoreceptors combined, whereas reestablishment of swarming ability required proportionately higher amounts of CheA and CheW (Fig. 3 a and c). We note that the higher percentage of arrays observed in the cheA−/cheW− strain (Fig. 3b) could reflect contributions from basal levels of other, non-Tsr chemoreceptors in this strain.
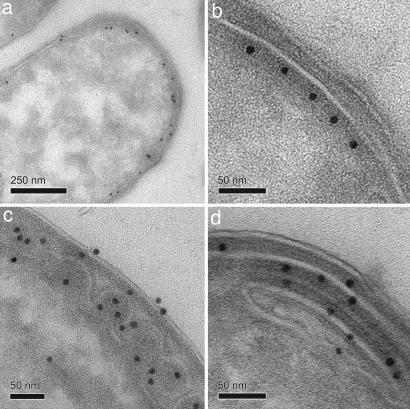
Further increase in Tsr expression (50 μM IPTG) led to a significant reduction in both swarming ability and the presence of chemoreceptor arrays (Fig. 3 c and d). Why does chemoreceptor overexpression result in the loss of swarming ability despite the presence of wild-type levels of CheA and CheW in these cells? We investigated this question by using immuno-EM to determine receptor arrangements within this population of cells (Fig. 4). A variety of receptor arrangements were observed, including two types of assemblies that contained Tsr in either radial or axial “zipper-like” invaginations of the cytoplasmic membrane (Fig. 4 c and d). These receptor assemblies were identical in size and shape to those we previously reported in cells overproducing Tsr, which formed by axial receptor–receptor interactions at the C-terminal signaling domain of the receptor and in the complete absence of CheA and CheW (25, 30, 31). Because these receptor assemblies predominated in cells that did not swarm (Fig. 3 c and d), we conclude that these structures are nonfunctional.
Fig. 4.
Effects of Tsr overexpression on chemoreceptor array formation: immunogold labeling of Tsr on frozen thin sections of E. coli UU1250/pJC3 cells induced with 50 μM IPTG by using anti-Tsr antiserum, recognized by 10-nm gold-labeled protein A. Shown are representative cells from the same section demonstrating diffuse Tsr localization and Tsr receptor arrays (a) similar to those seen in wild-type cells (b) and radial (c) and axial (d) Tsr receptor assemblies, which represent nonfunctional receptor arrays.
If nonfunctional receptor arrangements are a direct consequence of disproportionately high amounts of receptor relative to CheA and CheW, it should be possible to restore array formation by increasing CheA and CheW levels. We confirmed this hypothesis by simultaneously overproducing CheA and CheW in E. coli cells that were induced to produce the nonfunctional receptor assemblies described above. This increase in the levels of CheA and CheW restored both swarming ability and chemoreceptor array formation; the percent of arrays observed was ≈65% with an average chemoreceptor array size of 459 ± 236 nm (SI Fig. 8). A further increase in CheA and CheW levels again reduced the swarming ability of these cells (SI Fig. 8a), presumably by interfering with CheY or disrupting the chemoreceptor array. This rescue of nonfunctional receptor assemblies further highlights the critical importance of CheA and CheW for formation of functional chemoreceptor arrays.
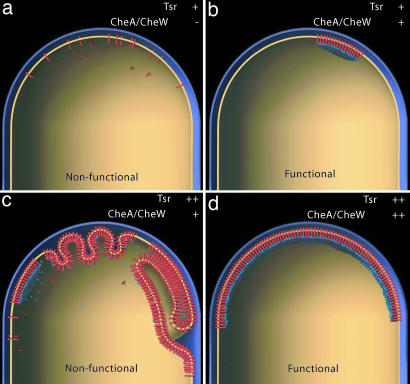
On the basis of our results, we present a schematic description of the arrangement of chemoreceptor arrays in E. coli cells. In the absence of CheA and CheW (Fig. 5a), chemoreceptors do not form functional signaling arrays at the cell pole. The observed distribution of chemoreceptors in these cells is consistent with observations that fluorescently labeled receptors form diffuse polar caps in the absence of CheA and CheW (15). Under wild-type conditions (Fig. 5b), functional chemoreceptor arrays formed at varying positions at the poles of the cells, and the frequency of observed arrays directly correlates with the expression of the chemotaxis-signaling complex. Our cryo-tomographic results confirm and extend previous cross-linking and FRET-based observations, which have suggested that chemotaxis requires higher levels of receptor organization (9, 10, 23, 24, 32), and are also consistent with previously proposed lattice-based signaling models (20, 22). The close spatial localization of signaling components may promote signal amplification as cooperative interactions between receptor squads or teams are formed (1, 32, 33). In addition, the differences in the size of chemoreceptor arrays provides a plausible explanation for the fixed stoichiometry observed between receptors, CheA, and CheW in cells expressing widely differing receptor levels (12). We conclude that measurable differences must exist in chemotactic machinery among different cells within a single population and that the observed macroscopic functional response of a population at any given instant is likely to reflect variations in spatial and molecular architecture of receptor arrays in individual cells.
Fig. 5.
Formation of chemoreceptor arrays in E. coli. (a) When chemoreceptors are expressed at wild-type levels in the absence of CheA and CheW, diffuse receptor localization is observed at the polar regions of the cell. (b) In wild-type cells, the expression of each component is regulated, and functional chemoreceptor arrays are observed. (c) When Tsr is overproduced, numerous membrane invaginations are formed in which receptors interact radially and axially, with receptor–receptor interactions substituting for interactions of receptor with CheA and CheW. (d) Compensating high receptor levels with concurrent increases in CheA and CheW levels restores the formation of extended chemoreceptor arrays.
When chemoreceptors are overexpressed (Fig. 5c), receptor–receptor-based interactions predominate, and as a result of membrane invaginations, radial and zippered receptor arrangements are formed. These axial assemblies occur in cells expressing artificially high receptor levels and are nonfunctional. Our findings do not support the recent suggestion by Wolanin et al. (17) that receptors interacting through membrane invaginations are active in signal transduction. Finally, we show that by proportionally increasing the amounts of CheA and CheW (Fig. 5d), both chemoreceptor array formation and functional chemotaxis are restored. The crucial scaffolding role of CheA and CheW in establishing extended polar chemoreceptor arrays suggests a fundamental connection between function and spatial architecture of receptor–effector assemblies in signal transduction. Knowledge of the spatial context and size variation of the polar chemoreceptor arrays in response to varying external conditions will be important for quantitative descriptions of bacterial chemotaxis signaling pathways.
Materials and Methods
Bacterial Strains and Plasmids and Physiological and Biochemical Assays.
All strains are isogenic derivatives of E. coli K12 strain RP437 (34): RP3098, UU1250, and UU1607 (10, 32). Plasmid pCJ30 is an IPTG-inducible expression vector and confers ampicillin resistance; plasmid pJC3 is derived from pCJ30 and carries wild-type tsr (9). Plasmid pKG116 is a sodium salicylate (Na-S)-inducible expression vector that confers chloramphenicol resistance; pPM23 is derived from pKG116 and carries wild-type CheA and CheW.
Bacterial strains were grown in LB broth (10% tryptone/5% yeast extract/10% NaCl), tryptone broth (10% tryptone/5% NaCl), or H1 minimal medium [11.2% K2HPO4/4.8% KH2PO4/2% (NH4)2SO4] with supplements (0.4% glycerol/1 mM of threonine, leucine, methionine, and histidine/1.25 μM FeSO) and supplemented with the appropriate antibiotics. Starter cultures were grown overnight at 34°C with 280-rpm shaking to an approximate optical density of 2.0 at 600 nm. Overnight cultures were diluted 1:40 into the same media supplemented with the appropriate antibiotics and induced with various concentrations of IPTG or Na-S. Each culture was grown to an optical density of 0.5 at 600 nm, and aliquots were immediately mixed with 4× NuPAGE lithium dodecyl sulfate/PAGE sample buffer (Invitrogen, Carlsbad, CA) plus reducing agent and boiled for 5 min or flash-frozen in liquid ethane for cryo-EM analysis (see below). Protein samples were analyzed on 4–12% SDS/PAGE gels run in either Mes or Mops running buffer (Invitrogen). Gels were transferred to PVDF membranes, blocked, and immunoblotted by using antiserum that reacts with the highly conserved Tsr signaling domain, CheA, or CheW (EvoQuest, Invitrogen); the purified proteins were a kind gift from R. Weis (University of Massachusetts, Amherst, MA). Tsr and CheA/CheW plasmids were assessed for function in strains UU1250 and UU1607, respectively, by measuring chemotactic swarming ability on tryptone semisolid agar plates (10% tryptone/5% NaCl/0.3% agar) (35). For chemotaxis phenotype rescue experiments, both Tsr and CheA/CheW plasmids were transformed into UU1250 and assayed on tryptone semisolid agar. All tryptone semisolid agar plates contained appropriate antibiotics (50 μg/μl ampicillin, 12.5 μg/μl chloramphenicol, or both) and variable amounts of inducers (IPTG, Na-S, or both). Plates were incubated at 32°C for ≈7 h.
Preparation of Specimens for Cryo-EM.
E. coli cells (3–5 μl) at an optical density of 0.5 nm at 600 nm were withdrawn directly from cultures and placed on MultiA Quantifoil grids (Quantifoil Micro Tools, Jena, Germany). The grids were manually blotted and plunge-frozen in liquid ethane maintained at approximately −180°C. For projection images, grids containing plunge-frozen cells were loaded onto a Gatan (Gatan, Pleasanton, CA) model 626 cryo-holder maintained at temperatures below −180°C. Low-dose images, with exposures typically between 10 and 20 electrons per Å2 and underfocus values of 3–4 μm, were recorded at magnifications of ×30,000 by using a Gatan 2,000 CCD camera mounted on a Tecnai 12 electron microscope (FEI, Hillsboro, OR) equipped with an LaB6 filament operating at 120 kV. For cryo-electron tomography, grids containing plunge-frozen cells were placed in cartridges and loaded into the cryo-transfer system of a Polara G2 microscope (FEI). The microscope was equipped with a field emission gun operating at 300 kV and a 2,000 × 2,000 CCD camera at the end of a GIF 2000 (Gatan) energy-filtering system. Typically, low-dose projection images (at doses of 1–2 electrons per Å2) of whole cells over a tilt range of ±70° were recorded at liquid-nitrogen temperatures in the zero-loss mode at an effective magnification of ×32,000 and underfocus values of 6–8 μm.
For immunogold labeling, bacterial cells were fixed by the addition of an equal volume of a solution containing 8% formaldehyde and 0.4% glutaraldehyde in 100 mM Hepes buffer (adjusted to pH 7.6 as tested in cultures). Cultures were spun after fixation and treated with 0.15 M glycine, pH 7.4, to quench residual aldehydes. The pellet was then resuspended in warm gelatin, cooled on ice, and cut into cubes. These cubes of cells were then cryo-protected in 15% polyvinyl pyrrolidone and sucrose to a final concentration of 1.7 M. Sections (70–100 nm in thickness) were cut at −130°C and picked up on a droplet comprised of methyl cellulose/sucrose and placed on grids (36). Grids were labeled with anti-Tsr antisera, and labeling distributions were visualized with 10-nm-sized protein A–gold. For double-labeling experiments, anti-Tsr and anti-CheA antisera were used, and labeling distributions were visualized with 5- and 10-nm protein A–gold, respectively. After labeling, sections were embedded in 2% methylcellulose with uranyl acetate to enhance membrane contrast (37).
Assessment of Chemoreceptor Array Formation by Cryo-EM and the Chemotaxis Response by Swarming Assays.
The percentage of arrays observed (Fig. 2a) were calculated from at least three individual experiments. These values were then plotted on the basis of the average length of the arrays observed for each tested medium. In Fig. 3 b and d, the number of observed arrays was normalized to the average number or arrays observed for RP437 (100%) and plotted against each induction condition. Swarming values (Fig. 3 b and d) were obtained by measuring the diameter of the swarming colony in millimeters (Fig. 3 a and c). Measurements were averaged from four replicate experiments, normalized to swarming values obtained from RP437 (100%), and plotted against each induction condition. In Fig. 3 b and d, the darker lines represent normalized percentage of swarming of each induction condition as compared with wild-type RP437 (100%); each normalized value is an average of four individual experiments, and standard deviations are presented. The gray lines represent the normalized percentage of arrays observed for each induction condition.
Supplementary Material
Acknowledgments
We thank J. S. Parkinson and P. Ames for strains, plasmids, and helpful suggestions; members of our laboratory for helpful discussions; and A. Hoofring, D. Bliss, E. Tyler, and D. Zabransky for assistance with the figures. This work was supported by funds from the Intramural Program of the National Cancer Institute.
Abbreviations
- EM
electron microscopy
- IPTG
isopropyl β-d-thiogalactopyranosidase.
Footnotes
The authors declare no conflict of interest.
This article is a PNAS direct submission.
This article contains supporting information online at www.pnas.org/cgi/content/full/0610106104/DC1.
References
- 1.Parkinson JS, Ames P, Studdert CA. Curr Opin Microbiol. 2005;8:116–121. doi: 10.1016/j.mib.2005.02.008. [DOI] [PubMed] [Google Scholar]
- 2.Sourjik V. Trends Microbiol. 2004;12:569–576. doi: 10.1016/j.tim.2004.10.003. [DOI] [PubMed] [Google Scholar]
- 3.Wadhams GH, Armitage JP. Nat Rev Mol Cell Biol. 2004;5:1024–1037. doi: 10.1038/nrm1524. [DOI] [PubMed] [Google Scholar]
- 4.Maddock JR, Shapiro L. Science. 1993;259:1717–1723. doi: 10.1126/science.8456299. [DOI] [PubMed] [Google Scholar]
- 5.Sourjik V, Berg HC. Mol Microbiol. 2000;37:740–751. doi: 10.1046/j.1365-2958.2000.02044.x. [DOI] [PubMed] [Google Scholar]
- 6.Wadhams GH, Martin AC, Armitage JP. Mol Microbiol. 2000;36:1222–1233. doi: 10.1046/j.1365-2958.2000.01936.x. [DOI] [PubMed] [Google Scholar]
- 7.Falke JJ, Hazelbauer GL. Trends Biochem Sci. 2001;26:257–265. doi: 10.1016/s0968-0004(00)01770-9. [DOI] [PMC free article] [PubMed] [Google Scholar]
- 8.Milligan DL, Koshland DE., Jr J Biol Chem. 1988;263:6268–6275. [PubMed] [Google Scholar]
- 9.Ames P, Studdert CA, Reiser RH, Parkinson JS. Proc Natl Acad Sci USA. 2002;99:7060–7065. doi: 10.1073/pnas.092071899. [DOI] [PMC free article] [PubMed] [Google Scholar]
- 10.Studdert CA, Parkinson JS. Proc Natl Acad Sci USA. 2004;101:2117–2122. doi: 10.1073/pnas.0308622100. [DOI] [PMC free article] [PubMed] [Google Scholar]
- 11.Kim KK, Yokota H, Kim SH. Nature. 1999;400:787–792. doi: 10.1038/23512. [DOI] [PubMed] [Google Scholar]
- 12.Li M, Hazelbauer GL. J Bacteriol. 2004;186:3687–3694. doi: 10.1128/JB.186.12.3687-3694.2004. [DOI] [PMC free article] [PubMed] [Google Scholar]
- 13.Park SY, Borbat PP, Gonzalez-Bonet G, Bhatnagar J, Pollard AM, Freed JH, Bilwes AM, Crane BR. Nat Struct Mol Biol. 2006;13:400–407. doi: 10.1038/nsmb1085. [DOI] [PubMed] [Google Scholar]
- 14.Lybarger SR, Maddock JR. Proc Natl Acad Sci USA. 2000;97:8057–8062. doi: 10.1073/pnas.130195397. [DOI] [PMC free article] [PubMed] [Google Scholar]
- 15.Kentner D, Thiem S, Hildenbeutel M, Sourjik V. Mol Microbiol. 2006;61:407–417. doi: 10.1111/j.1365-2958.2006.05250.x. [DOI] [PubMed] [Google Scholar]
- 16.Kim SH, Wang W, Kim KK. Proc Natl Acad Sci USA. 2002;99:11611–11615. doi: 10.1073/pnas.132376499. [DOI] [PMC free article] [PubMed] [Google Scholar]
- 17.Wolanin PM, Baker MD, Francis NR, Thomas DR, Derosier DJ, Stock JB. Proc Natl Acad Sci USA. 2006;103:14313–14318. doi: 10.1073/pnas.0606350103. [DOI] [PMC free article] [PubMed] [Google Scholar]
- 18.Levit MN, Grebe TW, Stock JB. J Biol Chem. 2002;277:36748–36754. doi: 10.1074/jbc.M204317200. [DOI] [PubMed] [Google Scholar]
- 19.Bray D, Levin MD, Morton-Firth CJ. Nature. 1998;393:85–88. doi: 10.1038/30018. [DOI] [PubMed] [Google Scholar]
- 20.Duke TA, Bray D. Proc Natl Acad Sci USA. 1999;96:10104–10108. doi: 10.1073/pnas.96.18.10104. [DOI] [PMC free article] [PubMed] [Google Scholar]
- 21.Gestwicki JE, Kiessling LL. Nature. 2002;415:81–84. doi: 10.1038/415081a. [DOI] [PubMed] [Google Scholar]
- 22.Shimizu TS, Le Novere N, Levin MD, Beavil AJ, Sutton BJ, Bray D. Nat Cell Biol. 2000;2:792–796. doi: 10.1038/35041030. [DOI] [PubMed] [Google Scholar]
- 23.Sourjik V, Berg HC. Nature. 2004;428:437–441. doi: 10.1038/nature02406. [DOI] [PubMed] [Google Scholar]
- 24.Irieda H, Homma M, Homma M, Kawagishi I. J Biol Chem. 2006;281:23880–23886. doi: 10.1074/jbc.M600018200. [DOI] [PubMed] [Google Scholar]
- 25.Weis RM, Hirai T, Chalah A, Kessel M, Peters PJ, Subramaniam S. J Bacteriol. 2003;185:3636–3643. doi: 10.1128/JB.185.12.3636-3643.2003. [DOI] [PMC free article] [PubMed] [Google Scholar]
- 26.Borkovich KA, Simon MI. Cell. 1990;63:1339–1348. doi: 10.1016/0092-8674(90)90429-i. [DOI] [PubMed] [Google Scholar]
- 27.Gegner JA, Graham DR, Roth AF, Dahlquist FW. Cell. 1992;70:975–982. doi: 10.1016/0092-8674(92)90247-a. [DOI] [PubMed] [Google Scholar]
- 28.Ninfa EG, Stock A, Mowbray S, Stock J. J Biol Chem. 1991;266:9764–9770. [PubMed] [Google Scholar]
- 29.Boukhvalova MS, Dahlquist FW, Stewart RC. J Biol Chem. 2002;277:22251–22259. doi: 10.1074/jbc.M110908200. [DOI] [PubMed] [Google Scholar]
- 30.Zhang P, Bos E, Heymann J, Gnaegi H, Kessel M, Peters PJ, Subramaniam S. J Microsc. 2004;216:76–83. doi: 10.1111/j.0022-2720.2004.01395.x. [DOI] [PubMed] [Google Scholar]
- 31.Lefman J, Zhang P, Hirai T, Weis RM, Juliani J, Bliss D, Kessel M, Bos E, Peters PJ, Subramaniam S. J Bacteriol. 2004;186:5052–5061. doi: 10.1128/JB.186.15.5052-5061.2004. [DOI] [PMC free article] [PubMed] [Google Scholar]
- 32.Studdert CA, Parkinson JS. Proc Natl Acad Sci USA. 2005;102:15623–15628. doi: 10.1073/pnas.0506040102. [DOI] [PMC free article] [PubMed] [Google Scholar]
- 33.Ames P, Parkinson JS. Proc Natl Acad Sci USA. 2006;103:9292–9297. doi: 10.1073/pnas.0602135103. [DOI] [PMC free article] [PubMed] [Google Scholar]
- 34.Parkinson JS, Houts SE. J Bacteriol. 1982;151:106–113. doi: 10.1128/jb.151.1.106-113.1982. [DOI] [PMC free article] [PubMed] [Google Scholar]
- 35.Adler J. Science. 1966;153:708–716. doi: 10.1126/science.153.3737.708. [DOI] [PubMed] [Google Scholar]
- 36.Liou W, Geuze HJ, Slot JW. Histochem Cell Biol. 1996;106:41–58. doi: 10.1007/BF02473201. [DOI] [PubMed] [Google Scholar]
- 37.Griffiths G, Simons K, Warren G, Tokuyasu KT. Methods Enzymol. 1983;96:466–485. doi: 10.1016/s0076-6879(83)96041-x. [DOI] [PubMed] [Google Scholar]
Associated Data
This section collects any data citations, data availability statements, or supplementary materials included in this article.


