Abstract
Fibroblast growth factor receptor 3 (FGFR3) plays an important role in the control of chondrocyte proliferation and differentiation, a process critical for normal development of the skeleton. To reveal the contributions of the epithelial Fgfr3b isoform and the mesenchymal Fgfr3c isoform to skeletal overgrowth seen in mice, in which both isoforms have been inactivated (Fgf3c−/− mice), we have generated mice in which each of the two Fgfr3 isoforms has been selectively inactivated. Whereas no apparent phenotype was detected in Fgfr3b−/− mice, strong stimulation of chondrocyte proliferation in the growth plates of Fgf3c−/− mice caused dramatic skeletal overgrowth and other skeletal abnormalities resembling the phenotype of mice deficient in both Fgfr3 isoforms. In addition, Fgfr3c−/− mice exhibited decreased bone mineral density in the cortical and trabecular bone, whereas the bone mineral density of Fgfr3b−/− mice resembled that of WT mice. These experiments demonstrated that the mesenchymal Fgfr3c isoform is responsible for controlling chondrocyte proliferation and differentiation that mediate normal skeletal development, whereas the epithelial Fgfr3b isoform does not contribute toward this process.
Keywords: bone, chondrocyte, gene targeting, cell proliferation, cartilage
Fibroblast growth factors (FGFs) and their surface receptors regulate a great variety of cellular processes during embryonic and postnatal development and in adults that include pattern formation and organogenesis, homeostasis of glucose and phosphate metabolism, wound healing, and angiogenesis (1–7). The four receptor tyrosine kinases that function as FGF receptors (FGFRs) are each composed of an extracellular ligand binding domain, a single-pass transmembrane domain, and an intracellular portion containing a tyrosine kinase domain. The extracellular region is composed of three Ig-like domains, named D1–D3, a stretch of seven to eight acidic amino acids that connects D1 to D2, known as the “acidic box,” and a conserved region in D2 that serves as a binding site for heparin (8). It has been shown that D2 and D3 function as an FGF binding region, whereas FGF binding selectivity is controlled primarily by interactions with D3 (9). A unique aspect of FGFRs that sets this receptor family apart from other receptor tyrosine kinases is that through alternative RNA splicing each of the Fgfr1–3 genes encodes for two different receptor isoforms with distinct FGF binding characteristics, tissue expression pattern, and biological response (10). Briefly, the amino-terminal half of D3 is coded by a common exon 7, and the carboxyl-terminal half of D3 is coded by either exon 8 or exon 9, whose products are designated the “b” or “c” FGFR isoforms, respectively. Interestingly, all b isoforms are expressed exclusively in epithelial cells, whereas all c isoforms are expressed exclusively in mesenchymal cells (11). Moreover, the two splice variants of FGFR bind to and are activated by different complements of FGF molecules (12–14).
Insights into the in vivo biological roles of FGFRs were gained by analyzing the phenotypes of mice deficient in individual or combinations of Fgfr genes. It was shown that, whereas Fgfr1b−/− mice are normal with no obvious phenotype, Fgfr1c−/− mice die at embryonic day 9.5 during gastrulation because of impairment in cell migration through the primitive streak (15). Mice deficient in both Fgfr1 isoforms show a phenotype similar to that of Fgfr1c−/− mice (16, 17), demonstrating that the early embryonic phenotype is caused by deficiency in the Fgfr1c isoform (15). Fgfr2b−/− mice, on the other hand, die after birth because of severe impairment in lung development; these mice also lack all four limbs and show impairment in the development of the salivary gland, adrenal gland, thymus, and pancreas (18). Selective disruption of the Fgfr2c isoform caused impairment in skeletal development due to delayed ossification (19), and disruption of both Fgfr2 isoforms resulted in lethality at embryonic day 10.5 due to impairment in placental development (20). Finally, the targeted disruption of both Fgfr3 isoforms caused overgrowth of long bones and vertebrae (21, 22). However, mice that are deficient in Fgfr3b or Fgfr3c selectively have not yet been described.
In this report we describe the generation of Fgfr3b−/− and Fgfr3c−/− mice and characterization of their phenotypes. The mutations in the Fgfr3 gene were engineered to enable normal expression and function of the isoform that does not carry a mutation. We demonstrate that Fgfr3b-null mice are normal and fertile, with no obvious phenotype. However, pronounced skeletal overgrowth was observed in Fgfr3c−/− mice, including overgrowth of axial and appendicular skeletons, kyphosis, and thin cortical and trebacular bones due to reduced mineralization. Comparison of the growth plates of mutant mice showed a pronounced increase in proliferating and hypertrophic chondrocytes in Fgfr3c-null mice, whereas the growth plates of Fgfr3b-null mice were unchanged and similar to the growth plates of WT littermate mice. These experiments establish the central role of the Fgfr3c isoform in the control of normal balance between proliferation and differentiation of chondrocytes during skeletal development.
Results and Discussion
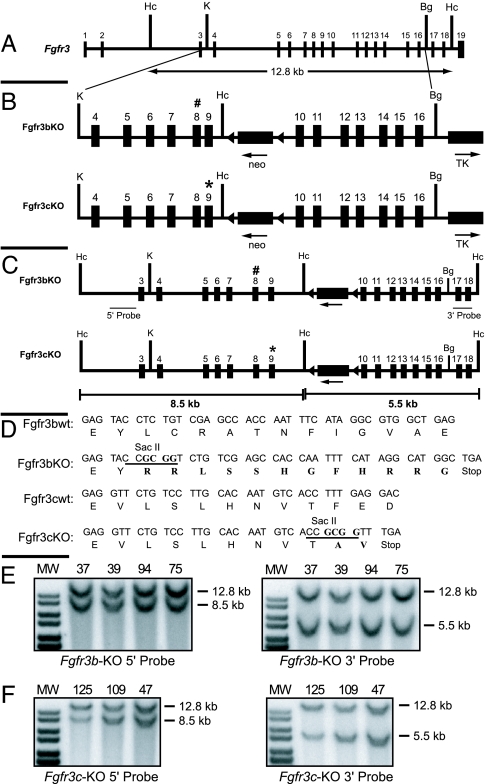
For selective inactivation of Fgfr3b and Fgfr3c isoforms in mice, stop codons were introduced selectively in exon 8 and exon 9 by four-base insertional frame shift mutations (Fig 1). The insertions created unique SacII restriction sites and a stop codon within exon 8 for the b-variant and within exon 9 for the c-variant. Moreover, the mutations were engineered to enable normal expression and function of the c isoform when a stop codon is inserted in exon 8 (b isoform) of the same gene and vice versa (Fig. 2A). A new HincII site was additionally introduced in intron 9 to facilitate molecular analysis of the recombination events (Fig. 1B).
Fig. 1.
Strategy used to knock out Fgfr3b and Fgfr3c isoforms via gene targeting. (A) Genomic locus of the murine Fgfr3 gene. (B) Targeting vectors showing 5′ and 3′ homology arms, positions of neo and tk gene cassettes for selection, and the newly created restriction site HincII for molecular analysis. Stop codons in exons 8 and 9 are shown as # and ∗, respectively. (C) Recombinant alleles of targeted Fgfr3b and Fgfr3c isoforms. The predicted fragment size for recombinant alleles after HincII digestion and probing with 5′ or 3′ external probes is shown. (D) WT and mutant sequences of exon 8 (Fgfr3b) and exon 9 (Fgfr3c) are shown. The newly created diagnostic restriction site SacII is underlined. (E and F) Detection of homologous recombination in ES clones. Shown is Southern blot analyses of genomic DNA of targeted ES clones of Fgfr3b and Fgfr3c targeting vectors restricted with HincII and probed with 32P-labeled 5′ external probe (Left) and 3′ external probe (Right). Mutant alleles showed the expected band shift from 12.8 kb to 8.5 kb with the 5′ probe and 5.5 kb with the 3′ probe.
Fig. 2.
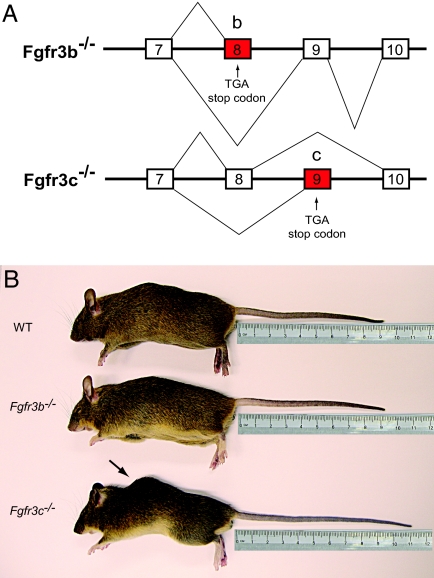
Morphological analysis of Fgfr3b−/− and Fgfr3c−/− mice. (A) Schematic representation of Fgfr3 isoforms produced in the knockout mice. Fgfr3b−/− mice produce truncated non-ligand binding soluble Fgfr3b isoforms and functional Fgfr3c isoforms, and the Fgfr3c−/− mice produce functional Fgfr3b isoforms and nonfunctional, truncated Fgfr3c isoforms. (B) Five-month-old male WT (Top), age- and sex-matched Fgfr3b−/− (Middle), and Fgfr3c−/− (Bottom) mice. Note the longer tail and kyphosis (arrow) in the Fgfr3c−/− mice.
The targeting vectors were electroporated into W9.5 ES cells for homologous recombination, and ES clones were screened by Southern blot analysis using 5′ and 3′ probes external to the genomic fragment used for homologous recombination (Fig. 1C). Because of the newly introduced HincII site at intron 9, mutant alleles gave 8.5-kb and 5.5-kb fragments after HincII digestion when analyzed with the 5′ and 3′ external probes, respectively, whereas WT alleles gave 12.8-kb fragments (Fig. 1 E and F). The neo gene of the targeting vector causes the additional 1.2-kb band seen in the 3′ recombinant fragment. Two hundred fifty clones were analyzed, of which four clones for Fgfr3b targeting vector and three clones for Fgfr3c targeting vector were found to have correct homologous recombination. Two independent clones each for Fgfr3b (nos. 39 and 75) and Fgfr3c (nos. 47 and 125) targeting vectors were selected for blastocyst injection to produce chimeras. Before blastocyst injection, these clones were karyotyped and found to have the correct number of chromosomes. All of the clones produced germ-line-transmitting chimeras and were mated with β-actin Cre transgenic mice (23) to remove the loxP flanked neo cassette from the intron 9. Genotyping the F1 offspring has shown that 50% of the offspring had the mutant allele. The heterozygous animals were normal, fertile, and indistinguishable from WT littermates.
A similar approach has been successfully applied to generate mice deficient in the b and c isoforms of Fgfr1 (15) and Fgfr2 (19). It is expected that the translational stop codon in exon 8 or exon 9 will terminate protein translation, resulting in the production of a soluble truncated form of FGFR3 with incomplete and misfolded D3. Because D3 has been shown to play an important role in FGF recognition and binding, a truncated FGFR3 with nonfunctional D3 will not bind FGF. It is therefore unlikely that a nonfunctional truncated FGFR3 will exert a dominant-interfering influence by sequestering FGF molecules. This approach was validated by demonstrating that different isoform-specific Fgfr knockout mice that were previously described using a similar strategy, including heterozygous Fgfr1b+/−, Fgfr1c+/−, Fgfr2b+/−, and Fgfr2c+/− mice (15, 19) and the Fgfr3b+/− and Fgfr3c+/− mice that are described in this report, are normal. The absence of any dominant phenotype in the heterozygous mutants also indicates that the introduced mutation in the specific exon did not lead to splicing switch or ectopic expression of the other isoform coded by the same gene.
Mice homozygous for Fgfr3b deficiency (Fgfr3b−/−) are normal, fertile, and indistinguishable from WT littermates (Fig. 2B). On the other hand, all Fgfr3c−/− mice had longer tails and mild kyphosis (hunchback) due to abnormal rearward curvature of the spine, resulting in protuberance of the upper back (Fig. 2B). We have also noticed that the tails of WT mice stopped growing after 3 months, while the tails of Fgfr3c−/− mice continued to grow even after 5 months (Fig. 2B). In addition, 57% of the tails of Fgfr3c−/− mice had kinks or bends (wavy tail). The mean body weights of Fgfr3c−/− mice were less than the WT littermates (7–11%). However, these differences were not statistically significant. Both the Fgfr3b−/− and Fgfr3c−/− mice were maintained in CD1 outbred strain background, and no postnatal mortality was detected. It was reported that ≈50% of Fgfr3−/− (deficient in both isoforms) maintained in the C57BL/6 inbred strain died within 1 month after birth, and nearly no mice survived beyond 6 months of age. By contrast, 90% of the Fgfr3−/− mice backcrossed to the C3H inbred strain background were alive past 6 months of age (24). Interestingly, the skeletal overgrowth, kyphosis, and other skeletal defects that were observed in the C57BL/6 background were also observed in the C3H inbred background (24) and in the CD1 outbred background described in this report. This implies that the genetic background affects the postnatal survival of Fgfr3-deficient mice and that the skeletal defects are independent of the genetic background.
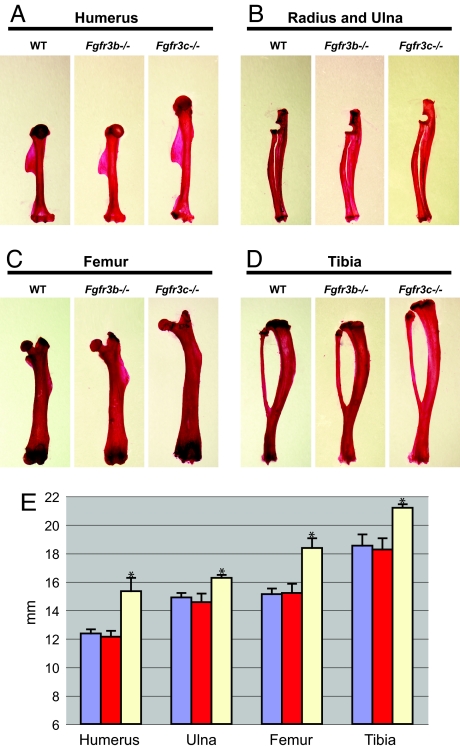
Inspection of the bones of mutant mice showed that the lengths of the axial and appendicular skeletons of Fgfr3c−/− mice were significantly longer from those of WT littermates. By contrast, the skeletons of Fgfr3b−/− mice were indistinguishable from the skeletons of WT littermates (Fig. 3). More detailed analyses have shown that the humerus of the forelimb of Fgfr3c−/− is ≈24% longer, while ulna of the forelimb of Fgfr3c−/− is 9% longer than the corresponding skeletons of WT littermates. Similarly, the lengths of femur and tibia of the hind limb of Fgfr3c−/− mice are 21% and 14% longer, respectively, than those of WT littermates (Fig. 3E). This analysis shows that the upper part of the limb is most affected by deficiency in Fgfr3c. A similar phenotype was observed in Fgfr3−/− that are deficient in both isoforms (22).
Fig. 3.
Morphometric analysis of the Fgfr3b−/− and Fgfr3c−/− mouse skeletal phenotype. (A–D) Shown are the Alizarin red-stained humerus (A), radius and ulna (B), femur (C), and tibia (D) of 5-month-old WT, Fgfr3b−/−, and Fgfr3c−/− mice. Note the elongation of the bones in the Fgfr3c−/− mice. (E) Histogram of the lengths of the appendicular bones. Values are expressed in millimeters. Sample sizes: WT, n = 10; Fgfr3b−/−, n = 5; Fgfr3c−/−, n = 5. Note the significant difference between WT and Fgfr3c−/− bones. ∗, P < 0.00001 by paired t test.
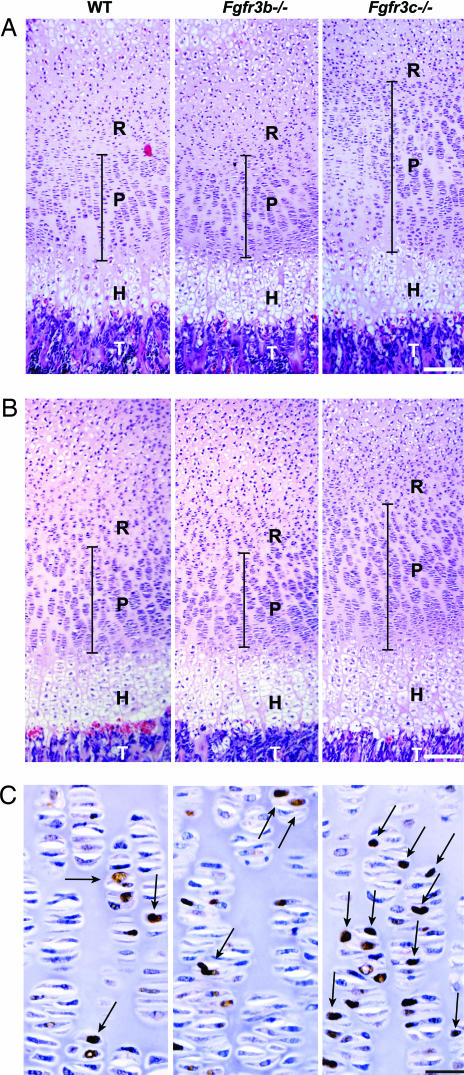
To investigate the cellular basis for the observed overgrowth of the bones in Fgfr3c−/− mice, we analyzed the growth plates of decalcified and undecalcified femur and tibia of 1- and 3-week-old mice. Fig. 4 shows paraffin sections of decalcified proximal femoral and tibial growth plates of 1-week-old mice. The various zones of the growth plate can be readily distinguished in these sections. For example, the resting chondrocyte zone (R) is characterized by round and small chondrocytes, the proliferating chondrocyte zone (P) is characterized by thin spindle shaped chondrocytes, the hypertrophic zone (H) is characterized by the differentiating chondrocytes located in large lacunae, and this is followed by the invading trabecular bone (T) area. The hypertrophic chondrocytes zone and the resting chondrocytes zone at this stage of development of Fgfr3c−/− and WT littermates were very similar. However, a profound increase was observed in the proliferating chondrocytes zone of femoral and tibial growth plates of Fgfr3c−/− mice as compared with the proliferating chondrocytes zone of WT littermates. The proliferating chondrocytes zones of Fgfr3b−/− and WT littermates, on the other hand, were indistinguishable (Fig. 4). We further analyzed the number of cells expressing proliferating cell nuclear antigens (PCNAs) in the proliferating zone using immunostaining with anti-PCNA antibodies. While no significant difference could be detected between WT and Fgfr3b−/− mice, a significant increase in the number of PCNA-positive cells was detected in Fgfr3c−/− mice (Fig. 4C). The number of proliferating cells was compared by pulse labeling of Fgfr3c−/− and control littermates with BrdU, a thymidine analog, that is specifically incorporated in the DNA of replicating cells. We then probed the growth plate samples with anti-BrdU antibodies. These analyses show that the growth plates of Fgfr3c−/− mice contained a significantly higher number of BrdU-positive, proliferating cells in their growth plates as compared with those of control littermates [supporting information (SI) Fig. 7].
Fig. 4.
Histochemical analysis of growth plates of 1-week-old femur and tibia. (A and B) Paraffin sections of decalcified proximal femur (A) and proximal tibia (B) of WT, Fgfr3b−/−, and Fgfr3c−/− mice. Sections were stained with H&E. The proliferative zone (P) of the growth plate is marked with a black bar. The hypertrophic zone (H) and trabecular bone (T) are indicated. Note the increased height of the proliferative zone in the femur and tibia of the Fgfr3c−/− mouse relative to the WT and Fgfr3b−/− mice. (C) Proliferating zone of femoral growth plate showing the PCNA-positive chondrocytes (arrows). (Scale bars: 200 μm in A and B and 33 μm in C.)
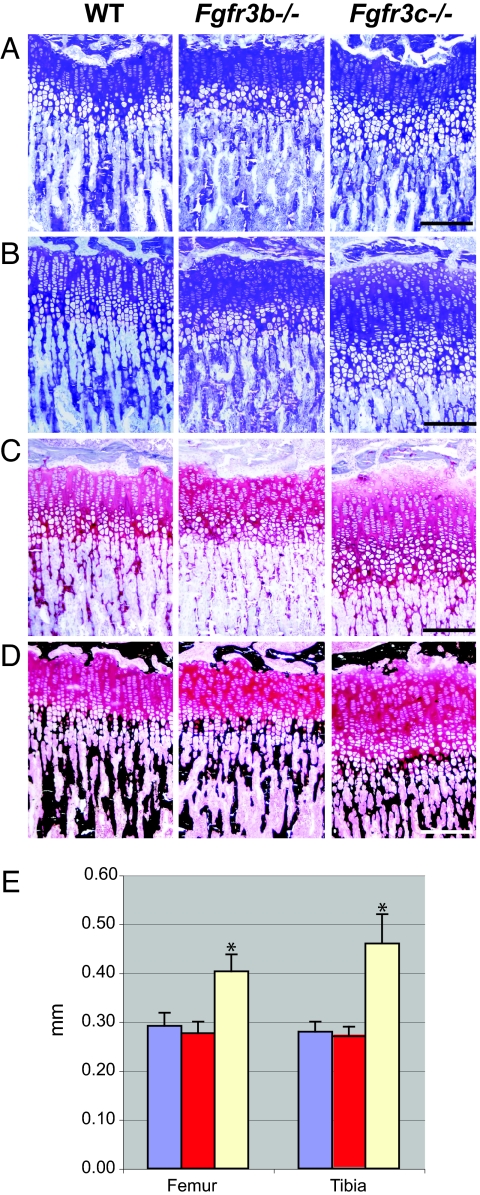
We next compared toluidine blue-stained sections of undecalcified bones of 3-week-old mutant and WT mice. The micrographs presented in Fig. 5 A and B show a dramatic difference in the heights of Fgfr3c−/− growth plates as compared with WT littermates. A proportionate increase in both the proliferating and hypertrophic zones was detected in the 3-week-old mice. To distinguish between cartilage and bone, samples were stained with Safranin O (Fig. 5C) and von Kossa (Fig. 5D). Safranin O is a cationic dye that stains proteoglycans of the cartilage matrix, and von Kossa staining is based on applying a silver nitrate and sodium thiosulfate to specifically stain calcium deposits of the bone matrix. While the Safranin O distinguishes chondrocytic region of the growth plate, the mineralized trabecular bones invading the hypertrophic zone are revealed by von Kossa stain. Using the differentially stained sections, the height of the proximal growth plates of tibia and femur of WT, Fgfr3b−/−, and Fgfr3c−/− mice was measured. No significant difference is detected in the growth plates of WT and Fgfr3b−/− mice. However, the heights of the growth plates of Fgfr3c−/− mice were increased by 38–64% as compared with the heights of the growth plates of WT littermates (Fig. 5E). Similar differences in the growth plates were observed in 3-week-old mice deficient in both isoforms of Fgfr3−/− (22), indicating that the c isoform is responsible for overgrowth of the skeletons in these mice.
Fig. 5.
Histochemical analysis of growth plates of 3-week-old femur and tibia. (A–D) Plastic section of undecalcified proximal femur (A) and proximal tibia (B–D). Sections were stained with toluidine blue (A and B), Safranin O (C), and Van Kossa (D). (E) Histogram of the length of the proximal femoral and tibial growth plates. Heights were measured at three different points along the width of the growth plate for each sample. Sample sizes: WT, n = 5; Fgfr3b−/−, n = 4; Fgfr3c−/−, n = 4. Note the significant difference in the height of the Fgfr3c−/− growth plates relative to the WT and Fgfr3b−/− growth plates. ∗, P < 0.00001 by paired t test. (Scale bars: 200 μm.)
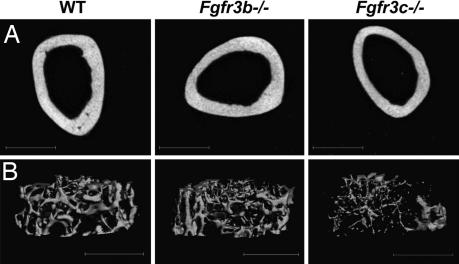
We next compared the micro architecture of Fgfr3b−/− and Fgfr3c−/− mice by employing x-ray microcomputed tomography (microCT) and PIXImus dual-energy x-ray absorptiometer. Analyses of the cortical bone thickness of femora of 5-month-old mice by microCT (Fig. 6A) revealed a significant decrease in the thickness of the bones of Fgfr3c−/− mice to 221 ± 24 μm from 258 ± 12 μm in WT littermates. A significant decrease was also detected in the thickness of trabecular bones of Fgfr3c−/− mice (49 ± 2 μm) as compared with the WT littermates (59 ± 6 μm). Consequently, the trabecular spacing in Fgfr3c−/− mice was increased to 328 ± 26 μm from 225 ± 26 μm in WT littermates (Fig. 6B). However, consistent with the morphometric and histochemical analyses, the thickness of cortical (252 ± 14 μm) and trabecular (56 ± 3 μm) bones in Fgfr3b−/− mice was similar to that of WT littermates. To examine the possibility of whether the thinning of cortical and trabecular bone also exists in young mice, we analyzed femoral bones of 3-week-old Fgfr3c−/− and WT littermates. While there is no significant difference in the thickness of trabecular bones of 3-week-old Fgfr3c−/− and WT (36 ± 3 μm and 35 ± 2 μm, respectively) mice, the cortical bones of Fgfr3c−/− mice are significantly thinner (SI Table 1). The presence of thin cortical bones in the young mice may account for the slight bending of the weight-bearing bones such as the femur observed in the Fgfr3−/− and Fgfr3c−/− adult mice.
Fig. 6.
MicroCT analyses of the trabecular and cortical bones of the femurs of 5-month-old mice. (A) Three-dimensional reconstruction of the femoral cortical bones. Cortical measurements are an average of 50 slices (600 μm), taken 50% of diaphysis length, from proximal growth plate (GP) to distal GP. Note the thin cortical bone of Fgfr3c−/− mice relative to WT controls. (B) Representative three-dimensional images of trabecular bone just below the growth plate of WT (Left), Fgfr3b−/− (Center), and Fgfr3c−/− (Right) mice. Note the thinning of the trabecular bone and the increase in the trabecular space of Fgfr3c−/− mice relative to WT controls.
Analyses of bone mineral density of 5-month-old femora revealed no significant difference between Fgfr3b−/− mice (0.072 ± 0.005 g/cm2) and WT littermates (0.073 ± 0.001 g/cm2). In contrast, a much lower bone mineral density was observed in Fgfr3c−/− mice (0.063 ± 0.001 g/cm2). Similarly, a significantly lower bone mineral density was detected in 6-week-old and 8-month-old Fgfr3c−/− mice (SI Table 2), suggesting that the bone compartment does not become normal when growth stops in older mice. There is good evidence that the processes of chondrogenesis and osteogenesis are linked to each other, and, therefore, impairment in one process may affect the function of the second process. It is well established that Fgfr2c is predominantly expressed in osteoblasts (19), whereas Fgfr3c is primarily expressed in chondrocytes (25, 26). Yet it is possible to detect in Fgfr2c−/− mice, in addition to the primary impairment in osteoblast function, a defect in chondrogenesis that causes shorter growth plate and dwarfism (19). Similarly, the skeletal overgrowth caused by impairment in chondrocyte function in Fgfr3c−/− mice is accompanied by a defect in osteogenesis, which results in thin cortical and trabecular bones and low bone mineral density.
Conclusions
The targeted disruption of the Fgfr3c isoform causes the overgrowth of endochondral bones and phenocopies the Fgfr3-deficient mice. Deficiency in the Fgfr3c isoform causes a dramatic increase in growth plates especially in the proliferating chondrocytes of 1-week-old mice and proliferating and hypertrophic chondrocytes in 3-week-old mice. However, the accelerated growth in the cartilage was not accompanied by accelerated bone mineralization. As a result, Fgfr3c−/− mice exhibit thin cortical and trabecular bones and decreased bone mineral density. Contrary to this, Fgfr3b−/− mice do not show any obvious defect in the development of the skeleton or other organs. These experiments show that the Fgfr3b isoform that is expressed in the epithelial tissues (26) does not cooperate with the Fgfr3c isoform in endochondral bone development. The Fgfr3c isoform is, therefore, the main transducer of the balance between cell proliferation and differentiation during normal chondrocyte development.
Materials and Methods
Gene Targeting and Generation of Chimeric Mice.
To generate targeting vectors specific for Fgfr3b and Fgfr3c isoforms, a mouse genomic DNA fragment derived from 129/SV fix library (Stratagene, La Jolla, CA) was used (27). Translational stop codons were introduced in the coding sequence by site-directed mutagenesis. The genomic clones with mutations were cloned into the targeting vector Osdupdel 1. A floxed neomycin cassette was introduced in intron 9 at the HindIII restriction site in reverse orientation. The thymidine kinase gene was inserted 3′ to the homology arm to facilitate negative selection. The targeting vectors were linearized with NotI and were electoroporated, and the ES colonies were selected with G418 and Gancyclovir. The double resistant colonies were screened by Southern blotting. Positive clones were microinjected into C57BL/6 blastocysts to generate germ-line-transmitting chimeras.
Alizarin Red Staining of the Skeleton.
Axial and appendicular skeleton were harvested, fixed in 100% ethanol, and followed by acetone. The skeletons were treated with 2% KOH for 12 h and transferred to a staining solution that contained 75 μg/ml Alizarin red S (Sigma–Aldrich, St. Louis, MO) in 1% KOH. After staining for 24 h, the skeletons were destained with 20% glycerol in 1% KOH at room temperature until excess stains were removed (for ≈3–7 days), at which point they were passed through 20%, 50%, and 80% glycerol in ethanol and finally 100% glycerol for storage.
Histochemical Analyses of Growth Plate and Immunostaining.
Femora and tibia were fixed in 10% neutral buffered formalin for 4 h, dehydrated in acetone, and embedded in methylmethacrylate, and 4-μm sections were obtained. After deplastification, bones were stained with toluidine blue (pH 3.7). To stain the cartilage, adjacent sections were stained with Safranin O. To analyze mineralized matrix, sections were stained by von Kossa followed by methyl green counterstaining. For immunostaining of PCNA, mouse monoclonal anti-PCNA antibodies (clone PC10 from BioLegend) and the Dako autostainer universal staining system were used. For BrdU pulse labeling, 1-week-old mice were injected s.c. with 50 mg of BrdU per kilogram of body weight (Calbiochem, San Diego, CA) and were killed and processed 3 h later. The paraffin sections of the tibia were probed with anti-BrdU antibodies (Calbiochem) as per the manufacturer's instructions.
MicroCT Analyses.
Three-dimensional images of femora were acquired by using x-ray microCT (μCT40; Scanco Medical, Bassersdorf, Switzerland). Images were reconstructed at 12-μm resolution by using standard convolution back-projection algorithms with Shepp and Logan filtering and rendered at a discrete voxel density of 578,704 voxels/mm3 (isometric 12-μm voxels).
Bone Mineral Density Analysis.
Bone mineral density measurements of isolated femora were performed by dual energy x-ray absorptiometry using a PIXImus densitometer (Lunar, Madison, WI). Scans were performed with a 1.270-mm-diameter collimator, 0.762-mm line spacing, 0.380-mm point resolution, and an acquisition time of 5 min.
Supplementary Material
Acknowledgments
We thank Dr. David Givol (Weizmann Institute of Science, Rehovot, Israel) for providing the mouse Fgfr3 genomic clones; Francisco Tomé for maintaining the mouse colony; and National Institutes of Health-supported microCT facility of University of Connecticut, Framington, CT, for providing services. This work was supported by National Institutes of Health Grants AR 051448, AR 051886, and P50 AR054086 (to J.S.) and a Pilot and Feasibility Award from the Yale Core Center for Musculoskeletal Disorders supported by National Institutes of Health/National Institute of Arthritis and Musculoskeletal and Skin Diseases Grant AR46032 (to V.P.E.).
Abbreviations
- FGFR
FGF receptor
- microCT
microcomputed tomography
- PCNA
proliferating cell nuclear antigen.
Footnotes
The authors declare no conflict of interest.
This article contains supporting information online at www.pnas.org/cgi/content/full/0700012104/DC1.
References
- 1.Eswarakumar VP, Lax I, Schlessinger J. Cytokine Growth Factor Rev. 2005;16:139–149. doi: 10.1016/j.cytogfr.2005.01.001. [DOI] [PubMed] [Google Scholar]
- 2.Grose R, Werner S. Mol Biotechnol. 2004;28:147–166. doi: 10.1385/MB:28:2:147. [DOI] [PubMed] [Google Scholar]
- 3.Presta M, Dell'Era P, Mitola S, Moroni E, Ronca R, Rusnati M. Cytokine Growth Factor Rev. 2005;16:159–178. doi: 10.1016/j.cytogfr.2005.01.004. [DOI] [PubMed] [Google Scholar]
- 4.Hart AW, Baeza N, Apelqvist A, Edlund H. Nature. 2000;408:864–868. doi: 10.1038/35048589. [DOI] [PubMed] [Google Scholar]
- 5.Tomlinson E, Fu L, John L, Hultgren B, Huang XJ, Renz M, Stephan JP, Tsai SP, Powell-Braxton L, French D, Stewart TA. Endocrinology. 2002;143:1741–1747. doi: 10.1210/endo.143.5.8850. [DOI] [PubMed] [Google Scholar]
- 6.Kharitonenkov A, Shiyanova TL, Koester A, Ford AM, Micanovic R, Galbreath EJ, Sandusky GE, Hammond LJ, Moyers JS, Owens RA, et al. J Clin Invest. 2005;115:1627–1635. doi: 10.1172/JCI23606. [DOI] [PMC free article] [PubMed] [Google Scholar]
- 7.Yu X, Ibrahimi OA, Goetz R, Zhang F, Davis SI, Garringer HJ, Linhardt RJ, Ornitz DM, Mohammadi M, White KE. Endocrinology. 2005;146:4647–4656. doi: 10.1210/en.2005-0670. [DOI] [PMC free article] [PubMed] [Google Scholar]
- 8.Schlessinger J, Plotnikov AN, Ibrahimi OA, Eliseenkova AV, Yeh BK, Yayon A, Linhardt RJ, Mohammadi M. Mol Cell. 2000;6:743–750. doi: 10.1016/s1097-2765(00)00073-3. [DOI] [PubMed] [Google Scholar]
- 9.Yayon A, Zimmer Y, Shen GH, Avivi A, Yarden Y, Givol D. EMBO J. 1992;11:1885–1890. doi: 10.1002/j.1460-2075.1992.tb05240.x. [DOI] [PMC free article] [PubMed] [Google Scholar]
- 10.Miki T, Bottaro DP, Fleming TP, Smith CL, Burgess WH, Chan AM, Aaronson SA. Proc Natl Acad Sci USA. 1992;89:246–250. doi: 10.1073/pnas.89.1.246. [DOI] [PMC free article] [PubMed] [Google Scholar]
- 11.Orr-Urtreger A, Bedford MT, Burakova T, Arman E, Zimmer Y, Yayon A, Givol D, Lonai P. Dev Biol. 1993;158:475–486. doi: 10.1006/dbio.1993.1205. [DOI] [PubMed] [Google Scholar]
- 12.Mohammadi M, Olsen SK, Ibrahimi OA. Cytokine Growth Factor Rev. 2005;16:107–137. doi: 10.1016/j.cytogfr.2005.01.008. [DOI] [PubMed] [Google Scholar]
- 13.Ornitz DM, Xu J, Colvin JS, McEwen DG, MacArthur CA, Coulier F, Gao G, Goldfarb M. J Biol Chem. 1996;271:15292–15297. doi: 10.1074/jbc.271.25.15292. [DOI] [PubMed] [Google Scholar]
- 14.Zhang X, Ibrahimi OA, Olsen SK, Umemori H, Mohammadi M, Ornitz DM. J Biol Chem. 2006;281:15694–15700. doi: 10.1074/jbc.M601252200. [DOI] [PMC free article] [PubMed] [Google Scholar]
- 15.Partanen J, Schwartz L, Rossant J. Genes Dev. 1998;12:2332–2344. doi: 10.1101/gad.12.15.2332. [DOI] [PMC free article] [PubMed] [Google Scholar]
- 16.Deng CX, Wynshaw-Boris A, Shen MM, Daugherty C, Ornitz DM, Leder P. Genes Dev. 1994;8:3045–3057. doi: 10.1101/gad.8.24.3045. [DOI] [PubMed] [Google Scholar]
- 17.Yamaguchi TP, Harpal K, Henkemeyer M, Rossant J. Genes Dev. 1994;8:3032–3044. doi: 10.1101/gad.8.24.3032. [DOI] [PubMed] [Google Scholar]
- 18.De Moerlooze L, Spencer-Dene B, Revest JM, Hajihosseini M, Rosewell I, Dickson C. Development (Cambridge, UK) 2000;127:483–492. doi: 10.1242/dev.127.3.483. [DOI] [PubMed] [Google Scholar]
- 19.Eswarakumar VP, Monsonego-Ornan E, Pines M, Antonopoulou I, Morriss-Kay GM, Lonai P. Development (Cambridge, UK) 2002;129:3783–3793. doi: 10.1242/dev.129.16.3783. [DOI] [PubMed] [Google Scholar]
- 20.Xu XL, Weinstein M, Li CL, Naski M, Cohen RI, Ornitz DM, Leder P, Deng CX. Development (Cambridge, UK) 1998;125:753–765. doi: 10.1242/dev.125.4.753. [DOI] [PubMed] [Google Scholar]
- 21.Deng CX, Wynshawboris A, Zhou F, Kuo A, Leder P. Cell. 1996;84:911–921. doi: 10.1016/s0092-8674(00)81069-7. [DOI] [PubMed] [Google Scholar]
- 22.Colvin JS, Bohne BA, Harding GW, McEwen DG, Ornitz DM. Nat Genet. 1996;12:390–397. doi: 10.1038/ng0496-390. [DOI] [PubMed] [Google Scholar]
- 23.Lewandoski M, Meyers EN, Martin GR. Cold Spring Harbor Symp Quant Biol. 1997;62:159–168. [PubMed] [Google Scholar]
- 24.Valverde-Franco G, Liu H, Davidson D, Chai S, Valderrama-Carvajal H, Goltzman D, Ornitz DM, Henderson JE. Hum Mol Genet. 2004;13:271–284. doi: 10.1093/hmg/ddh034. [DOI] [PubMed] [Google Scholar]
- 25.Hamada T, Suda N, Kuroda T. J Bone Miner Metab. 1999;17:274–282. doi: 10.1007/s007740050095. [DOI] [PubMed] [Google Scholar]
- 26.Wuechner C, Nordqvist AC, Winterpacht A, Zabel B, Schalling M. Int J Dev Biol. 1996;40:1185–1188. [PubMed] [Google Scholar]
- 27.Wang Y, Spatz MK, Kannan K, Hayk H, Avivi A, Gorivodsky M, Pines M, Yayon A, Lonai P, Givol D. Proc Natl Acad Sci USA. 1999;96:4455–4460. doi: 10.1073/pnas.96.8.4455. [DOI] [PMC free article] [PubMed] [Google Scholar]
Associated Data
This section collects any data citations, data availability statements, or supplementary materials included in this article.


