

Abstract
Introduction
Longitudinal studies on the age-related bone loss in men concerns the decrease in areal bone mineral density (aBMD), which can be qualified as “apparent bone loss” because it does not reflect the change in bone mineral content (BMC). Loss of BMC can be referred to as “net bone loss” because it does not take into account the morphological basis of the bone loss (decreased periosteal apposition; endosteal bone loss, i.e. bone loss on the trabecular, endocortical and intracortical surfaces). The aim of this study was to assess age-related apparent net and endosteal bone loss as well as their morphological basis and age-related changes during a prospective follow-up in a large cohort of elderly men.
Methods
This analysis was performed in 725 men aged 51–85 at baseline who were followed up for 90 months.
Results
Bone densitometry was carried out at the lumbar spine, hip and whole body by using the HOLOGIC QDR1500 device and at the distal forearm by using the Osteometer DTX100 device. Sixty-five men who abandoned the study after the first examination were older and had lower aBMC at most sites of measurement. Apparent bone loss was significant at the hip, distal forearm and whole body. Net bone loss was also significant at these sites, except for the femoral neck. Periosteal expansion was significant at all sites of measurement. Apparent and net bone loss accelerated with age, whereas the rate of periosteal expansion remained stable. At the distal radius and ulna, endosteal bone loss accelerated with age, whereas the rate of periosteal apposition remained stable.
Conclusion
In a large cohort of elderly men, age-related apparent bone loss (aBMD) at the hip, distal forearm and whole body was determined by the net bone loss (BMC), except for the femoral neck. Apparent and net bone loss accelerated with age, whereas the periosteal expansion rate (bone widening) remained constant. At the distal forearm, age-related acceleration of the apparent bone loss was determined by the higher endosteal bone loss, whereas the periosteal apposition rate (estimated mass of deposited bone) remained constant.
Keywords: Bone loss, Men, Osteoporosis, Periosteal apposition
Introduction
Osteoporosis in elderly men is a major problem of public health. Fracture incidence increases exponentially with age, thus, total number of fragility fractures in men increases rapidly, mainly due to the increasing life expectancy [1]. Currently, 25–30% of fragility fractures occur in men [1, 2]. Moreover, postfracture morbidity and mortality are higher in men than in women [3, 4].
Bone loss is defined usually as the rate of decrease in areal bone mineral density (aBMD) measured by dual X-ray absorptiometry (DXA) [5–7]. However, aBMD of a given region of interest (ROI) is determined by its bone mineral content (BMC) and by its projected area. For tubular bones, ROI length is kept constant, and the projected area depends on bone width. Bone width increases with ageing due to the periosteal apposition [8, 9]. Thus, if the amount of bone deposited on the periosteal surface and that resorbed on the endosteal surfaces (i.e. trabecular, endocortical and intracortical) are equal, BMC remains constant, but aBMD decreases because bone width and its projected area have increased. Therefore, it is more appropriate to refer the decrease in aBMD assessed longitudinally as “apparent bone loss”.
Changes in BMC of a given ROI are determined not only by the quantity of bone resorbed on the endosteal surfaces but also by the quantity of bone deposited on the periosteal surface. Thus, change in BMC does not reflect the quantity of bone really lost on the endosteal surfaces and, therefore, the decrease in BMC is better qualified as “net bone loss”. Estimation of bone gain due to periosteal apposition would allow assessment of the quantity of bone really lost on the endosteal surfaces. This quantity of bone could be referred as to “endosteal bone loss”.
In elderly men, apparent bone loss accelerates with age [5–7]. However, the morphological basis underlying this acceleration has not been studied, and it is unclear whether it is related to faster outward displacement of a constant amount of bone, to higher endosteal bone loss and/or to a lower periosteal apposition. Moreover, only a few studies have compared the rate of apparent bone loss at different sites of measurement in elderly men [10–12], although it appears that the morphological basis underlying apprent bone loss may vary according to ROI [13].
Therefore, the aim of this study was to assess age-related apparent net and endosteal bone loss as well as their morphological basis and the age-related changes during a long-term prospective follow-up in a large cohort of elderly men (the MINOS study).
Subjects and methods
Cohort
The MINOS study is a prospective study of osteoporosis and its determinants in men, which was initiated in 1995 [14]. It is the result of a collaboration between the National Institute of Health and Medical Research (INSERM) and Société de Secours Minière de Bourgogne (SSBM) in Montceau les Mines, a town located 130 km northwest of Lyon in the Department (District) of Saône et Loire. The town has a population of 21,000 inhabitants, including 7,150 men > 19 years if age. SSMB is one of the largest health insurance companies in this town. The study was performed in accord with the Helsinki Declaration of 1975 as revised in 1983. The MINOS cohort consists of 1,040 men aged 19–85 recruited between 1995 and 1998. All men responded to an epidemiological questionnaire covering demographic and behavioural information as well as detailed medical history. Men aged 19–50 were examined once, whereas 790 men aged 50–85 were followed up prospectively for 90 months. Every 18 months, they were invited to attend the follow-up examination composed of an epidemiological questionnaire and DXA measurement. Radiograph of the spine were performed at baseline, 36 and 90 months.
Measurements
aBMD and BMC were measured at the lumbar spine (L2–L4), hip and whole body using pencil-beam DXA (QDR 1500, Hologic Inc., Waltham, MA, USA) and at the distal nondominant forearm using single energy X-ray absorptiometry (Osteometer, DTX-100, Denmark). The OsteoDyne Hip Positioner System (HPS) was used to minimise hip positioning error. ROI of the femoral neck was positioned perpendicularly to the axis of the femoral neck to cover its narrowest part. When necessary, the femoral neck edges were adjusted manually. The QDR 1500 device was calibrated daily using a lumbar spine phantom, yielding a CV for aBMD of 0.33 %. Twice a month, the Hologic hip phantom was measured, yielding a long-term CV of 0.94 % for femoral neck aBMD and 1.05 % for the femoral neck projected area. Also twice a month, a human lumbar spine embedded in methyl methacrylate was measured. Its long-term CV was 1.07 % for BMC of L2–L4, 1.07 % for the projected area of L2–L4, and 0.62 % for aBMD of L2–L4. At the distal forearm, the distal site includes 20 mm of radius situated proximally to the site where the spacing between the medial edge of the radius and the lateral edge of the ulna is 8 mm. Scans with evident error of positioning were excluded. The densitometer was calibrated daily using a calibration standard for DTX 100; its long-term CV was 0.47 % for aBMD and 0.15 % for the projected area.
Dimensions of the vertebral body of the third lumbar vertebra (L3) were measured on the anteroposterior and lateral radiographs of the lumbar spine performed at baseline and at 90 months. The cross-sectional area of L3 was calculated based on the anteroposterior and frontal diameters measured in the narrowest site of the vertebral body. Osteoarthritis of the lumbar spine was assessed, as described previously [14].
The external diameter of bone was calculated as the projected area of ROI divided by its length. The rate of age-related periosteal expansion was calculated as the average annual increase in the external diameter (femoral neck, distal radius and distal ulna), projected area (total hip) or cross-sectional area (L3). Age-related periosteal apposition (ΔBMCPA) was estimated as the mass of bone deposited on the outer surface of bone since the first measurement (Fig. 1). The volume of the ellipsoid cylinder was calculated assuming that the short axis was 0.75 of the long axis (external diameter). Then, the mass of the deposited bone was calculated as the product of the cylinder volume and the volumetric density of bone mineral (1.15 g/cm3) [15]. We assumed that during the follow-up, BMC was determined by baseline BMC, bone mass deposited on the outer surface (ΔBMCPA) and endosteal bone loss (ΔBMCEBL). Thus, ΔBMCEBL can be calculated using BMC at baseline and during the follow-up and the calculated value of ΔBMCPA. The concept of endosteal bone loss does not make any assumption as to its underlying morphological basis (cortical thinning, increased cortical porosity, trabecular bone loss) nor on the proportion of cortical to trabecular bone. It only reflects the loss of bone mineral “inside” bone, which is represented in Fig. 1 by the change of the colour from black to grey.
Fig. 1.

Calculation of bone mass deposited by periosteal apposition (ΔBMCPA) and of endosteal bone loss (ΔBMCEBL) between baseline (t0) and follow-up (t1). Long semi-axes of the ellipse at baseline (R0) and during the followup (R1) are equal to half the external diameter of the region of interest (ROI). Bone mass deposited by periosteal apposition (ΔBMCPA) is the product of the ellipsoid volume and the vBMD of cortical bone (d = 1.15 g/cm3). Coefficient 0.75 reflects bone flattening in the anteroposterior projection in comparison with its diameter in the frontal projection. Endosteal bone loss (ΔBMCEBL) is presented graphically as the brighter colour of the entire cross-sectional area of bone (black at baseline and light grey at follow-up) in order to indicate that the “endosteal bone loss” makes no distinction as to the morphological basis (cortical thninning, increase in cortical porosity, trabecular bone loss)
Statistical methods
All calculations were performed by using SAS version 8.2 software (SAS Institute Inc., Cary, NC, USA). Correlation between continuous variables was assessed by Pearson’s simple correlation coefficient. Individual slopes were calculated by using simple linear regression. Comparisons of the individual slopes between age groups were performed by analysis of variance (ANOVA) and adjusted for multiple comparisons by Dunnett-Hsu test. Participants attended two to six exams; those who had few measurements, e.g. two, had them over different periods of follow-up (18–90 months). Individual slopes were calculated by using two to six points distributed over 18–90 months, which could influence accuracy of the calculation. We adjusted for the duration of follow-up or the number of measurements to check whether duration of follow-up and number of measurements influenced the results. Each of them entered significant in the majority of models, although they influenced the results only to a limited degree. We present data adjusted for the duration of follow-up because this variable attained higher level of significance in the models and contributed more to the final model.
Results
Characteristics of the investigated cohort
Sixty-five men who abandoned the study after the first examination were, at baseline, older and had lower physical activity but higher prevalence of diabetes mellitus, rheumatoid arthritis and parkinsonism than the 725 men who participated in the follow-up (Table 1). They had lower aBMD and BMC at all sites of measurement except for the lumbar spine. The difference between the groups became weaker after the adjustment for age; however, it remained significant for certain sites.
Table 1.
Comparison of 725 men participating in the prospective study and 65 men lost to follow-up after recruitment
| Parameter | Follow-up (n = 725) | No follow-up (n = 65) | p value* | p value** |
|---|---|---|---|---|
| Age (years) | 65 ± 7 | 70 ± 8 | < 0.0001 | |
| Body weight (kg) | 80 ± 13 | 79 ± 15 | 0.29 | |
| Body height (cm) | 169 ± 6 | 168 ± 7 | 0.21 | |
| BMI (kg/m2) | 27.98 ± 3.64 | 27.75 ± 4.51 | 0.63 | |
| Fat mass (kg) | 22.02 ± 7.48 | 23.23 ± 9.11 | 0.28 | |
| Lean mass (kg) | 54.54 ± 6.66 | 52.16 ± 7.56 | < 0.01 | NS |
| Tobacco smoking (%) | 11.8 | 11.6 | 0.98 | |
| Physical activity (h/week) | 21.8 ± 12.7 | 17.2 ± 11.3 | < 0.005 | NS |
| Prevalent fractures (%) | 13.8 | 19.7 | 0.18 | |
| Diabetes (%) | 6.5 | 15.7 | < 0.005 | |
| Rhumatoid arthritis (%) | 1.4 | 5.7 | < 0.01 | |
| Parkinsonism (%) | 1.5 | 5.7 | < 0.02 | |
| Lumbar spine BMD (g/cm2) | 1.031 ± 0.184 | 1.052 ± 0.213 | 0.21 | |
| Femoral neck BMD (g/cm2) | 0.845 ± 0.121 | 0.803 ± 0.127 | < 0.01 | NS |
| Femoral neck BMC (g) | 5.111 ± 0.849 | 4.883 ± 0.934 | < 0.04 | NS |
| Femoral neck width (cm) | 4.082 ± 0.316 | 4.123 ± 0.356 | 0.31 | |
| Trochanter BMD (g/cm2) | 0.740 ± 0.109 | 0.691 ± 0.121 | < 0.001 | < 0.03 |
| Total hip BMD (g/cm2) | 0.966 ± 0.127 | 0.910 ± 0.157 | < 0.001 | NS |
| Whole-body BMC (g) | 2706.6 ± 410.4 | 2550.3 ± 472.7 | < 0.005 | NS |
| Whole-body BMD (g/cm2) | 1.210 ± 0.108 | 1.167 ± 0.121 | < 0.003 | < 0.05 |
| Distal forearm BMD | 0.524 ± 0.065 | 0.483 ± 0.070 | < 0.0001 | < 0.01 |
| Ultradistal radius BMD | 0.430 ± 0.064 | 0.399 ± 0.072 | < 0.001 | < 0.05 |
| Radius BMD (g/cm2) | 0.556 ± 0.068 | 0.513 ± 0.075 | < 0.0001 | < 0.01 |
| Radius BMC (g) | 2.743 ± 0.403 | 2.527 ± 0.422 | < 0.0001 | < 0.01 |
| Radius width (cm) | 2.471 ± 0.207 | 2.468 ± 0.216 | 0.94 | |
| Ulna BMD | 0.476 ± 0.066 | 0.438 ± 0.070 | < 0.0001 | < 0.01 |
| Ulna BMC (g) | 1.502 ± 0.244 | 1.401 ± 0.246 | < 0.0001 | < 0.01 |
| Ulna width (cm) | 1.659 ± 0.136 | 1.684 ± 0.152 | 0.16 |
BMD bone mineral density, BMC bone mineral content, NS not significant
p* difference between the groups
p** age-adjusted difference between the groups
Characteristics of bone loss
BMC and aBMD of the lumbar spine increased significantly (Table 2) faster in men with severe arthritis (5.95 ± 16.15 vs 1.74 ± 10.96 mg/cm2/year; p < 0.0001). At the femoral neck, aBMD decreased, whereas BMC increased. For other sites of measurement (hip, whole body, distal forearm), both aBMD and BMC decreased. The fractional apparent and net bone loss (percentage of initial value) were fastest at the distal forearm and slowest at the whole body. All the above absolute and fractional changes in aBMD and BMC were significantly different from 0 for all ROIs.
Table 2.
Average rate of apparent bone loss [change in areal bone mineral density (aBMD)], net bone loss [change in bone mineral content (BMC)] and of periosteal expansion (increase in bone width or area) as well as the simple correlation coefficients of these variables with age in 725 men aged 50–85 at baseline followed up prospectively for 90 months (the prospective MINOS study)
| Site of measurement | Yearly change | Correlation with age | ||
|---|---|---|---|---|
| Bone mineral density | (mg/cm2/year) | (%/year) | r | p |
| Lumbar spine | 4.205 ± 14.21 | 0.495 ± 2.910 | −0.069 | 0.07 |
| Femoral neck | −2.463 ± 8.305 | −0.282 ± 1.019 | −0.154 | < 0.0001 |
| Trochanter | −1.963 ± 8.031 | −0.276 ± 1.123 | −0.196 | < 0.0001 |
| Total hip | −4.714 ± 8.451 | −0.496 ± 0.930 | −0.213 | < 0.0001 |
| Whole body | −2.081 ± 8.712 | −0.177 ± 0.723 | −0.045 | 0.22 |
| Distal forearm | −2.937 ± 4.178 | −0.580 ± 0.870 | −0.202 | < 0.0001 |
| Distal radius | −2.986 ± 5.340 | −0.561 ± 1.041 | −0.180 | < 0.0001 |
| Distal ulna | −3.353 ± 5.131 | −0.730 ± 1.206 | −0.119 | < 0.002 |
| Ultradistal radius | −1.823 ± 5.334 | −0.426 ± 1.285 | −0.128 | < 0.001 |
| Bone mineral content | (mg/year) | (%/year) | −0.041 | 0.27 |
| L3 | 118.17 ± 552.90 | 0.658 ± 2.954 | ||
| Femoral neck | 12.67 ± 50.38 | 0.263 ± 1.010 | −0.051 | 0.18 |
| Total hip | −226.1 ± 0.687 | −0.504 ± 1.551 | −0.120 | < 0.002 |
| Whole body | −7565.9 ± 22500.9 | −0.294 ± 0.877 | −0.192 | < 0.0001 |
| Distal radius | −11.26 ± 25.90 | −0.426 ± 0.978 | −0.179 | < 0.0001 |
| Distal ulna | −8.64 ± 16.82 | −0.559 ± 1.164 | −0.123 | < 0.001 |
| Bone size | ||||
| L3 cross-section (mm2/year) | 35.64 ± 225.40 | 0.167 ± 1.184 | −0.056 | 0.10 |
| Femoral neck (μm/year) | 133.1 ± 217.2 | 0.321 ± 0.503 | 0.070 | 0.06 |
| Total hip (mm2/year) | 4.82 ± 42.23 | 0.112 ± 0.915 | 0.007 | 0.85 |
| Distal radius (μm/year) | 60.48 ± 362.66 | 0.257 ± 1.497 | 0.034 | 0.36 |
| Distal ulna (μm/year) | 58.27 ± 156.61 | 0.355 ± 0.937 | 0.013 | 0.73 |
External diameter of the femoral neck, distal radius and distal ulna as well as the cross-sectional area of L3 and the projected area of total hip increased significantly during the follow-up. Fractional increase in bone size varied from 0.17% to 0.36% per year across the sites.
Characteristics of the rate of bone loss according to age at baseline
At the hip and distal forearm, rate of apparent bone loss (change in aBMD) was negatively correlated with age, indicating and age-related acceleration of apparent bone loss (Table 2). After the age of 70, the apparent bone loss was two (for distal forearm) to 23 (for trochanter) times faster than in men aged younger than 60 at baseline (Fig. 2). A similar trend was found when apparent bone loss was expressed as the percentage of the baseline value of aBMD.
Fig. 2.

Comparison of the absolute values of apparent bone loss [change in areal bone mineral density (aBMD)] according to age group (black bars 50–60 years, pointed bars 61–70 years, white bars > 70 years at baseline). The slopes are significantly different from 0 (p < 0.005–0.0001) for all regions of interest (ROIs) and for all age groups, except for the trochanter in the youngest group
Net bone loss (change in BMC) also accelerated with age at the total hip, whole body and bones of distal forearm. In men aged older than 70, net bone loss was two to four times as fast in comparison with men aged younger than 60 at baseline, both for the absolute values of net bone loss and for data expressed as percentage of baseline BMC (Fig. 3).
Fig. 3.
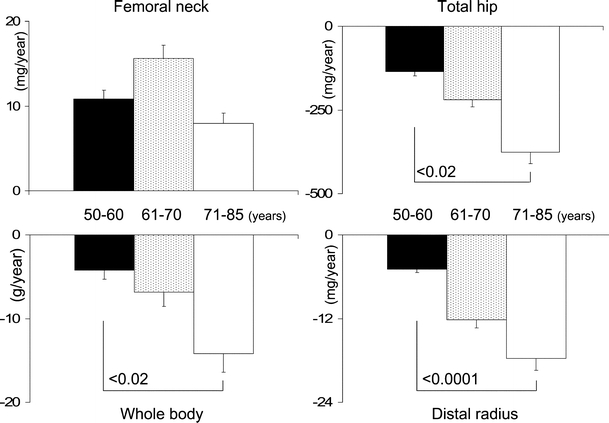
Comparison of the absolute values of net bone loss [(change in bone mineral content (BMC)] according to age group (black bars 50–60 years, pointed bars 61–70 years, white bars >70 years old). The slopes are different from 0 (p < 0.005–0.0001) for all regions of interest (ROIs) and for all age groups
In 183 men aged 50–60, rates of apparent and net bone loss were significantly different from 0 for all ROIs, except the trochanter. In 387 men aged 61–70 and in 155 men aged older than 70 at baseline, rates of apparent and net bone loss were significantly different from 0 for all ROIs. The rate of periosteal expansion (expressed as the change in the projected area of bone) was significantly different from 0 for all ROIs and for all three age groups. However, it did not vary across age groups for any site of measurement. Similarly, at distal forearm bones, periosteal apposition estimated as bone mass deposited annually did not change across the age groups (Fig. 4). By contrast, estimated endosteal bone loss was about twice as high after the age of 70 compared with men aged younger than 60 at baseline.
Fig. 4.

Upper panel: comparison of absolute values of annual rates of increase in external diameter at the distal radius and ulna according to age group. Lower panel: comparison of absolute values of rates of deposition of bone mass by periosteal apposition (positive hatched bars) and rate of endosteal bone loss (negative pointed bars) at the distal radius and ulna according to age group. The slopes are significantly different from 0 (< 0.005–0.0001) for periosteal apposition and for endosteal bone loss for both bones and for all age groups. Please note, in the lower panel, scales are different for radius and ulna
Discussion
In men, aBMD increased at the spine and decreased at the hip, distal forearm and whole body. At these sites, apparent bone loss (change in aBMD) was associated with net bone loss (change in BMC) except for the femoral neck. Apparent and net bone loss accelerated with age, whereas periosteal expansion rate remained stable. At the distal radius and ulna, endosteal bone loss accelerated with age, whereas the rate of periosteal expansion remained stable. Apparent bone loss at the hip and distal forearm was associated with a parallel net bone loss. At these ROIs, endosteal bone loss exceeded the periosteal apposition, and apparent bone loss was determined by outward displacement of lower quantity of bone mineral. Longitudinally assessed age-related apparent bone loss at the hip and distal forearm has been described in several cohorts of Caucasian men [5–7, 10, 16], but their morphological basis has not been investigated. In elderly men, apparent bone loss was associated with net bone loss at the intertrochanter ROI but with a gain in BMC at the total hip and femoral neck (narrow neck ROI) [13]. We found the same trend for the femoral neck but not for the total hip. This discrepancy is surprising because our cohort is younger. As the net bone loss accelerates with age, faster net bone loss (and not bone gain) could be expected in the older British cohort.
We confirm longitudinal and cross-sectional data on the gain in aBMD of lumbar spine in elderly men [7, 12, 14, 16–18]. Increase in the cross-sectional area of L3 at the midheight of the vertebral body is determined mainly by the periosteal expansion. This part is less involved in arthritis. Measurements performed on the X-rays allow for exclusion of the pathological calcifications. We do not speculate on the morphological basis underlying the increase in spine aBMD. Vertebral BMC and aBMD in the posteroanterior projection are determined by changes in the vertebral body and the posterior arch. Posterior arch and its processes are built mainly of cortical bone. As their periosteal surface is relatively high, its age-related gain of BMC due to periosteal apposition may be considerable. At the vertebral body, changes in BMC are determined by loss of trabecular bone inside and by the increase in BMC due to the periosteal apposition and the aggravation of arthritis. At the hip and distal forearm, both aBMD and BMC decreased, in agreement with previous studies [6, 16, 17]. Both apparent and net bone loss accelerated with ageing; by contrast, periosteal apposition remained constant. Thus, age-related acceleration of the apparent and net bone loss is determined by the acceleration of bone loss on endosteal surfaces. Apparent and net bone loss were significant in all age groups.
In women, menopause results in the acceleration of endocortical resorption and deceleration of periosteal apposition [19]. Thus, after menopause, periosteal apposition continues, as reported previously by Ahlborg et al. [20]. However, it does not increase sufficiently to offset endocortical bone loss. On the contrary, it decreases, which may contribute to the deterioration of bone strength and increased fracture risk. We postulated that postmenopausal osteoporosis is a disease of failed adaptation of bone [19]. However, in men also, age-related increase in endosteal bone loss is not accompanied by an increase in periosteal apposition that would offset the possible loss of strength. Periosteal apposition does not adapt to the endosteal bone loss and remains stable. This imbalance may result in a decrease of bone strength. Thus, in men also, osteoporosis seems to be a disease of failed adaptation.
Our data are consistent with the cross-sectional data obtained in elderly men by using the high-resolution peripheral quantitative computerised tomography (hr-pQCT) showing the increase in bone size at the axial and peripheral skeleton, as well as endosteal bone loss characterised by decrease in the trabecular volumetric BMD (vBMD) determined mainly by the decrease in the trabecular number, increase in total marrow area and cortical thinning, indicating endocortical resorption, and decrease in cortical vBMD [21, 22]. The decrease in cortical vBMD is determined mainly by the increase in the midcortical and subendocortical porosity, whereas subperiosteal porosity and real volumetric density of the mineral of cortical bone remain relatively stable during ageing [15, 23].
Our data help in understanding the difference in the age-related increase in fracture incidence. Young men have bigger bones than women, even after adjustment for age, weight and height [24, 25]. Then, aBMD and BMC decrease. Age-related acceleration of apparent and net bone loss is consistent with the exponential increase in fracture incidence. However, in contrast to women, periosteal apposition rate remains stable in men and may partly offset the endosteal bone loss and associated loss of bone strength. In elderly men, bones are larger than in women (because they were larger in youth and age-related periosteal apposition was greater), net bone loss is less (because periosteal apposition continues to deposit bone on the outer surface) and loss of bone strength starts later (because continuing periosteal expansion compensates partly for the loss of bone strength due to endosteal bone loss). These data are consistent with epidemiological observations that in men, fracture incidence increases later and, for a given age, is lower than in women [1, 26, 27].
Our study has limitations. Montceau les Mines is a small town, and its inhabitants may not be representative of the French population. The response rate for the invitation was 23%. Men who abandoned the study after the first examination were older and sicker, although they represent only 8% of the initial cohort. Men who were followed up may have been healthier than the general population, especially in the oldest group. However, this difference would have underestimated the age-related bone loss and its age-related acceleration. A number of men had lower number of DXA scans because they did not attend examinations regularly or abandoned the study before the end of the follow-up. A low number of DXA values and shorter follow-up could influence the accuracy of estimation of slopes. However, adjustment for the follow-up duration or the number of scans did not influence the results.
DXA presents limitations in the evaluation of bone width. In very old men, subperiosteal bone mass can be low and not recognised by the edge-detection system. This artefact can underestimate the bone width in elderly men and the age-related increase in bone width mainly in the cross-sectional studies (where the age range is large) but less so in the longitudinal study (where the follow-up period is shorter). The projected area of femoral neck may be overestimated because of calcifications in fibrous tissue. The measured radius site is established by the device. According to the individual anatomy, this site may be more distal (larger and more trabecular) or more proximal (narrower and cortical). Again, this artefact may introduce a bias mainly in cross-sectional studies.
Calculation of endosteal bone loss is indirect and based on the assumptions such as uniform bone flattening, constant subperiosteal bone vBMD and proportional periosteal expansion in all axes. By contrast, the advantage of this concept is that we do not make any assumption on the morphological basis underlying the endosteal bone loss (cortical thinning or trabecular bone loss, proportion of cortical to trabecular bone, similar or different rates of trabecular and cortical bone loss, etc.). Finally, our calculation of endosteal bone loss was carried out for the predominantly cortical sites and, although globally consistent with the cross-sectional data obtained by hr-pQCT, may not necessarily apply for the predominantly trabecular sites.
In conclusion, in a large cohort of elderly men, age-related apparent bone loss (aBMD) at the hip, distal forearm and whole body was determined by the net bone loss (BMC), except for the femoral neck. Apparent and net bone loss accelerated with age, whereas the periosteal expansion rate (widening of ROI) remained constant. At the distal forearm, age-related acceleration of the apparent bone loss was determined by the higher endosteal bone loss, whereas the periosteal apposition rate (estimated mass of deposited bone) remained constant.
References
- 1.Baron JA, Karagas M, Barrett J, Kniffin W, Malenka D, Mayor M, Kellet RB (1996) Basic epidemiology of fractures of the upper and lower limb among Americans over 65 years of age. Epidemiology 7:612–618 [DOI] [PubMed]
- 2.Johnell O, Gullberg B, Allander E, Kanis JA (1992) The apparent incidence of hip fracture in Europe: a study of national register sources. Osteoporos Int 2:298–302 [DOI] [PubMed]
- 3.Fransen M, Woodward M, Norton R, Robinson E, Butler M, Campbell AJ (2002) Excess mortality or institutionalisation after hip fracture: men are at greater risk than women. J Am Geriatr Soc 50:685–690 [DOI] [PubMed]
- 4.Trombetti A, Herrmann F, Hoffmeyer P, Schürch MA, Bonjour JP, Rizzoli R (2002) Survival and potential years of life lost after hip fracture in men and age-matched women. Osteoporos Int 13:731–737 [DOI] [PubMed]
- 5.Tracy JK, Meyer WA, Flores RH, Wilson PD, Hochberg MC (2005) Racial differences in rate of decline in bone mass in older men : the Baltimore Men’s Osteoporosis Study. J Bone Miner Res 20:1228–1234 [DOI] [PubMed]
- 6.Burger H, de Laet CEDH, van Daele PLA, Weel AEAM, Witteman JCM, Hofman A, Pols HAP (1998) Risk factors for increased bone loss in an elderly population: The Rotterdam study. Am J Epidemiol 147:871–879 [DOI] [PubMed]
- 7.Jones G, Nguyen T, Sambrook P, Kelly PJ, Eisman JA (1994) Progressive loss of bone in the femoral neck in elderly people: longitudinal findings from the Dubbo osteoporosis epidemiology study. Br Med J 309:691–695 [PMC free article] [PubMed]
- 8.Seeman E (2003) Periosteal bone formation - a neglected determinant of bone strength. N Engl J Med 349:320–323 [DOI] [PubMed]
- 9.Beck TJ, Looker AC, Ruff CB, Sievanen H, Wahner HW (2000) Structural trends in the aging femoral neck and proximal shaft: analysis of the Third National Health and Nutrition Examination Survey dual-energy X-ray absorptiometry data. J Bone Miner Res 15:2297–2304 [DOI] [PubMed]
- 10.Hannan MT, Felson DT, Dawson-Hughes B, Tucker KL, Cupples LA, Wilson PWF, Kiel DP (2000) Risk factors for longitudinal bone loss in elderly men and women: the Framingham osteoporosis study. J Bone Miner Res 15:710–720 [DOI] [PubMed]
- 11.Warming L, Hassager C, Christiansen C (2002) Changes in bone mineral density with age in men and women: a longitudinal study. Osteoporos Int 13:105–112 [DOI] [PubMed]
- 12.Melton LJ, Khosla S, Atkinson EJ, O’Connor MK, O’Fallon WM, Riggs BL (2000) Cross-sectional versus longitudinal evaluation of bone loss in men and women. Osteoporos Int 11:592–599 [DOI] [PubMed]
- 13.Kaptoge S, Dalzell N, Loveridge N, Beck TJ, Khaw KT, Reeve J (2003) Effects of gender, anthropometric variables, and aging on the evolution of hip strength in men and women aged over 65. Bone 32:561–570 [DOI] [PubMed]
- 14.Szulc P, Marchand F, Duboeuf F, Delmas PD (2000) Cross-sectional assessment of age-related bone loss in men. Bone 26:123–129 [DOI] [PubMed]
- 15.Tanno M, Horiuchi T, Nakajima I, Maeda S, Igarashi M, Yamada H (2001) Age-related changes in cortical and trabecular bone mineral status. A quantitative CT study of lumbar vertebrae. Acta Radiologica 42:15–19 [DOI] [PubMed]
- 16.Dennison E, Yoshimura N, Hashimoto T, Copper C (1998) Bone loss in Great Britain and Japan : a comparative longitudinal study. Bone 23:379–382 [DOI] [PubMed]
- 17.Karlsson MK, Obrant KJ, Nilsson BE, Johnell O (2000) Changes in bone mineral, lean body mass and fat content as measured by dual exergy X-ray absorptiometry: a longitudinal study. Calcif Tissue Int 66:97–99 [DOI] [PubMed]
- 18.Lehmann R, Wapniarz M, Randerath O, Kvasnicka HM, John W, Reincke M, Kutnar S, Klein K, Allolio B (1995) Dual-energy X-ray absorptiometry at the lumbar spine in German men and women : a cross-sectional study. Calcif Tissue Int 56:350–354 [DOI] [PubMed]
- 19.Szulc P, Seeman E, Duboeuf F, Sornay-Rendu E, Munoz F, Delmas PD. Bone fragility: failure of periosteal apposition to compensate for increased endocortical resorption in postmenopausal women J Bone Miner Res (in press) [DOI] [PubMed]
- 20.Ahlborg HG, Johnell O, Turner CH, Rannevik G, Karlsson MK (2003) Bone loss and bone size after menopause. N Engl J Med 349:327–334 [DOI] [PubMed]
- 21.Khosla S, Riggs BL, Atkinson EJ, Oberg AL, McDaniel LJ, Holets M, Peterson JM, Melton LJ III (2006) Effects of sex and age on bone microstructure at the ultradistal radius : a population-based noninvasive in vivo assessment. J Bone Miner Res 21:124–131 [DOI] [PMC free article] [PubMed]
- 22.Riggs BL, Melton LJ III, Robb RA, Camp JJ, Atkinson EJ, Peterson JM, Rouleau PA, McCollough CH, Bouxsein ML, Khosla S (2004) Population-based study of age and sex differences in bone volumetric density, size, geometry, and structure at different skeletal sites. J Bone Miner Res 19:1945–1954 [DOI] [PubMed]
- 23.Bousson V, Meunier A, Bergot C, Vicaut E, Rocha MA, Morais MH, Laval-Jeantet AM, Laredo JD (2001) Distribution of intracortical porosity in human midfemoral cortex by age and gender. J Bone Miner Res 16:1308–1317 [DOI] [PubMed]
- 24.Nieves JW, Formica C, Ruffing J, Zion M, Garrett P, Lindsay R, Cosman F (2005) Males have larger skeletal size and bone mass than females, despite comparable body size. J Bone Miner Res 20:529–535 [DOI] [PubMed]
- 25.Looker AC, Beck TJ, Orwoll ES (2001) Does body size account for gender differences in femur bone density and geometry? J Bone Miner Res 16:1291–1299 [DOI] [PubMed]
- 26.Kannus P, Niemi S, Parkkari J, Palvanen M, Vuori I, Järvinen M (1999) Hip fractures in Finland between 1970 and 1997 and predictions for the future. Lancet 353:802–805 [DOI] [PubMed]
- 27.Kannus P, Palvanen M, Niemi S, Parkkari J, Järvinen M, Vuori I (1996) Increasing number and incidence of osteoporotic fractures of the proximal humerus in elderly people. BMJ 313:1051–1052 [DOI] [PMC free article] [PubMed]