

Abstract
Layer 5 neurons in primary visual cortex make putative reciprocal feedback connections to the superficial layers. To test this hypothesis, we employed scanning laser photostimulation combined with intracellular dye injection to examine local functional excitatory inputs to and axonal projections from individual layer 5 neurons in brain slices from monkey V1. In contrast with previous studies of other V1 neurons, layer 5 neurons received significant input from nearly all of the cortical layers, suggesting individual layer 5 cells integrate information from a broad range of input sources. Nevertheless relative strengths of laminar inputs varied across neurons. Cluster analysis of relative strength of laminar inputs to individual layer 5 neurons revealed four discrete clusters representing recurring input patterns; each cluster included both excitatory and inhibitory neurons. Twenty-five of 40 layer 5 neurons fell into two clusters, both characterized by very strong input from superficial layers. These input patterns are consistent with layer 5 neurons providing feedback to superficial layers. The remaining 15 neurons received stronger input from deep layers. Differences in input from layer 4Cα versus 4Cβ also suggest specific associations of the magnocellular and parvocellular visual pathways, with populations receiving stronger input from deep versus superficial cortical layers.
Keywords: circuitry, cluster analysis, inhibitory, photostimulation, pyramidal
Introduction
An important step toward understanding perception and behavior is to understand the precise organization of neural circuits and the emergent functional properties of the component neurons. Studies of local cortical circuits have been pursued most vigorously in mammalian primary sensory cortices where the axons and dendrites of interconnected neurons display striking laminar specificity (especially between layers 2/3, 4, 5 and 6 in most species studied to date). Nowhere is this specificity more evident than in monkey primary visual cortex (V1) where these layers are further divided into functionally distinct sublayers (Hassler, 1967; Valverde, 1985; Casagrande and Kaas, 1994) and contain functionally distinct columnar regions such as blobs and interblobs (Livingstone and Hubel, 1984). The presence of this laminar and columnar functional architecture has made monkey V1 a useful model system for relating local cortical circuitry to function (Callaway, 1998a).
The relationship between neuronal anatomy and functional architecture predicts that the connections from lateral geniculate nucleus (LGN) to layer 4C and from layer 4C to more superficial layers play a dominant role in determining the functional properties of neurons in layers 2-4B (Lund and Boothe, 1975; Blasdel et al., 1985; Fitzpatrick et al., 1985; Lund, 1987; Lachica et al., 1992; Yoshioka et al., 1994; Callaway and Wiser, 1996; Yabuta and Callaway, 1998b). The information collected within superficial layer neurons is then conveyed to higher cortical areas (Livingstone and Hubel, 1983; Van Essen, 1985; Felleman and Van Essen, 1991; Sincich and Horton, 2002); however, it is likely that a substantial amount of additional local processing contributes to the output of V1. For example, anatomical studies indicate that pyramidal neurons in the superficial layers make reciprocal connections to layer 5 pyramidal cells, evidence that connections from deep layers have a modulatory influence on superficial layers (Callaway, 1998a). Several key anatomical findings support this idea. First, although layer 4C neurons project axons into layer 5, their densest axonal projections target layers 2-4B (Lund and Boothe, 1975; Lund, 1987; Callaway and Wiser, 1996; Yabuta and Callaway, 1998b). Neurons in these superficial layers then project dense axons to layer 5 (Lund and Boothe, 1975; Blasdel et al., 1985; Callaway and Wiser, 1996). Finally, most layer 5 pyramidal neurons preferentially target layers 2-4B with widespread axonal arborizations that lack specificity for functionally distinct compartments (Callaway and Wiser, 1996). Thus, layer 5 neurons are thought to rely on input from superficial layers to drive their activity and then provide feedback to the same layers. We sought to test this hypothesis by assaying the functional circuitry involving layer 5 neurons. Specifically, we employed scanning laser photostimlution to assay the laminar sources of functional, excitatory input onto individual layer 5 neurons in brain slices of macaque V1. Photostimulation was combined with intracellular dye injection to correlate local functional inputs with cellular morphology for each individually recorded layer 5 cell.
The population of excitatory ‘pyramidal’ neurons in layer 5 of macaque V1 differs in several respects from those in more commonly studied rodent cortices. The great majority of pyramidal neurons in layer 5 of macaque V1 (~80%) have only local axonal arbors that do not project out of V1 (Callaway and Wiser, 1996) and we therefore refer to them as non-projecting pyramidal neurons. These cells are the main focus of the present study. They are small pyramidal neurons with a ‘vestigial’ apical dendrite that typically extends only into the top of layer 5 or the bottom of layer 4Cβ without further branching (Lund, 1973; Callaway and Wiser, 1996), although on occasion this apical dendrite can be thicker and extend as high as layer 3. Non-projecting pyramids have widespread recurrent axonal arbors that spread throughout layers 1-4B, arborize more sparsely in layer 5, and avoid layers 4C and 6 (Callaway and Wiser, 1996). Based on their axonal arborizations, non-projecting pyramidal neurons provide the means for a feedback projection to the superficial layers.
A smaller proportion of layer 5 pyramidal neurons have axonal arbors that extend out of V1 (Callaway and Wiser, 1996). Retrograde labeling studies indicate that layer 5 projecting pyramids may project to subcortical structures, including the pulvinar nucleus of the thalamus and the superior colliculus (Lund et al., 1975). Some of these cells have more prominent apical dendrites than non-projecting pyramids, but they typically extend into more superficial layers with few or no branches and the apical branches within layer 5 extend downward to remain restricted to layer 5 (Callaway and Wiser, 1996). These cells’ local axons arborize primarily in the bottom of layer 5 with some branches extending into layer 6. ‘Tall’ layer 5 pyramids, which are common in rodents, comprise a subset of the large ‘Meynert’ cells in macaque V1 (Lund and Boothe, 1975; Valverde, 1985) and are relatively rare. They are estimated to account for <0.5% of layer 5 neurons (Winfield et al., 1981) and their arborizations have been examined in only a few studies (Callaway, 1998b; Rockland and Knutson, 2001).
There is a small variety of inhibitory neurons within the main body of layer 5, excluding the population of cells inhabiting the layer 5/6 border (Lund et al., 1988). Most of these neurons display axonal ‘basket’ formations (Lund et al., 1988). Their axonal projections tend to mimic the morphology of non-projecting pyramidal neurons in that their axons target the superficial layers. Thus ‘basket’-like inhibitory neurons within layer 5 are, like non-projecting pyramidal cells, good candidates for providing feedback to the superficial layers.
Despite the power of anatomical studies in providing insight into cortical function, it is evident that such studies alone cannot fully predict the complexity of local cortical circuits. Studies of functional connectivity using laser scanning photo-stimulation have revealed specificity that could not be predicted from the anatomical overlap of dendritic and axonal arbors (Dantzker and Callaway, 2000; Sawatari and Callaway, 2000; Briggs and Callaway, 2001; Yabuta et al., 2001). In the case of V1 layer 5 neurons, there are excitatory neurons within every cortical layer that have axonal arbors capable of synapsing onto the dendrites of layer 5 neurons. Thus any given layer 5 neuron could theoretically receive functional input from all of these layers or from just selected subsets.
We find four distinct patterns of functional input based on relative laminar input strength to layer 5 neurons, including both non-projecting pyramids and inhibitory neurons. Our population of definitively identified projecting pyramids is not sufficient to determine whether these cells receive all four input patterns. The majority of neurons in our sample receive strong superficial layer input, consistent with their roles in providing feedback to the superficial layers. The remaining neurons receive strong inputs from the deep layers and/or layers 4Cα or 4Cβ, suggesting that subsets of layer 5 neurons differentially process magno- and parvocellular information. These findings suggest diverse, yet distinct, functional roles for layer 5 neurons in visual processing.
Materials and Methods
Summary of Photostimulation
In order to map the local inputs to individual layer 5 neurons in monkey V1, we employed scanning laser photostimulation, which measures the sources of functional, excitatory input to individually recorded and intracellularly labeled neurons within brain slices. Photostimulation involves using UV light to generate action potentials (APs) in neurons with somata restricted to a small area (100 μm diameter) within a living brain slice while simultaneously recording from an individual neuron. Action potentials are triggered in candidate presynaptic neurons by focal, light-induced uncaging of glutamate, potentially causing excitatory post-synaptic currents (EPSCs) within the recorded neuron (Dantzker and Callaway, 2000; Sawatari and Callaway, 2000; Briggs and Callaway, 2001). Control experiments indicate that evoked currents measured in the recorded neuron reflect direct monosynaptic inputs from a neuron(s) near the stimulation site. Such non-invasive stimulations can be made at hundreds of sites in the brain slice allowing for detailed measurement of the sources of columnar, functional input onto the recorded cell. The technique has been used successfully in many labs (Callaway and Katz, 1993; Katz and Dalva, 1994; Sawatari and Callaway, 1996, 2000; Roerig and Kao, 1999; Dantzker and Callaway, 2000; Briggs and Callaway, 2001; Schubert et al., 2001, 2003; Yabuta et al., 2001; Shepherd et al., 2003) and the precise details of our implementation in macaque V1 have also been described previously (Sawatari and Callaway, 2000; Briggs and Callaway, 2001; Yabuta et al., 2001).
Brain Slice Preparation and Recording
Slices of primary visual cortex were cut from tissue harvested from the opercular cortical surface of macaque monkeys (Macaca radiata). Four juvenile monkeys (male and female; ages 23–25 months) were used in this study. Animals were anesthetized with isofluorine and their EKG and heart rate were monitored throughout the surgical procedure. When applicable, post-operative analgesics were administered. In all cases, tissue was harvested on two different days. In a recovery surgery, tissue was removed from the left hemisphere of V1. Five to 10 days later, a non-recovery surgery was performed to harvest tissue from the right hemisphere of V1 (Sawatari and Callaway, 2000; Briggs and Callaway, 2001). Data were collected from 48 cells over eight experimental days with recordings from 40 cells yielding the data analyzed for this study (see further below). Details of the preparation of living brain slices from monkeys and the subsequent recordings within the slices have been described previously (Callaway and Wiser, 1996; Wiser and Callaway, 1996; Sawatari and Callaway, 2000; Briggs and Callaway, 2001). All procedures were approved by the Institutional Animal Care and Use Committee.
Briefly, 400 μm thick sagittal brain slices were prepared from V1 and stored for up to 20 h in an interface holding chamber. For recording, a slice was transferred into the recording chamber containing room temperature, oxygenated artificial cerebral spinal fluid (ACSF; composition in mM: NaCl 124, KCl 5, KH2PO4 1.25, MgSO4 2, CaCl2 3, NaHCO3 26, d-glucose 10, pH 7.4) with 130–140 μM α-CNB caged glutamate (Molecular Probes, Eugene, OR, G-7055). Glass electrodes (8–10 MΩ) filled with a potassium-gluconate-based intracellular solution (composition in mM: K-gluconate 130, EGTA 1, MgCl2 2, CaCl2 0.5, di-Na ATP 2.54, HEPES 10, pH 7.3) containing 0.5% biocytin were used to patch blindly onto a single layer 5 neuron located deep within the slice (always > 50 μm and typically > 100 μm from the surface) in a whole-cell patch configuration. Neurons were held in voltage clamp at −65 mV (near the reversal potential of chloride ions measured empirically using caged GABA) such that EPSCs were detected as inward currents (e.g. Fig. 2). Photostimulation was evoked with a 10 ms flash of UV light from an argon-ion laser directed through a water-immersion 40× microscope objective which was focused at a depth of ~50–100 μm within the brain slice. Details of the photostimulation technique, its spatial resolution and limitations have been well described (Dantzker and Callaway, 2000; Sawatari and Callaway, 2000; Briggs and Callaway, 2001; Yabuta et al., 2001). Briefly, control experiments measuring AP firing of individual current-clamped neurons following photostimulation indicated that only neurons with cell bodies within ~75–100 μm of any given stimulation site fired action potentials. Therefore when recording from individual neurons in voltage clamp, evoked synaptic currents observed in the recorded neuron must be the result of AP firing in mono-synaptically connected presynaptic neurons located near the stimulation site. When the dendrites of the recorded cell were directly photostimulated, direct inward currents were elicited which had a characteristic shape and zero latency, distinguishing them from synaptic currents; they were thus easily subtracted from subsequent analyses [see example in trace 2 from cell 40 in Fig. 2] (Dantzker and Callaway, 2000).
Figure 2.
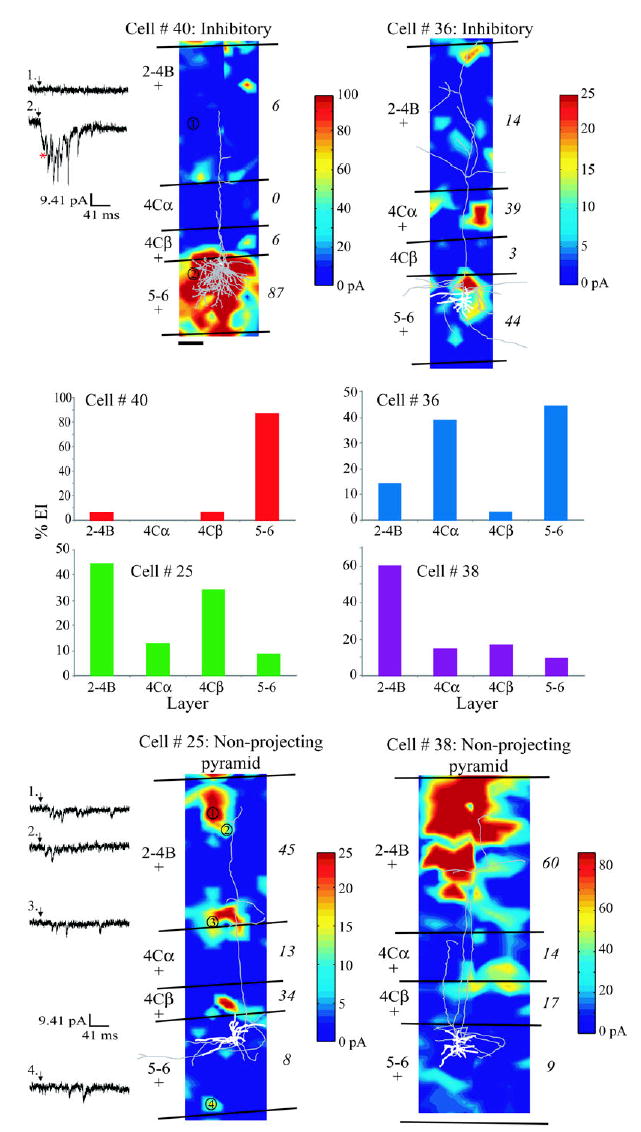
Excitatory input maps for four example layer 5 neurons: two inhibitory cells (top) and two non-projecting neurons (bottom). Input maps are shown for cell 40, 36, 38, 25 (clockwise from top left). Maps are smoothed, color-coded linear interpolations of the sum of EPSC amplitude data at each stimulation site minus the average spontaneous EPSC amplitude sum measured for each cell. Cell reconstructions are overlayed onto each plot (dendrites white, axons gray; cell 40’s reconstruction includes the cell body and axons only); laminar boundaries are represented by black lines and are labeled to the left of each plot; ‘+’ symbols beneath laminar labels indicate that the cell received statistically significant input compared to spontaneous activity from that layer (also see Table 1, italicized cells); numbers to the right of each plot are percent EI from each layer; and color-coded scale bars representing in pA the sum of EPSC amplitudes minus average spontaneous EPSC amplitude sum are to the right of each input map. The 100 μm scale bar beneath cell 40’s input map represents the scale used in all four plots. Example voltage clamp records following photostimulation are illustrated to the left of the input maps of cells 40 and 25; numbered sites on the input maps correspond to the numbered records. Arrows indicate laser-shutter opening. In the voltage clamp record following phostostimulation at site 2 for cell 40, the first downward deflection in the trace (red asterisk) is a near-zero latency direct response in the recorded neuron. Subsequent downward deflections are EPSCs. Site 1 for cell 40 shows a stimulation trial in which no EPSCs were detected. Sites 1–4 for cell 25 show EPSCs that were evoked in the absence of direct responses. The four bar graphs in the middle of the figure represent the percent EI from each layer for each of the four cells, with input maps directly above or below the graphs (see also Table 1).
Stimulations were made at sites ~50 μm apart in a roughly columnar fashion surrounding the recorded neuron (width ranging from ~250 to ~500 μm) including all of the cortical layers from the pial surface to the white matter. Each stimulation trial was followed by a no-stimulation trial to sample spontaneous EPSC events. Custom data-acquisition software was used to digitize and record the currents from each trial. Following data acquisition, each neuron was iontophoresed with biocytin for 3–10 min. Finally, five concentric alignment sites were made surrounding the stimulated column. Alignment sites were made by burning small holes in the tissue with the laser (3 × 1 s flash duration). These holes later appeared as photo-bleached spots after the cytochrome oxidase stain was completed (Dantzker and Callaway, 2000). The alignment sites provided the means by which the digitized coordinate map of stimulation sites were overlayed onto the anatomical reconstruction of the neuron and the laminar borders.
Slices were fixed in 4% paraformaldehyde (in 0.1 M phosphate-buffered saline), then sectioned and stained for cytochrome oxidase activity and biocytin as described previously (Callaway and Wiser, 1996; Wiser and Callaway, 1996). A Neurolucida (Microbrightfield, Colchester, VT) system was used to reconstruct the axons and dendrites of each recorded neuron as well as the laminar borders. Sections were later counterstained with thionin to reveal the 4Cα/4Cβ laminar boundary, which cannot be identified based on cytochrome oxidase staining (Yabuta and Callaway, 1998a). Anatomical reconstructions and laminar borders were aligned with the digitized coordinate maps of the stimulation sites using Adobe Illustrator (Adobe Systems Inc., San Jose, California). This allowed for the assignment of each stimulation site to its appropriate layer.
A neuron was included in the analysis if it was verified that the recording was made in layer 5 and there was a minimum of 20 stimulation sites within each layer. Neurons were classified as ‘pyramidal’ if they had spiny dendrites with an apical dendritic process extending from the top of the soma and a main descending axon extending from the base of the soma (e.g. Fig. 1A). Neurons were classified as inhibitory if they had smooth or beaded dendrites and an axonal arbor that originated from the cell’s apical surface (e.g. Fig. 1B). Neurons were classified as ‘unknown’ if labeling was inadequate to distinguish between pyramidal and inhibitory morphologies. Pyramidal neurons were further classified as: (1) non-projecting pyramidal (NP) if the main descending axon ended within the plane of the brain slice or turned upward, leaving no further descending branches; (2) projecting pyramidal if the main descending axon could be traced into the white matter; or (3) unknown pyramidal (UP) if the projection status of the axons could not be determined — e.g. if the descending axon left the plane of the brain slice before terminating or entering the white matter.
Figure 1.

Photographs and reconstructions of intracellularly labeled layer 5 neurons. (A) A typical non-projecting pyramidal neuron (cell 8). The cell has a small pyramidal soma and spiny dendrites. The short, thin apical dendrite (white arrow) ends within layer 5 (layers are labeled to the right and the boundaries are delineated by horizontal dashed lines; pial surface is oriented toward the top). The main descending axon leaves the soma at its base (lower black arrow) and turns just below the cell body to extend upward toward the superficial layers. An ascending branch of the axon is indicated by the upper black arrow. This axon continues into superficial layers where it forms an extensive arbor, visible in the reconstruction (C). (B) An inhibitory neuron (cell 36, also in Fig. 2). The cell has a small round soma with aspiny dendrites. The axon leaves the soma at its top (arrow) and arborizes extensively nearby (out of the focus plane of the photograph, visible in the reconstruction in D). In addition to biocytin staining of intracellularly labeled neurons, sections are also stained for cytochrome oxidase and with thionin to reveal laminar boundaries (see Materials and Methods). Scale bar in A applies to both photographs = 50 μm. (C) The camera lucida reconstruction of cell 8 is scaled to 20% of the photograph; the dashed boxed area of the reconstruction corresponds to the area of the photograph. In the reconstruction, dendrites are gray, axons are black and the cell body is black. The laminar boundaries for the reconstruction are delineated by thin lines and are labeled. (D). The reconstruction for cell 36 is scaled to 20% of the photograph. Again, dendrites are gray, axons are black and cell body is black. Laminar boundaries are indicated and labeled. The boxed area of the reconstruction corresponds to the area of the photograph.
Data Analysis
Intracellular recordings for each individual cell were analyzed using a commercial mini-analysis program (Synaptosoft Inc., Leonia, NJ). (See example traces illustrated in Fig. 2.) Recordings were grouped according to the laminar location of the corresponding stimulation site (or no-stimulation trials), then numbers, amplitudes and sums of amplitudes of all EPSCs occurring within 150 ms of stimulation were determined for each trial. Inward currents recorded as a result of direct stimulation of the recorded neuron or its dendrites (e.g. Fig. 2, cell 40, site 2, red asterisk) were differentiated from EPSCs based on their shape and near-zero-latency and were therefore excluded from the analysis (Dantzker and Callaway, 2000). The latency distinction between direct stimulations and EPSCs was strict because control experiments revealed that action potentials resulting from glutamate uncaging at the stimulated cell body had a latency of ⩾2 ms (Dantzker and Callaway, 2000). The laminar groupings of each of the EPSC attributes (number, amplitude and sum of amplitudes) for each cell were compared to the same attributes of the spontaneous activity measured in each cell during no-stimulation trials and tested for statistically significant increases as determined by Mann–Whitney U-tests (P < 0.05; Table 1).
Table 1.
Statistically significant laminar input and percent of total EI from each layer for the layer 5 neurons in the dataset
| Statistical significance
|
Percent EI
|
|||||||||||
|---|---|---|---|---|---|---|---|---|---|---|---|---|
| Cluster | Cell no. | Cell Type | 2–4B | 4Cα | 4Cβ | 5 | 6 | 5–6 | 2–4B | 4Cα | 4Cβ | 5–6 |
| 1 | 23 | NP | + | + | + | + | + | + | 7 | 6 | 38 | 49 |
| 1 | 30 | Unknown | + | + | + | + | + | + | 8 | 8 | 11 | 73 |
| 1 | 33 | Unknown | + | + | + | + | + | + | 14 | 20 | 21 | 44 |
| 1 | 40 | Inhibitory | + | + | + | + | + | 6 | 0 | 6 | 87 | |
| 1 | 24 | NP | + | + | + | + | + | 2 | 27 | 14 | 57 | |
| 1 | 39 | Inhibitory | + | + | + | + | + | 2 | 31 | 27 | 41 | |
| 1 | 16 | Inhibitory | + | + | + | + | 4 | 8 | 13 | 76 | ||
| 1 | 5 | NP | + | + | + | + | 3 | 8 | 2 | 88 | ||
| 2 | 7 | NP | + | + | + | + | + | + | 10 | 39 | 34 | 16 |
| 2 | 9 | UP | + | + | + | + | + | + | 14 | 48 | 23 | 16 |
| 2 | 14 | Unknown | + | + | + | + | + | + | 19 | 47 | 4 | 30 |
| 2 | 32 | Unknown | + | + | + | + | + | 32 | 34 | 0 | 34 | |
| 2 | 36 | Inhibitory | + | + | + | + | + | 14 | 39 | 3 | 44 | |
| 2 | 15 | NP | + | + | + | + | 34 | 53 | 2 | 10 | ||
| 2 | 1 | Projecting | + | + | + | + | 20 | 34 | 6 | 40 | ||
| 3 | 8 | NP | + | + | + | + | + | + | 34 | 18 | 36 | 13 |
| 3 | 11 | Unknown | + | + | + | + | + | + | 41 | 6 | 36 | 17 |
| 3 | 17 | UP | + | + | + | + | + | + | 27 | 13 | 34 | 26 |
| 3 | 20 | NP | + | + | + | + | + | + | 40 | 22 | 29 | 8 |
| 3 | 22 | Unknown | + | + | + | + | + | + | 33 | 25 | 32 | 10 |
| 3 | 31 | Unknown | + | + | + | + | + | + | 34 | 10 | 28 | 28 |
| 3 | 21 | UP | + | + | + | + | + | 46 | 18 | 25 | 11 | |
| 3 | 25 | NP | + | + | + | + | + | 45 | 13 | 34 | 8 | |
| 3 | 26 | NP | + | + | + | + | + | 40 | 4 | 25 | 31 | |
| 3 | 28 | Unknown | + | + | + | + | + | 44 | 2 | 33 | 21 | |
| 3 | 34 | Inhibitory | + | + | + | + | 35 | 3 | 20 | 41 | ||
| 4 | 2 | NP | + | + | + | + | + | 69 | 1 | 13 | 17 | |
| 4 | 3 | NP | + | + | + | + | + | + | 60 | 13 | 8 | 19 |
| 4 | 4 | NP | + | + | + | + | + | + | 59 | 19 | 13 | 9 |
| 4 | 10 | NP | + | + | + | + | + | + | 69 | 6 | 10 | 15 |
| 4 | 27 | NP | + | + | + | + | + | 62 | 0 | 19 | 19 | |
| 4 | 38 | NP | + | + | + | + | + | + | 60 | 14 | 17 | 9 |
| 4 | 37 | Unknown | + | + | + | + | + | 58 | 9 | 13 | 20 | |
| 4 | 19 | NP | + | + | + | + | + | 50 | 26 | 7 | 18 | |
| 4 | 35 | Inhibitory | + | + | + | + | + | 52 | 8 | 10 | 29 | |
| 4 | 6 | NP | + | + | + | + | 61 | 0 | 15 | 24 | ||
| 4 | 12 | NP | + | + | + | + | 53 | 4 | 2 | 41 | ||
| 4 | 18 | NP | + | + | + | + | 47 | 10 | 0 | 43 | ||
| 4 | 13 | NP | + | + | + | 84 | 0 | 0 | 16 | |||
| 4 | 29 | Inhibitory | + | + | + | 44 | 0 | 11 | 44 | |||
Column 1 indicates the cluster identity of each cell based on the analysis of percent EI (see Fig. 3; clusters 1–4). Column 2 indicates the cell’s identification number and column 3 indicates the cell type (non-projecting pyramid: NP; projecting pyramid: Projecting; pyramid of unknown projection status: UP, inhibitory or unknown). Columns 4–8 indicate whether or not (‘+’ or blank) each neuron received significant input (P < 0.05, see Materials and Methods) based on EPSC number from stimulation in a given layer compared to the spontaneous activity recorded in the neuron. Column nine indicates whether or not each neuron received significant input from layers 5 and 6 combined (see Materials and Methods). Columns 10–13 indicate the percent EI from each layer (% EI indicated from layers 5 and 6 combined only). Italicized neurons (numbers 40, 36, 25 and 38) are the cells illustrated in Figure 2.
In the second analysis, the evoked input (EI) values from each layer were expressed as a percentage of the sum of EI values from all layers for each cell to illustrate the laminar input pattern for each cell (Table 1). EI for each layer equaled the mean sum of amplitudes of EPSCs from each stimulation site within that layer for a single cell, minus the mean sum of EPSC amplitudes for no-stimulation (spontaneous) trials for the same cell. This value was then divided by the total EI for all of the stimulation sites to normalize for differences between cells in recording conditions (Yabuta et al., 2001). The percent EI values reflect normalization based on the total input to a given cell, thus bypassing many of the issues inherent in the examination of absolute input values from voltage clamp recordings (Wehr and Zador, 2003; unpublished observations). EI graphs were made for each individual cell (data shown for four example neurons in Fig. 2).
Unlike most mammalian cortices, primate V1 contains more numerous subdivisions of the basic cortical layers. The superficial layers in the primate include layers 2/3A, 3B, 4A and 4B. Layer 4C is divided into layers 4Cα and 4Cβ. Anatomical studies have identified differences in input to each of these subdivisions (Hubel and Wiesel, 1972; Hendrickson et al., 1978; Blasdel and Lund, 1983; Lachica et al., 1992). In our initial analyses, we separated all of the cortical layers. However, inputs from the superficial layer subdivisions tended to correlate within layer 5 neurons; 24 of the 36 neurons receiving significant superficial layer input (Table 1) received significant input from at least three of the four subdivisions of the superficial layers (not shown). Similarly, inputs from the deepest two layers, layers 5 and 6, tended to correlate (Table 1). Inputs from layers 4Cα and 4Cβ tended to vary (Table 1). Because superficial layer inputs tended to correlate and deep layer inputs tended to correlate, we combined layers 2/3A through 4B into one superficial layer (now analogous to layer 2/3 in other species) (Hassler, 1967; Casagrande and Kaas, 1994) and we combined layers 5 and 6 into one deep layer. In Table 1, significant input is shown for layers 5 and 6 separately and together. We analyzed layers 4Cα and 4Cβ separately throughout.
A cluster analysis was performed on the percent EI data matrix to distinguish any clusters of laminar input patterns. The cluster analysis was preformed using a Euclidian distance calculation of within-cluster distances and Ward’s linkage method (using a custom Matlab program). A Thorndike analysis of the critical threshold was conducted to suggest the likely number of different clusters in the dataset (Thorndike, 1953; Cauli et al., 2000). Neurons within each cluster were then grouped and their average percent EIs calculated and graphed in Figure 4. To elucidate how the clustering of the dataset emerged, the percent EIs from each layer were compared to the other layers for all cells in the dataset (Fig. 4).
Figure 4.
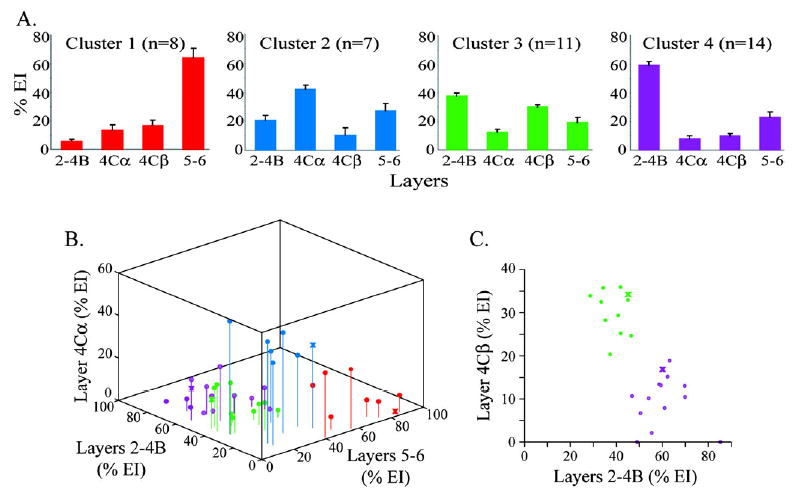
Percent EI patterns for cells within clusters 1, 2, 3 and 4. A. Average laminar percent EIs for the neurons within each cluster (cluster 1 in red, cluster 2 in blue, cluster 3 in green, cluster 4 in purple). Error bars represent standard errors. The numbers of cells in each cluster are indicated next to the cluster names. (B) Percent EI from layers 2–4B versus 5–6 versus 4Cα for each layer 5 neuron. Neurons within each cluster are color coded as above. Neurons with points represented by ‘X’s are the neurons shown in Figure 2 (cell 40, 36, 25 and 38). Cluster 1 and 2 neurons (red and blue respectively) are distinguished based on stronger input from layers 5–6 (cluster 1 neurons) and layer 4Cα (cluster 2 neurons). (C) Comparison of percent EI from layers 2–4B versus 4Cβ for neurons in clusters 3 and 4. Here neurons in clusters 3 and 4 separate based on percentage of evoked input from the superficial layers vs. layer 4Cβ.
‘Input maps’ illustrating the spatial patterns of excitatory input were made for each neuron (see examples in Fig. 2). These smoothed, color-coded linear interpolations were made using custom Matlab programs (Briggs and Callaway, 2001). They illustrate the evoked activity (sum of EPSC amplitudes at each site minus sum of spontaneous EPSC amplitudes, color coded and represented in pA on each scale bar) measured in an individual neuron. Anatomical reconstructions of the individual neurons were overlayed on top of each input map.
Technical Limitations
During brain slice preparation, axonal arbors are cut, including the afferent input to the cortical area and many local axonal arbors. For this reason, horizontal and/or distant inputs originating outside the local column containing the recorded neuron were not assayed. Care was taken to record from neurons in the middle of each brain slice (see above) in order to increase the probability that the entire dendritic arbor of the recorded cell is preserved. Although the size of the brain slices used in this study should have preserved the majority of the local processes within a cortical column, it is likely that some damage was done to axons and dendrites of neurons within the stimulated column. Thus the inputs measured in the current study could underestimate the extent of columnar connectivity.
It is unlikely that the differences in input patterns observed for the neurons in our dataset were due to differences in the extent of axon preservation across slices. We noted no differences in the depth of cells within the slice or any other features across the four clusters. Additionally, the opercular surface of V1 is quite flat, such that during our slicing procedure, slices were always cut perpendicular to the surface assuring that the tall apical processes of neurons within the slice were preserved.
Although cytochrome oxidase staining was performed on the slices in order to visualize laminar boundaries and blobs, photostimulation within layer 2/3 bleached the stain to the extent that blob locations beneath the stimulated column could not be determined. For this reason, it was not possible to correlate input patterns to neuronal locations relative to blobs/interblobs.
Finally, the photostimulation method indiscriminately stimulates all cell types with somata near the stimulation site. Thus, it is not possible to directly determine which cell type at a particular stimulation site is providing the connections that result in evoked EPSCs. In many cases, however, this limitation can be overcome in part based on knowledge of the anatomical cell types located at the stimulation site; it can be inferred that cell types that do not project axonal arbors to locations that overlap with dendrites of the recorded cell could not evoke EPSCs.
Results
We used scanning laser photostimulation to map the laminar sources of functional, local, excitatory input to 40 individual layer 5 neurons in brain slices of macaque V1. Following input mapping, each neuron was iontophoretically filled with biocytin to allow identification of the anatomically defined cell type. Figure 1A,B shows photographs and reconstructions of a non-projecting pyramid and an inhibitory neuron respectively. Reconstructions of inhibitory and non-projecting pyramidal neurons are also illustrated in Figure 2. All of the inhibitory neurons encountered in this study resembled basket cells in their morphology and most had axonal branches in the superficial layers (Lund et al., 1988). Anatomical labeling allowed cell type identification for 31 of 40 neurons. Of these 31 neurons, 7 were inhibitory neurons and 24 were pyramidal neurons. Of the 24 pyramidal neurons, 20 were non-projecting pyramids, 1 was an identified projecting pyramid, and 3 were pyramids of unknown projection status (see Materials and Methods; Table 1).
In order to quantify the excitatory input from each layer to each recorded neuron, we performed two analyses. In the first analysis, we determined for each cell whether photostimulation in a given layer resulted in a significant increase in excitatory synaptic activity relative to spontaneous activity, regardless of the magnitude of that increase (Table 1, columns 4–9). In the second analysis, we evaluated for each cell the relative strengths of evoked inputs from each layer, i.e. here the values were normalized by total input (percent EI; Table 1, columns 16–19).
Functional Input to Layer 5 Neurons: Statistically Significant Laminar Inputs
Most layer 5 neurons received significant input from most of the cortical layers. For example, all 40 layer 5 neurons in the sample received significant input from the deep layers (Table 1). Deep layer input was dominated by input from layer 5. Input strength from layer 5 was on average 1.9 times stronger than from layer 6. Five neurons out of 40 received stronger layer 6 input; 7 received roughly equal strengths of input from the two layers (within 20%); and 28 received stronger input from layer 5. Additionally, 36 of 40 cells received significant input from layers 2–4B (Table 1, columns 4–9). This result contrasts with recordings from neurons in other layers of primate V1 (using identical methods) where such ubiquitous significant input from the cortical layers was not present (Sawatari and Callaway, 2000; Briggs and Callaway, 2001; Yabuta et al., 2001). Although most cells received significant input from most layers, laminar input strengths from various layers varied considerably within individual cells. In other words, significant input from one layer in a given neuron usually differed in strength compared to significant input from another layer in the same cell (see Table 1). These differences in laminar input strength are the focus of most of the descriptions that follow.
Functional Input to Layer 5 Neurons: Representative Input Maps
We observed differences in laminar input strength based on relative strengths of inputs across neurons in the dataset (Table 1). Figure 2 illustrates example input maps and percent EIs from each layer, for four individual layer 5 neurons (cell 40, an inhibitory neuron; cell 36, an inhibitory neuron; cell 25, a non-projecting pyramidal neuron; and cell 38, a non-projecting pyramidal neuron).
Cell 40 was an inhibitory neuron with dense axons in the deep layers and a single axon extending into the superficial layers. The neuronal reconstruction and laminar borders were overlayed onto cell 40’s excitatory input map (see Materials and Methods). The color-coded values illustrated in the input map provide a visual representation of the locations of presynaptically connected neurons and the strength of their connections. Example voltage clamp records following photostimulation at sites 1 and 2 are illustrated to the left of the input map for cell 40. Photostimulation at site 1 failed to evoke detectable EPSCs within the inhibitory neuron. Photostimulation at site 2 evoked both a direct response (red asterisk) and a number of inward EPSCs. Cell 40 received statistically significant increases in EPSC activity compared to spontaneous activity from layers 2–4B, 4Cβ and 5–6, as indicated by ‘+’ symbols underneath each laminar label (also see Table 1, cell 40 in italics). The relative strengths of evoked inputs (percent EI) from each layer are indicated by both the numbers to the right of the input map and the graph below the input map. The percent EI from the deep layers was 87%, indicating much stronger input from deep layers than any other layers.
Cell 36 was also an inhibitory cell and this neuron had superficial layer axonal branches as well as branches in the deep layers. It received significant excitatory input from layers 2–4B, 4Cα and 5–6. Note that the laminar input pattern for this cell is different from that of cell 40. It received its strongest inputs based on percent EI not only from layers 5–6, but also from layer 4Cα (see graph below input map and Table 1, cell 36 in italics).
Cell 25 is a non-projecting pyramidal neuron with axonal branches in the superficial and deep layers. Example voltage clamp records measured following stimulation at four sites are shown to the left of the input map. This cell received significant input from all of the cortical layers but the strength of the input varied between layers. The laminar input pattern differed from both cells 40 and 25, with the strongest inputs coming from the superficial layers and layer 4Cβ (see graph above cell 25 and Table 1, cell 25 in italics).
Cell 38 is also a non-projecting pyramidal neuron with superficial layer axonal branches typical of this morphological cell type. This cell also received significant input from all of the cortical layers but with input strength varying markedly between layers. This cell illustrates a fourth laminar input pattern with dominant input from the superficial layers (see graph above input map and Table 1, cell 38 in italics).
The four neurons illustrated in Figure 2 received four different laminar input patterns based on the relative strengths of inputs. Additionally, they illustrate a trend in the dataset: neurons of the same morphological cell type often received different patterns of laminar input. For example, cells 40 and 36 are both inhibitory neurons; however, their laminar input patterns differ. Similarly, cell 25 and 38, both non-projecting pyramidal neurons, received different laminar input patterns. The general trend we observed in our dataset was a diversity of input patterns for cells of the same anatomically defined cell type. In other words, there did not appear to be a uniformity of input patterns for cells of the same type, as has been observed for neurons in layers 4B and 6 in primate V1 (Briggs and Callaway, 2001; Yabuta et al., 2001). We did, however, have the impression that there were a small number of recurring laminar input patterns based on input strength. These observations prompted an examination of the dataset for the possibility of distinct groups of layer 5 neurons based solely on their laminar sources of functional excitatory input.
Functional Input to Layer 5 Neurons: Analyses of Percent EI
We performed a cluster analysis on the percent EI data matrix (Table 1, columns 16–19) to test for clusters of layer 5 neurons based on their laminar input patterns. Figure 3 illustrates the resulting cluster dendrogram of percent EIs for the 40 layer 5 cells in the dataset. The dotted line represents the Thorndike critical threshold which estimates the numbers of distinct groups in the cluster dendrogram (Thorndike, 1953; Cauli et al., 2000). The cluster analysis and the Thorndike threshold suggested four distinct groups of layer 5 neurons based on percent EI (Clusters 1 through 4 coded by color). Each cell number is color coded according to its cluster assignment (inhibitory neurons are in bold italics). The layer 5 neurons are also grouped in Table 1 according to their cluster assignment.
Figure 3.

Cluster dendrogram based on percent EIs to each layer 5 neuron. The Thorndike critical threshold, represented by the dashed line, suggests four clusters: clusters 1, 2, 3 and 4 (color coded in red, blue, green and purple respectively). The identification numbers of each layer 5 neuron are indicated along the x-axis and are color coded according to the cluster assignments. The y-axis represents the average within-cluster distance between each layer 5 neuron in the data set. Bold, italicized cell numbers are inhibitory cells. Regular font cell numbers are non-projecting, projecting, or cells of unknown type.
To determine whether the percent EI analysis accurately grouped neurons with similar laminar input patterns, we calculated the average profiles for neurons within each cluster, and additionally compared, across all of the neurons, the percent EI from each layer versus the other layers.
Figure 4A illustrates averaged percent EI graphs for neurons in each of the four clusters (color coded according to cluster). Cluster 1 neurons received their strongest inputs from the deep layers. Cluster 2 neurons received their strongest inputs from layers 4Cα and the deep layers. Cluster 3 neurons received their strongest inputs from layers 4Cβ and the superficial layers. Cluster 4 neurons received their strongest inputs from the superficial layers. Comparison of the percent EI graphs for cells 40, 36, 25 and 38 (Fig. 2; similarly color-coded) to the average percent EI graphs of their corresponding clusters (Fig. 4A) illustrates that the inputs to these four individual neurons are similar to their cluster averages.
To examine to what extent the cluster averages illustrated in Figure 4A represent all of the individual neurons within each cluster, we plotted all of the layer 5 neurons together, comparing the percent EI from one layer to the other layers. Figure 4B illustrates the percent EI from the deep layers versus the superficial layers versus layer 4Cα for all of the cells in the dataset (color coded according to percent EI cluster identity). Neurons in clusters 1 and 2 are easily distinguishable as non-overlapping populations; however, neurons in clusters 3 and 4 appear more mixed with one another. Figure 4C illustrates the percent EI from the superficial layers versus layer 4Cβ for neurons in clusters 3 and 4. When layer 4Cβ is considered, neurons in clusters 3 and 4 also clearly separate from one another. Figure 4 therefore shows that the cluster analysis of the percent EI data identified four distinct groups of layer 5 neurons based on relative input patterns, where the cluster averages are largely representative of the input pattern profiles of each of the clusters’ individual members.
There was an overall trend for most layer 5 neurons to receive relatively strong input from superficial layers (Table 1). Only four neurons in the dataset lacked significant input from the superficial layers (Table 1); all four of these cells were cluster 1 neurons.
There were also differences between clusters based on input from layer 4C. Most notably, neurons in clusters 2 and 3 had complementary inputs from layers 4Cα and 4Cβ respectively. Although neurons in these clusters differed sharply in the relative strength of input from the subdivisions of layer 4C, many also received significant but weaker input from the other layer 4C subdivision (Table 1). Many neurons in clusters 1 and 4 also received significant but weak layer 4C input. There were, however, more neurons in cluster 4 that lacked significant input from either subdivision of layer 4C (5 of 14 versus 1 of 26 cells).
Input Patterns and Cell Types
Because we had little representation of projecting pyramidal neurons in our dataset, we could not completely assess whether there were correlations between the four laminar input patterns as measured based on relative input strength and the morphological cell types within layer 5. Nevertheless we determined that there were pyramidal, inhibitory and unknown cells in each of the four clusters (Table 1). Interestingly, the distribution of pyramidal and inhibitory neurons was not uniform across clusters. In cluster 4, the largest group with 14 neurons, 11 of 14 cells were pyramidal (all non-projecting) and only 2 of 14 were inhibitory, while in cluster 1, only 3 of 8 cells were pyramidal (all non-projecting) and 3 of 8 were inhibitory.
Discussion
Summary
Fundamental to our understanding of cortical function is an understanding of neuronal circuits on a fine scale, specifically at the levels of laminar, columnar and cellular organization. One of the standing questions in V1 circuitry involves the role of layer 5 neurons in the local functional architecture. Specifically, are these neurons principally involved in feedback to the superficial layers, or do these cells play alternative roles in local processing? We sought to address this question by determining the local circuits of a sampling of layer 5 neurons. We found that the excitatory input circuits involving layer 5 neurons represent a novel organization within primate V1. Additionally, the measured input patterns suggest that many layer 5 neurons are involved in feedback to the superficial layers while other cells partake of alternate cortical circuits.
Significant Laminar Inputs and Cell Type Specificity
We observed that most layer 5 neurons, regardless of cell type, receive significant input from all cortical layers — a novel finding in monkey V1. Previous studies using photostimulation to examine local input sources to individual neurons in monkey V1 have revealed different types of organization. Typically, systematic differences in significant laminar input have been correlated with differences in the cell type receiving those inputs (Sawatari and Callaway, 2000; Briggs and Callaway, 2001; Yabuta et al., 2001). For cells in layers 4B and 6 of V1, cells of the same type receive similar input patterns that consist of significant inputs from only a subset of cortical layers (Briggs and Callaway, 2001; Yabuta et al., 2001). Alternately, layer 3B pyramids of the same anatomical type have highly divergent, selective patterns of significant laminar inputs (Sawatari and Callaway, 2000). In layer 5, neurons of various morphological types sample input ubiquitously, from all of the cortical layers. However, inputs from the various layers are not equal in strength. Based on strength of inputs, four patterns of laminar input emerge, yet these input patterns do not correlate precisely with the morphological cell types within layer 5. This combination of effects constitutes a novel laminar organization within primate V1 and suggests that layer 5 neurons are unique in that they sample inputs from across the cortical layers.
It is clear that within the layer 5 population, neurons of the same anatomically defined cell type often received distinctly different patterns of local input. Furthermore, each cluster emerging from our analyses contained both excitatory and inhibitory cells. We cannot ascertain, however, whether the inputs to layer 5 neurons lacked any cell-type specificity. This is primarily because one of the cell types within layer 5, the projecting pyramidal neurons (including Meynert cells), was not well represented. Meynert cells make up an extremely small percentage, <0.5%; 25 per mm2 (Winfield et al., 1981), of the total number of cells in layer 5, ~11 000 neurons per mm2 (Beaulieu et al., 1992). With a more extensive sample of the rarer cell types (i.e. projecting neurons, Meynert cells, a greater variety of inhibitory cell types), one might be able to say more about cell type specificity of input patterns. Indeed, the fact that a very high proportion of the neurons within cluster 4 were non-projecting pyramidal neurons suggests the possibility of some cell type bias within that cluster. (Such a conclusion would fit with a role for cluster 4 neurons in providing superficial layer feedback. See below.) Thus, cell type specificity of input to layer 5 neurons was not fully tested. However, if any specificity were to exist, it could not be a strict specificity; there was at the minimum a mixing of non-projecting and inhibitory neurons within each cluster and all four input patterns were represented across both of these cell types.
Functional Implications of Laminar Input Patterns
The majority of neurons in the dataset (25 of 40 cells, all in clusters 3 and 4) were characterized by strong superficial layer input, suggesting that these cells could mediate local feedback circuits with the superficial layers, as predicted based on initial anatomical observations (Callaway, 1998a). Of the cells with the strongest superficial layer input relative to other laminar inputs (cluster 4 neurons), the majority were non-projecting pyramids (11 of 14). Given that the majority of cluster 4 neurons made prominent anatomical projections to the superficial layers, these neurons are good candidates for providing feedback to the superficial layers. However, since Cluster 4 neurons were typically characterized by statistically significant input (albeit sometimes weak) from many cortical layers, their feedback to the superficial layers is likely to be influenced by inputs from other cortical layers as well.
A smaller proportion of the neurons in our dataset received their strongest laminar inputs not from the superficial layers, but from the deeper layers (neurons in clusters 1 and 2). Because these cells received such robust deep layer input, they could be less selective about which layer 5 cells they receive input from. Neurons receiving strong deep layer input could therefore provide a more global feedback signal to the superficial layers.
Some of the neurons received differing inputs from the subdivisions of layer 4C (cluster 3 neurons received strong layer 4Cβ input, cluster 2 neurons received strong layer 4Cα input). These input patterns suggest distinct functional relationships of neurons in clusters 2 and 3 to the magnocellular and parvocellular pathways respectively (Merigan and Maunsell, 1993; Callaway, 1998a). Neurons in cluster 2 may have specific relationships with superficial neurons located within blob regions. Blobs are more strongly influenced than interblobs by the magnocellular pathway via layer 4Cα (Lachica et al., 1992; Yabuta and Callaway, 1998b; Sawatari and Callaway, 2000). Furthermore, although anatomical studies reveal little blob/ interblob-specificity of anatomical projections from layer 5 cells (Lachica et al., 1992; Yoshioka et al., 1994; Callaway and Wiser, 1996), neurons within blobs receive more excitatory functional layer 5 input than interblob neurons (Sawatari and Callaway, 2000). The layer 5 input preferentially targeting blob cells could arise from cluster 2 neurons which sample outputs from the same layer 4Cα neurons that connect to blobs in the superficial layers (Yabuta and Callaway, 1998b). Thus, cluster 2 neurons could play an important role in preserving a magnocellular stream bias within the blobs throughout the various stages of local circuitry within V1.
Cluster 2 neurons could also underlie a magno-dominated, alternate feedforward information pathway to higher extrastriate areas involving the pulvinar nucleus of the thalamus (Guillery and Sherman, 2002). Projecting neurons in layer 5 target the pulvinar and/or superior colliculus (Lund et al., 1975) and these connections have ultrastructural characteristics of driving synapses (Rockland, 1994, 1996; Crick and Koch, 1998). Schiller et al. (1979) observed that visually driven collicular activity relied on magnocellular input to V1, but not parvocellular input. Taken together, these results suggest that a pathway utilizing layer 5 and the pulvinar/superior colliculus is dependent on the magnocellular pathway. The neurons in cluster 2 are therefore likely candidates for participating in such a pathway because they sample magnocellular input directly from layer 4Cα and also get input from layers 5 and 6. We therefore suggest that layer 5 projecting pyramidal neurons (possibly including Meynert cells) might receive the cluster 2 input pattern and receive their layer 5 input preferentially from other cluster 2 neurons.
Cluster 3 neurons sample parvocellular stream-specific inputs to the superficial layers by receiving a copy of this information via axon collaterals of layer 4Cβ cells. They also receive strong superficial layer input which could reflect a copy of the output of V1. By sampling both the inputs to and outputs from superficial layer neurons, cluster 3 neurons may play an important role in providing parvocellular stream-biased information to neurons responsible for conveying information to higher visual cortical areas.
The four different laminar input patterns observed in this study suggest that each pattern may correspond to a different role in visual information processing. However, strong input from other layers in addition to the superficial layers suggests that layer 5 cells may contribute to a variety of local circuits within V1.
Footnotes
Notes
We thank Dr Greg Horwitz for helpful discussion and Sandra Tye RVT for assistance with animals. This work was supported by National Institutes of Health Grants EY10742 and MH63912, National Institutes of Health Training Grant AG00216 (F.B.) and the Chapman Charitable Trust (F.B.).
References
- Beaulieu C, Kisvarday Z, Somogyi P, Cynader M, Cowey A. Quantitative distribution of GABA-immunopositive and -immunonegative neurons and synapses in the monkey striate cortex (area 17) Cereb Cortex. 1992;2:295–309. doi: 10.1093/cercor/2.4.295. [DOI] [PubMed] [Google Scholar]
- Blasdel GG, Lund JS. Termination of afferent axons in macaque striate cortex. J Neurosci. 1983;3:1389–1413. doi: 10.1523/JNEUROSCI.03-07-01389.1983. [DOI] [PMC free article] [PubMed] [Google Scholar]
- Blasdel GG, Lund JS, Fitzpatrick D. Intrinsic connections of macaque striate cortex: axonal projections of cells outside lamina 4C. J Neurosci. 1985;5:3350–3369. doi: 10.1523/JNEUROSCI.05-12-03350.1985. [DOI] [PMC free article] [PubMed] [Google Scholar]
- Briggs F, Callaway EM. Layer-specific input to distinct cell types in layer 6 of monkey primary visual cortex. J Neurosci. 2001;21:3600–3608. doi: 10.1523/JNEUROSCI.21-10-03600.2001. [DOI] [PMC free article] [PubMed] [Google Scholar]
- Callaway EM. Local circuits in primary visual cortex of the macaque monkey. Annu Rev Neurosci. 1998a;21:47–74. doi: 10.1146/annurev.neuro.21.1.47. [DOI] [PubMed] [Google Scholar]
- Callaway EM. Prenatal development of layer-specific local circuits in primary visual cortex of the macaque monkey. J Neurosci. 1998b;18:1505–1527. doi: 10.1523/JNEUROSCI.18-04-01505.1998. [DOI] [PMC free article] [PubMed] [Google Scholar]
- Callaway EM, Katz LC. Photostimulation using caged glutamate reveals functional circuitry in living brain slices. Proc Natl Acad Sci USA. 1993;90:7661–7665. doi: 10.1073/pnas.90.16.7661. [DOI] [PMC free article] [PubMed] [Google Scholar]
- Callaway EM, Wiser AK. Contributions of individual layer 2–5 spiny neurons to local circuits in macaque primary visual cortex. Vis Neurosci. 1996;13:907–922. doi: 10.1017/s0952523800009159. [DOI] [PubMed] [Google Scholar]
- Casagrande VA, Kaas JH. The afferent, intrinsic, and efferent connections of primary visual cortex in primates. In: Peters AJE, Rockland KS, editors. The cerebral cortex. New York: Plenum Press; 1994. pp. 201–249. [Google Scholar]
- Cauli B, Porter JT, Tsuzuki K, Lambolez B, Rossier J, Quenet B, Audinat E. Classification of fusiform neocortical interneurons based on unsupervised clustering. Proc Natl Acad Sci USA. 2000;97:6144–6149. doi: 10.1073/pnas.97.11.6144. [DOI] [PMC free article] [PubMed] [Google Scholar]
- Crick F, Koch C. Constraints on cortical and thalamic projections: the no-strong-loops hypothesis. Nature. 1998;391:245–250. doi: 10.1038/34584. [DOI] [PubMed] [Google Scholar]
- Dantzker JL, Callaway EM. Laminar sources of synaptic input to cortical inhibitory interneurons and pyramidal neurons. Nat Neurosci. 2000;3:701–707. doi: 10.1038/76656. [DOI] [PubMed] [Google Scholar]
- Felleman DJ, Van Essen DC. Distributed hierarchical processing in the primate cerebral cortex. Cereb Cortex. 1991;1:1–47. doi: 10.1093/cercor/1.1.1-a. [DOI] [PubMed] [Google Scholar]
- Fitzpatrick D, Lund JS, Blasdel GG. Intrinsic connections of macaque striate cortex: afferent and efferent connections of lamina 4C. J Neurosci. 1985;5:3329–3349. doi: 10.1523/JNEUROSCI.05-12-03329.1985. [DOI] [PMC free article] [PubMed] [Google Scholar]
- Guillery RW, Sherman SM. Thalamic relay functions and their role in corticocortical communication: generalization from the visual system. Neuron. 2002;33:163–175. doi: 10.1016/s0896-6273(01)00582-7. [DOI] [PubMed] [Google Scholar]
- Hassler R. Comparative anatomy of the central visual systems in day- and night-active primates. In: Hassler R, Stephen S, editors. Evolution of the forebrain. Stuttgart: Thieme; 1967. pp. 419–434. [Google Scholar]
- Hendrickson AE, Wilson JR, Ogren MP. The neuroanatomical organization of pathways between the dorsal lateral geniculate nucleus and visual cortex in the old world and new world primates. J Comp Neurol. 1978;182:123–136. doi: 10.1002/cne.901820108. [DOI] [PubMed] [Google Scholar]
- Hubel DH, Wiesel TN. Laminar and columnar distribution of geniculo-cortical fibers in the macaque monkey. J Comp Neurol. 1972;146:421–450. doi: 10.1002/cne.901460402. [DOI] [PubMed] [Google Scholar]
- Katz LC, Dalva MB. Scanning laser photostimulation: a new approach for analyzing brain circuits. J Neurosci Methods. 1994;54:205–218. doi: 10.1016/0165-0270(94)90194-5. [DOI] [PubMed] [Google Scholar]
- Lachica EA, Beck PD, Casagrande VA. Parallel pathways in macaque monkey striate cortex: anatomically defined columns in layer 3. Proc Natl Acad Sci USA. 1992;89:3566–3570. doi: 10.1073/pnas.89.8.3566. [DOI] [PMC free article] [PubMed] [Google Scholar]
- Livingstone M, Hubel D. Specificity of cortico-cortical connections in monkey visual system. Nature. 1983;304:531–534. doi: 10.1038/304531a0. [DOI] [PubMed] [Google Scholar]
- Livingstone MS, Hubel DH. Anatomy and physiology of a color system in the primate visual cortex. J Neurosci. 1984;4:309–356. doi: 10.1523/JNEUROSCI.04-01-00309.1984. [DOI] [PMC free article] [PubMed] [Google Scholar]
- Lund JS. Organization of neurons in the visual cortex, area 17, of the monkey (Macaca mulatta) J Comp Neurol. 1973;147:455–496. doi: 10.1002/cne.901470404. [DOI] [PubMed] [Google Scholar]
- Lund JS. Local circuit neurons of macaque monkey striate cortex: I. neurons of laminae 4C and 5A. J Comp Neurol. 1987;257:60–92. doi: 10.1002/cne.902570106. [DOI] [PubMed] [Google Scholar]
- Lund JS, Boothe RG. Interlaminar connections and pyramidal neuron organization in the visual cortex, area 17, of the macaque monkey. J Comp Neurol. 1975;159:305–334. [Google Scholar]
- Lund JS, Lund RD, Hendrickson AE, Bunt AH, Fuchs AF. The origin of efferent pathways from the primary visual cortex, area 17, of the macaque monkey as shown by retrograde transport of horseradish peroxidase. J Comp Neurol. 1975;164:287–303. doi: 10.1002/cne.901640303. [DOI] [PubMed] [Google Scholar]
- Lund JS, Hawken MJ, Parker AJ. Local circuit neurons of macaque monkey striate cortex: II. neurons of laminae 5B and 6. J Comp Neurol. 1988;276:1–29. doi: 10.1002/cne.902760102. [DOI] [PubMed] [Google Scholar]
- Merigan W, Maunsell J. How parallel are the primate visual pathways. Annu Rev Neurosci. 1993;16:369–402. doi: 10.1146/annurev.ne.16.030193.002101. [DOI] [PubMed] [Google Scholar]
- Rockland KS. Further evidence for two types of corticopulvinar neurons. Neuroreports. 1994;5:1865–1868. doi: 10.1097/00001756-199410000-00006. [DOI] [PubMed] [Google Scholar]
- Rockland KS. Two types of corticopulvinar terminations: round (type 2) and elongate (type 1) J Comp Neurol. 1996;368:57–87. doi: 10.1002/(SICI)1096-9861(19960422)368:1<57::AID-CNE5>3.0.CO;2-J. [DOI] [PubMed] [Google Scholar]
- Rockland KS, Knutson T. Axon collaterals of meynert cells diverge over large portions of area V1 in the macaque monkey. J Comp Neurol. 2001;441:134–147. doi: 10.1002/cne.1402. [DOI] [PubMed] [Google Scholar]
- Roerig B, Kao JPY. Organization of intracortical circuits in relation to direction preference maps in ferret visual cortex. J Neurosci. 1999;19 doi: 10.1523/JNEUROSCI.19-24-j0002.1999. RC44 1 of 5. [DOI] [PMC free article] [PubMed] [Google Scholar]
- Sawatari A, Callaway EM. Convergence of magno- and parvocellular pathways in layer 4B of macaque primary visual cortex. Nature. 1996;380:442–446. doi: 10.1038/380442a0. [DOI] [PubMed] [Google Scholar]
- Sawatari A, Callaway EM. Diversity and cell type specificity of local excitatory connections to neurons in layer 3B of monkey primary visual cortex. Neuron. 2000;25:459–471. doi: 10.1016/s0896-6273(00)80908-3. [DOI] [PubMed] [Google Scholar]
- Schiller PH, Malpeli JG, Schein SJ. Composition of geniculostriate input to superior colliculus of the rhesus monkey. J Neurophysiol. 1979;42:1124–1133. doi: 10.1152/jn.1979.42.4.1124. [DOI] [PubMed] [Google Scholar]
- Schubert D, Kotter R, Zilles K, Luhmann HJ, Staiger JF. Cell type-specific circuits of cortical layer 4 spiny neurons. J Neurosci. 2003;23:2961–2970. doi: 10.1523/JNEUROSCI.23-07-02961.2003. [DOI] [PMC free article] [PubMed] [Google Scholar]
- Schubert D, Staiger JF, Cho N, Kotter R, Zilles K, Luhmann HJ. Layer-specific intracolumnar and transcolumnar functional connectivity of layer 5 pyramidal cells in rat barrel cortex. J Neurosci. 2001;21:3580–3592. doi: 10.1523/JNEUROSCI.21-10-03580.2001. [DOI] [PMC free article] [PubMed] [Google Scholar]
- Shepherd GM, Pologruto TA, Svoboda K. Circuit analysis of experience-dependent plasticity in the developing rat barrel cortex. Neuron. 2003;38:277–289. doi: 10.1016/s0896-6273(03)00152-1. [DOI] [PubMed] [Google Scholar]
- Sincich LC, Horton JC. Divided by cytochrome oxidase: a map of the projections from V1 to V2 in macaques. Science. 2002;295:1734–1737. doi: 10.1126/science.1067902. [DOI] [PubMed] [Google Scholar]
- Thorndike RL. Who belongs in the family? Psychometrika. 1953;18:267–276. [Google Scholar]
- Valverde F. The organizing principles of the primary visual cortex in the monkey. In: Peters AJE, editor. The cerebral cortex. New York: Plenum Press; 1985. pp. 207–257. [Google Scholar]
- Van Essen DC. Functional organization of primate visual cortex. In: Peters AJE, Jones EG, editors. The cerebral cortex, visual cortex edition. New York: Plenum Press; pp. 259–329. [Google Scholar]
- Wehr M, Zador AM. Balanced inhibition underlies tuning and sharpens spike timing in auditory cortex. Nature. 2003;426:442–446. doi: 10.1038/nature02116. [DOI] [PubMed] [Google Scholar]
- Winfield DA, Rivera-Dominguez M, Powell TP. The number and distribution of Meynert cells in area 17 of the macaque monkey. Proc R Soc Lond B Biol Sci. 1981;213:27–40. doi: 10.1098/rspb.1981.0051. [DOI] [PubMed] [Google Scholar]
- Wiser AK, Callaway EM. Contributions of individual layer 6 pyramidal neurons to local circuitry in macaque primary visual cortex. J Neurosci. 1996;16:2724–2739. doi: 10.1523/JNEUROSCI.16-08-02724.1996. [DOI] [PMC free article] [PubMed] [Google Scholar]
- Yabuta NH, Callaway EM. Cytochrome-oxidase blobs and intrinsic horizontal connections of layer 2/3 pyramidal neurons in primate V1. Vis Neurosci. 1998a;15:1007–1027. doi: 10.1017/s0952523898156018. [DOI] [PubMed] [Google Scholar]
- Yabuta NH, Callaway EM. Functional streams and local connections of layer 4C neurons in primary visual cortex of the macaque monkey. J Neurosci. 1998b;18:9489–9499. doi: 10.1523/JNEUROSCI.18-22-09489.1998. [DOI] [PMC free article] [PubMed] [Google Scholar]
- Yabuta NH, Sawatari A, Callaway EM. Two functional channels from primary visual cortex to dorsal visual cortical areas. Science. 2001;292:297–300. doi: 10.1126/science.1057916. [DOI] [PubMed] [Google Scholar]
- Yoshioka T, Levitt JB, Lund JS. Independence and merger of thalamocortical channels within macaque monkey primary visual cortex: anatomy of interlaminar projections. Visual Neurosci. 1994;11:467–489. doi: 10.1017/s0952523800002406. [DOI] [PubMed] [Google Scholar]