

Abstract
Neurodegeneration refers to a large clinically and pathologically heterogeneous disease entity associated with slowly progressive neuronal loss in different anatomical and functional systems of the brain. Neurodegenerative diseases often affect cognition, e.g. Alzheimer’s disease (AD), dementia with Lewy bodies and vascular dementia, or different aspects of the motor system, e.g., amyotrophic lateral sclerosis, Parkinson’s disease and ataxic disorders. Owing to increasing knowledge about the mechanisms leading to neurodegeneration, the development of treatments able to modify the neurodegenerative process becomes possible for the first time. Currently, clinical outcome measures are used to assess the efficacy of such treatments. However, most clinical outcome measures have a low test–retest reliability and thus considerable measurement variance. Therefore, large patient populations and long observation times are needed to detect treatment effects. Furthermore, clinical outcome measures cannot distinguish between symptomatic and disease-modifying treatment effects. Therefore, alternative biomarkers including neuroimaging may take on a more important role in this process. Because MR scanners are widely available and allow for non-invasive detection and quantification of changes in brain structure and metabolism, there is increasing interest in the use of MRI/MRS to monitor objectively treatment effects in clinical trials of neurodegenerative diseases. Particularly volumetric MRI has been used to measure atrophy rates in treatment trials of AD because the relationship between atrophic changes and neuron loss is well established and correlates well with clinical measures. More research is needed to determine the value of other MR modalities, i.e. diffusion, perfusion and functional MRI and MR spectroscopy, for clinical trials with neuroprotective drugs.
Keywords: neurodegeneration, outcome measure, magnetic resonance imaging, treatment, volumetry, diffusion tensor imaging, functional magnetic resonance imaging, spectroscopy
INTRODUCTION
Definition and socio-economic impact of neurodegenerative diseases
The term neurodegenerative diseases refers to a large, clinically and pathologically heterogeneous entity which encompasses all neurological disorders leading to dysfunction and finally death of subsets of neurons in specific functional anatomical systems (1). The most common neurodegenerative diseases of the brain are Alzheimer’s disease (AD), Parkinson’s disease (PD), dementia with Lewy bodies, Huntington disease and amyotrophic lateral sclerosis (ALS). Because the definition of neurodegenerative disease used in this review is fairly broad, it also allows for the inclusion of an entity which usually is not considered to be a typical neurodegenerative disease: vascular dementia (VD). VD, particularly the subcortical variant, can clinically mimic more typical neurodegenerative diseases, aggravate them or even co-exist with typical neurodegenerative diseases, e.g. in the form of mixed dementia with AD. Furthermore, while some of the drugs developed for the treatment of typical neurodegenerative diseases can also show beneficial effects in VD or cerebrovascular disease, the co-existence of vascular lesions might reduce treatment efficacy in others. Owing to these characteristics and interactions with typical neurodegenerative diseases, inclusion of VD in this group seems to be justified. Increasing age is the single, most consistent risk factor for the development of neurodegenerative diseases and hence their incidence and socio-economic impact are expected to grow with increasing life expectancy in developed countries. For example, the estimated cost of dementia in the USA currently amounts to over $100 billion per year. However, because the incidence of dementia is expected to double within the next 20 years (2), its cost will then well exceed $380 billion per year.
Development and assessment of treatment efficiency of neuroprotective drugs
Owing to intensive research over the past few years, some of the basic pathomechanisms leading to neurodegeneration are now slowly being revealed; for example, many of these diseases share the phenomenon of protein aggregation, e.g. amyloid plaques in AD, Lewy bodies in PD, polyglutamine aggregates in Huntington disease. However, it is still not clear if those aggregates cause neurodegeneration, are an incidental epiphenomenon or may even be involved in a protective mechanism. Nonetheless, several drugs, which promise to modify the neurodegenerative processes effectively and not only to alleviate their consequences, are now in development (3,4). After the mechanism of action and safety of a new compound have been established in cell cultures and animal systems, its efficacy in humans has to be assessed in clinical trials. This clinical stage of drug development usually has three phases. In Phase I, safety and pharmacokinetics of the drug are established in humans. In Phase II, the efficacy of the treatment is established in small patient samples and information necessary for the planning of Phase III, e.g. determination of appropriate dosages, outcome measures and size of study population and duration of trial, is obtained. Phase III studies are performed for regulatory approval and must always include longitudinal placebo–treatment comparisons. The best method to establish the efficacy of a neuroprotective treatment would be to determine directly the number and function of neurons surviving due to this treatment. However, this is impossible in patients and instead surrogate outcome markers, which are supposed to reflect reliably the number of surviving neurons in a clinically meaningful way, are used. Currently, clinical measures of disease severity, for example, degree of cognitive impairment and disability in AD or muscle strength and forced vital capacity in ALS, are most often used for that purpose. However, while clinical measures unquestionably reflect a very important aspect of disease progression, i.e. impairment of function, they also suffer from limitations. Probably the most important limitation is that clinical outcome measures do usually not allow for a distinction between disease-modifying drug effects and purely symptomatic drug effects, i.e. functional improvement but unchanged disease progress or only if complicated trial designs are employed (5). Moreover, clinical symptoms only become manifest when the amount of neuron loss/dysfunction has reached a certain threshold (usually around 50–70%), i.e. relatively late in the whole disease process. Therefore, clinical outcome measures are not suited to detect disease-modifying actions of a drug in the preclinical stage, i.e. in the phase when an effective treatment would have the most impact. Furthermore, it is also possible that, while a treatment has an immediate effect on the disease process, its effects on the clinical outcome measure only become apparent with a delay and hence it might be wrongly dismissed as ineffective. Another limitation of clinical outcome measures is their poor test–retest reliability. The poor test–retest reliability is mostly due to the fact that clinical outcome measures are influenced not only by the disease process but also by a number of factors that are difficult to control, e.g. the patient’s motivation, presence of other illnesses or adverse events of other drugs, events in the patient’s life and learning effects in neuropsychological tests. Furthermore, many of the clinical scales, e.g. unified Parkinson’s disease rating scale, are based on subjective semi-quantitative assessments of functions resulting in substantial between-rater and between-site variability. All those sources of variance result in considerable between-and within-subject variances that diminish the statistical power to detect a treatment effect and therefore large study populations and long observation periods are needed when clinical outcome measures are used.
Characteristics of an ideal outcome marker
As a consequence of the shortcomings of the clinical outcome markers, there is an increasing need to complement them with objective and quantifiable outcome markers. Ideally, such an outcome measure should fulfill the following criteria:
The relation between the outcome marker and the desired clinical outcome, e.g. prevention of cognitive impairment in AD, should be clearly established.
The outcome measure should be objective and have a high test–retest reliability to allow for assessment of treatment efficacy in a single patient and not only to assess group effects.
The outcome measure should be representative of the stage of the neurodegenerative process at which the drug is supposed to have its maximum effect, e.g. if the drug effect is maximum during the preclinical stage, the outcome measure should reflect the disease process in the preclinical stage.
The outcome marker should be representative of the supposed mechanism of action of the drug, e.g. a measure of amyloid burden if drug is supposed to prevent amyloid accumulation.
Its assessment should be non-invasive and well tolerated.
Its assessment should be inexpensive and not restricted to specialized centers.
Since neuroimaging methods, particularly MRI, fulfill at least some of those criteria (6), their ability to replace clinical outcome measures for the assessment of putative neuroprotective properties of a new drug is increasingly being investigated. Therefore, in the next section of this review an overview about the strengths and shortcomings of the different MR modalities for that purpose will be given. Another section will summarize the results of preliminary studies using MR outcome measures to assess treatment efficacy in four of the most common neurodegenerative diseases, i.e. AD, VD, ALS and PD. Results of studies using nuclear medicine techniques for this purpose will also be briefly summarized. Finally, possible future roles of MR in the development of neuroprotective drugs will be outlined.
STRENGTHS AND LIMITATIONS OF DIFFERENT MR TECHNIQUES FOR THE ASSESSMENT OF TREATMENT EFFECTS
In principle, MR neuroimaging modalities can be divided into two groups: (1) structural techniques, i.e. volumetric MRI and diffusion-weighted (DWI) or diffusion tensor (DTI) MRI; (2) functional techniques, i.e. perfusion MRI, blood oxygenation level-dependent (BOLD) fMRI and MR spectroscopy (MRS).
Volumetric MRI
Currently, volumetric MRI is the method of choice to monitor drug effects in neurodegenerative diseases, especially in Phase II and III registration trials. There are several reasons for this. First, clinical MRI scanners capable of such studies are available at most major hospitals, which facilitates multi-center studies. Second, volumetric MR measures have been found to have very high test–retest reliability (7). Third, and probably the most important, the relationship between neuron loss and volume loss/atrophy in volumetric MRI has been well established in several studies (8–10). Unfortunately, neuron loss and thus atrophic changes are not specific for pathological neurodegenerative processes but are also a feature of normal aging. However, large cross-sectional and longitudinal studies have shown that there are substantial qualitative and quantitative differences in pattern and rate of atrophy allowing to distinguish between those two processes. For example, in normal aging rates of global atrophy typically increase from an annual rate of 0.2% per year at age 30–50 to 0.3–0.5% per year at age 70–80 years and affect frontal and parietal gray matter more than occipital and temporal gray matter whereas changes in white matter are more diffuse (11). In contrast, atrophy rates in neurodegenerative diseases are significantly higher, i.e. up to 2–3% per year (12,13) and affect different structures than in normal aging, e.g. increased atrophy rates of limbic and temporal lobe structures in AD (14,15) (Fig. 1). If the structures typically involved in the disease process are known and anatomically well defined, as is the case, for example, for the hippocampus in AD, region of interest (ROI) analyses can be sufficient to follow volume changes over time. If the affected structures are less well defined or the disease process is more diffuse, computer-based types of analyses, such as tissue segmentation, global boundary shift integral method (16) (Fig. 2), voxel-based morphometry (17) or tensor-based morphometry (18), are better suited to demonstrate volume loss over time. Many of the computer-based approaches have additional advantages. First, they are mostly operator independent and therefore less affected by inter- and intra-observer variability. Second, they allow an unbiased assessment of atrophic changes across the whole brain, so that a priori assumptions of regions of interest are not required. This is important because the structure most affected by the neurodegenerative process can vary depending on the disease stage.
Figure 1.
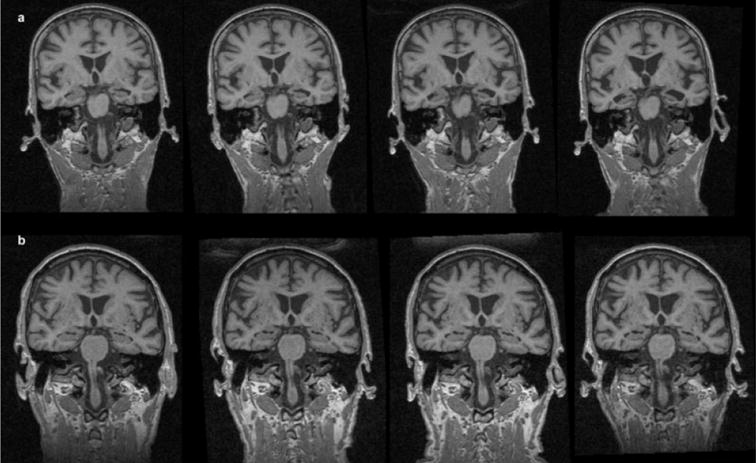
Serial MRI over a period of 2 years (left to right). (a) AD patient, age 67 years, MMSE at the first examination, 25; MMSE at the last examination, 14. Rapid tissue loss in the hippocampal region with enlargement of the lateral ventricles. (b) Healthy elderly control (HC). Mild, generalized tissue loss
Figure 2.
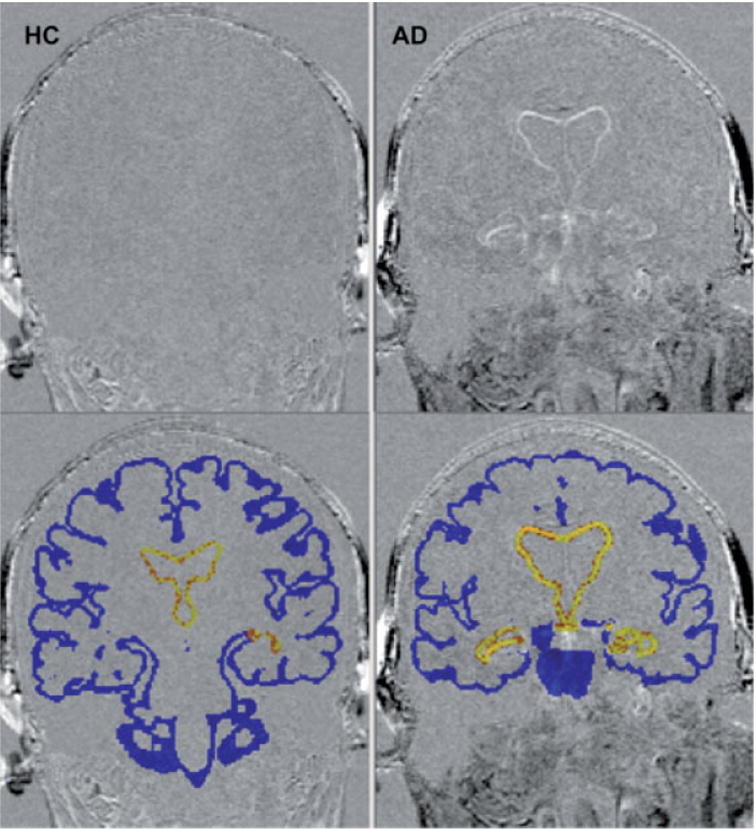
Change in cortical and ventricular volume over a 2-year interval in a healthy elderly control (HC) (left) and an AD patient (right). Higher intensity on subtraction image (top) shows greater degree of tissue loss over 2-year interval. Blue shading (bottom) shows the region within which cortical BSI is measured; yellow shading shows the region within which ventricular BSI is measured. Images courtesy of Mr Frank Ezekiel, MR Unit, VA Medical Center, San Francisco
DWI and DTI
DWI and DTI allow one to study the random motion (diffusion) of water in brain tissue. If unconstrained, the random motion of water is equally probable along any direction and therefore isotropic. However, in tissues, the random motion of water is hindered by the physical boundaries of the three-dimensional tissue microstructure and therefore occurs preferentially perpendicular to those boundaries and becomes anisotropic. These properties make DWI ideally suited to detect the effects of acute ischemia and DWI/DTI to detect neurological diseases affecting the integrity of highly structured tissues such as white matter, e.g. multiple sclerosis. However, as DWI and DTI are both relatively new MR modalities for clinical applications, their value for the diagnosis of other neurodegenerative diseases and their potential role in monitoring of treatment effects need first to be established. Therefore, DWI and DTI currently do not play a role in Phase III trials. However, it is possible that a role for these methods may be found in early Phase II studies.
Perfusion MRI
The molecular processes leading to neurodegeneration are probably active and thus impairing neuronal function years or even decades before the neurons actually start to die and result in atrophic changes detectable by MRI. In this presymptomatic stage, successful therapeutic interventions would have the greatest impact, as the functions could be preserved on the highest level possible. However, it would also be very difficult to prove a neuroprotective effect in this stage. Neuronal function is tightly coupled to neuronal energy metabolism, which again—at least under normal circumstances—is tightly coupled to brain perfusion. Therefore, MR perfusion might be used to detect the neuronal dysfunction typically associated with early stages of neurodegeneration (Fig. 3). In MR perfusion studies, endogenous water molecules are ‘magnetically tagged’ in arteries providing the blood flow to the brain. These tagged water molecules then diffuse across the blood–brain-barrier into the brain and alter the local magnetization state of the brain tissue in proportion to the inflow of saturated protons (19). Until now, [18F]fluorodeoxyglucose or [15O]H2O PET and 99mTc hexamethylpropylenamine oxime SPECT studies have been mostly used to measure perfusion/energy metabolism. However, PET and SPECT are more expensive than MR examinations (20) and restricted to specialized centers. Furthermore, they are less suited for the serial examinations necessary to prove the efficacy of a therapeutic intervention because they involve exposure to radioactive substances. Therefore, it is possible that particularly for serial perfusion measurements, MR perfusion studies will supplement or even replace PET and SPECT in the future. The potential of perfusion MRI to detect neuronal dysfunction in the early stages of neurodegeneration is intriguing, but it is necessary to be aware that many aspects of brain perfusion are still not fully understood. Therefore, in order to interpret treatment-induced perfusion changes in a meaningful way, a thorough understanding of how perfusion and metabolism are affected by the neurodegenerative process and by the neuroprotective drug will be necessary. In particular, the following issues have to be considered: (1) the assumptions regarding coupling between function and metabolism/perfusion (21) may no longer be valid (22) in disease states; (2) perfusion measurements can be influenced by factors unrelated to the neurodegenerative process, e.g. a concomitant small or large vessel disease or the ability of the subject to comply with the conditions of a resting state examination; (3) the treatment may exert a positive influence on perfusion/metabolism parameters without actually modifying the neurodegenerative process; (4) test–retest reliability of MR perfusion studies has to be rigorously established. However, provided that these issues can be addressed, perfusion MRI may have in the future a role in early Phase II studies, to determine whether treatment provides some sort of ‘signal’ of beneficial action.
Figure 3.
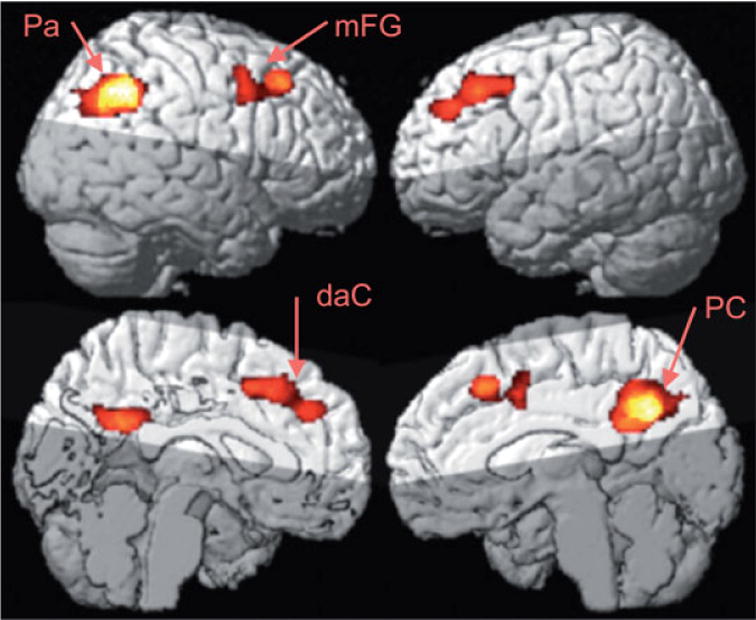
Group mean effect of hypoperfusion in AD versus cognitive normal elderly measured by ASL-MRI at cluster level p < 0.05. Pa, parietal lobe (angular gyrus); PC, posterior cingulate; mFG, medial frontal gyrus; daC, dorsal anterior cingulate area. Images courtesy of Drs Nathan Johnson and Norbert Schuff, MR Unit, VA Medical Center, San Francisco
BOLD fMRI
Because of its non-invasive nature, its good spatial and temporal resolution and its wide availability, fMRI using BOLD contrast has become the method of choice for the imaging of neuronal activity. The BOLD signal results from a change in the oxy-/deoxyhemoglobin ratio during neuronal activity (19). Currently, fMRI activation studies are mostly employed to gain a better understanding of the neuronal networks involved in specific tasks in the healthy human brain. Only a minority of them addresses the question of how these networks are altered in the diseased brain. In addition, activation fMRI studies depend heavily on task performance and generally have a low test–retest reliability (23). These limitations make them less suited for the longitudinal studies needed to detect effects of potentially neuroprotective treatments. Recent reports suggested that resting state fMRI might be used in much the same way as PET and SPECT studies to detect early neuronal dysfunction in neurodegenerative diseases (24). However, this method shows a large degree of variance in the detected signal, which makes single subject observations difficult. Furthermore, the same issues outlined above for perfusion MRI would also need to be addressed before using resting state fMRI studies for drug trials. Taken together, similarly to perfusion MRI, in the future BOLD fMRI may eventually have a role in Phase II studies.
MR-spectroscopy (MRS)
MRS allows for the non-invasive measurement of different markers of neuronal and glial metabolism and function. Depending on the nucleus, different metabolic aspects can be assessed, but because of its wide availability on clinical systems, 1H MRS is most commonly used. The most prominent peak of the 1H spectrum belongs to N-acetylaspartate (NAA). Because under normal conditions NAA is exclusively synthesized in the mitochondria of neurons (25), it is considered to be a marker of neuronal density and integrity. Other peaks in the 1H spectrum belong to creatine/phosphocreatine (Cr), markers for energy metabolism, and to choline-containing compounds (Cho), which are markers for cell membrane metabolism. With shorter echo times around 10–35 ms, the peaks of the glutamate–glutamine complex and of myo-inositol become visible. Owing to its properties, NAA seems particularly suited to detect neurodegenerative processes even at early stages and therefore could theoretically be used to monitor effects of a neuroprotective treatment (26). Measurements of NAA, Cr, etc., are possible on most clinical MR systems. However, in addition, the use of more demanding techniques such as high-field systems (3–7 T) and/or special spectroscopic editing sequences might also allow the study of the influence of the treatment on other metabolites thought to play a role in neurodegeneration, e.g. glutamate, which plays a major role in forms of neurodegeneration mediated by excitotoxicity or of glutathione an endogenous antioxidant (27). However, NAA, Cr, glutamate, etc., are all part of complex metabolic processes, which can be influenced at many levels. Therefore, in order to interpret treatment-induced changes correctly, it is necessary to establish first that they indeed reflect a modification of the neurodegenerative process and not simply an unspecific interaction of the drug with the metabolism of those markers. Furthermore, the test–retest reliability of such spectroscopic measurements has to be tested rigorously to ascertain that the detected changes indeed reflect treatment effects. Finally, it has to be assumed that the brain region most affected by the neurodegenerative process varies depending on the disease stage. To account for this, MRS acquisition and post-processing techniques covering the whole brain and accounting for different metabolite concentrations due to different brain regions and tissue composition would have to be employed. Taken together, MRS may have a role in Phase II studies.
Summary
Because of the well-documented relationship between neuronal loss and atrophy, volumetric MRI is currently the most robust MR biomarker for the detection of disease-modifying effects of putatively neuroprotective drugs. Further research is needed to decide the potential applications of DWI/DTI for monitoring treatment effects. However, because atrophy occurs rather late in the neurodegenerative process, MRI volumetry will probably not detect treatment effects in very early, preclinical stages of the disease. Functional MR modalities sensitive to neuronal dysfunction preceding the actual neurodegeneration might be better suited for this purpose. Under the assumption of a thorough understanding of the interactions of the neuroprotective drug with the different metabolic pathways, MRS seems the most promising functional MR modality because it has some advantages compared with perfusion MRI or resting BOLD fMRI. First, MRS has a rather low temporal resolution. Therefore, it is probably better suited to detect reliably functional changes occurring over the time range of days or weeks than techniques with a high temporal resolution such as resting BOLD fMRI or perfusion MRI. Second, in addition to the measurement of NAA as a marker of neuronal survival, MRS also allows one to assess the influence of the drug on some other important neurotoxic and neuroprotective compounds.
POTENTIAL MR OUTCOME MEASURES FOR DIFFERENT NEURODEGENERATIVE DISEASES
Dementia
The clinical hallmark of demential neurodegenerative diseases is the progressive impairment of intellectual functions. With a prevalence of 15–21% in the population aged over 75 years (28), dementias are the most common neurodegenerative diseases. By far the most frequent form of dementia is Alzheimer’s disease (AD), while other forms, e.g. vascular dementia (VD), Lewy body disease, frontotemporal lobe dementia and HIV-associated dementia, are less frequent. Because accurate clinical definition and identification of neuroimaging characteristics of other forms of dementia are still being developed and the number of clinical trials is limited (29,30), this review will concentrate on AD and VD.
Alzheimer’s disease
Because of its high incidence rate (5.9–10.8 cases per 1000 above the age of 75 years), most efforts to find an effective treatment for dementia have focused on AD. Consequently, there are already a number of drugs either approved or currently evaluated for the treatment of AD. Generally, two large treatment groups can be distinguished. (1) Symptomatic drugs are drugs that do not actually modify the neurodegenerative process but improve cognitive functions. This group includes cholinesterase inhibitors such as donepezil, antioxidants such as α-tocopherol and drugs supposed to stimulate neuronal growth factors such as propentophylline. Until now, the majority of clinical trials have focused on cholinesterase inhibitors. (2) The second group is drugs that actually try to modify specific pathological processes in AD, e.g. drugs to reduce the amyloid plaque deposition, i.e. β- or γ-secretase inhibitors, or vaccines against β-amyloid plaques [a detailed discussion about all the treatment modalities currently evaluated is beyond the scope of this review; more detailed review articles on this topic should be consulted (4,31,32)]. Until now, of this group, only β-amyloid vaccines have been tested in clinical studies (33,34).
Treatment trials using volumetric MRI in AD
As has been consistently shown by neuropathological studies (35,36), the earliest pathological manifestations of AD, i.e. neuron loss and accumulation of neurofibrillary tangles and β-amyloid, are found in the perirhinal/entorhinal cortex and hippocampus. Volumetric MRI is able to detect the volume loss in the hippocampus and entorhinal cortex not only in subjects suffering from probable AD but also in those with mild cognitive impairment (MCI) (37–42). MCI subjects, while not yet fulfilling the criteria for dementia, show below average performance for age and education in one or more cognitive domains. Depending on which cognitive domain is most affected, different subtypes of MCI are distinguished. It has been shown that subjects who are primarily impaired in the memory domain (‘amnestic MCI’) have a significantly higher risk of developing AD [yearly decline to AD 10–15% (43)] than subjects with normal memory. Therefore, amnestic MCI is often considered as the clinical manifestation of incipient AD. Longitudinal volumetric MR studies have shown that the atrophy rates of hippocampus and entorhinal cortex but also of other brain structures, e.g. ventricle size, whole brain volume, cortical volume and cingulate gyrus (15,44–48), are good predictors for conversion from healthy controls to MCI or from MCI to AD (Fig. 4). Power calculations have shown that owing to their high test–retest reliability, such volumetric measurements would allow one to reduce substantially the sample size required to detect drug effects in a clinical study (49,50). Moreover, the fact that computer-based methods to determine atrophy rates of larger structures, e.g. whole brain atrophy rate, have been found to be more reliable than manual tracings of smaller structures, e.g. hippocampus (51), would allow one to use volumetric measures even in the busy daily clinical routine. Until now, only three studies have used MR volumetric outcome markers to assess the treatment efficacy in AD. The first was conducted by Jack et al. (52), who used serial MRI measurements of the hippocampal volume and the temporal horn volumes to monitor the effects of milameline in a multi-center trial. After an interim analysis showed no treatment effect of milameline, the therapeutic trial was terminated early. However, the MRI arm of the trial was continued and 192 patients (active drug, 100; placebo, 92) with probable AD had a baseline MRI and a follow-up MRI 12 months later. MRI measurements obtained across sites showed high consistency and thus demonstrated that structural MRI measures can be successfully used as a marker of disease progression in multi-site treatment trial. In another clinical trial, Fox et al. (34) used MRI to monitor the treatment effects over 12 months in a double-blind placebo-controlled amyloid β-immunotherapy trial in 372 patients with probable AD. Whereas the treatment part of the study was terminated prematurely because of reports of meningoencephalitis, the MRI follow-up was continued. The results of this study were surprising because responders, i.e. patients with the expected immune response and cognitive improvement, had a greater ventricular enlargement than patients without treatment response. The significance of this finding is unclear. Larger patient groups need to be followed for longer periods to determine if this is a consistent finding, e.g. due to the removal of the amyloid from the brain or increased cell loss, or only a temporary phenomenon due an hitherto unknown side-effect of the drug. Krishnan et al. (53) studied the effect of donepezil on the hippocampal volume; 67 patients with mild to moderate AD were treated over 24 weeks with donepezil (n = 33, six discontinued) or placebo (n = 34, 10 discontinued) and underwent cognitive and MR assessments every 6 weeks. Despite the fact that this study was not powered to detect small treatment effects, hippocampal volumes decreased significantly less (−0.4%) in the treatment group than in the placebo group (−8.2%).
Figure 4.
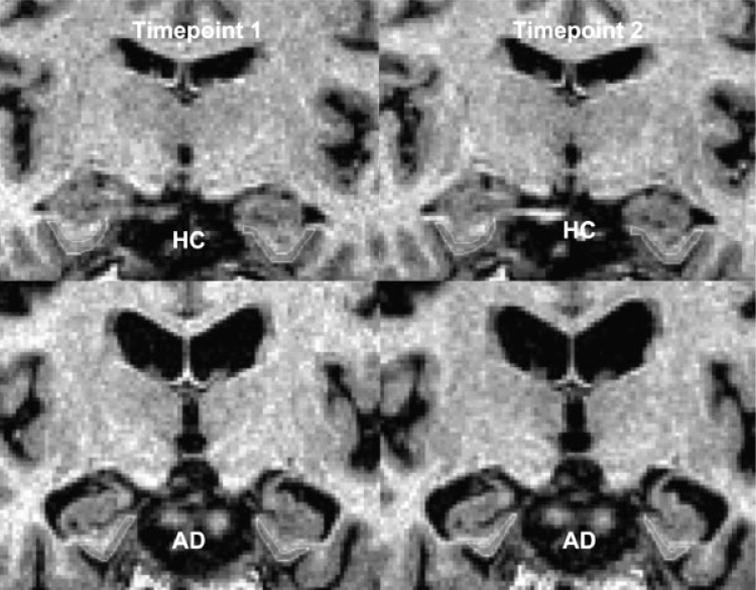
Measurement of the entorhinal cortex over 2.2 years in a cognitively normal subject (HC) and an AD patient. Image courtesy of Dr AT Du, MR Unit, VA Medical Center, San Francisco
MRS and fMRI and in AD treatment trials
In the same group of AD patients in whom they found a significant effect of donepezil on the hippocampal atrophy rate, Krishnan et al. (53) also used MRS to measure changes of NAA and myo-inositol in different brain regions. In contrast to the volumetric findings, the spectroscopic findings were less conclusive. In the donepezil group, NAA tended to increase in the first half of the trial but then decreased again to levels not different from baseline. In the placebo group, NAA tended to stay unchanged or even decreased. Myo-inositol showed similar trends to NAA.
Rombouts et al. (54) used BOLD fMRI to study the acute effect of a single dose of rivastigmine on the activation patterns during a face encoding and a working memory task in seven patients with mild AD. Three hours after a single dose of 3 mg of rivastigmine, the brain activation was increased in the fusiform gyrus during the face encoding task and in the frontal lobe during the working memory task compared with the untreated state. Whereas this study concentrated on the acute effects of cholinesterase inhibition, the next study focused on long-term effects and found similar changes. After treatment of nine MCI subjects with donepezil for about 6 weeks, Saykin et al. (55), using BOLD fMRI, found an increased activation predominantly of the dorso-lateral prefrontal cortex during a working memory task.
PET and SPECT in AD treatment trials
PET and SPECT have also been used to assess different aspects of drug treatment in AD. Several studies successfully used 11C-labeled acetylcholine analogues to measure acetylcholinesterase (ACHE) activity in vivo in AD brains before and after treatment with cholin-esterase inhibitors. Compared with healthy controls, cortical ACHE activity is reduced in AD with the most prominent reductions in the hippocampus and parieto-temporal regions (56–58). Treatment with a cholinester-ase inhibitor further deceased cortical ACHE activity in AD by 30–40% (59,60). There are also several SPECT and PET studies which studied the effects of choline esterase inhibitors on perfusion and glucose metabolism in AD over various lengths of time (from a few weeks up to 1 year). In contrast to the fMRI studies, which assessed treatment-induced changes of brain activation patterns, these studies measured changes of perfusion and glucose metabolism under resting conditions. Generally, a good correlation between cognitive changes and perfusion/metabolism changes was found, i.e. stabilization or even improvement of perfusion and metabolic abnormalities was paralleled by a slowing of further deterioration or even improvement of cognitive function (61–68). Recently, 11C-labeled compounds which pass the blood–brain barrier and bind with high affinity to fibrillar amyloid plaques have been developed and allow for the first time in vivo quantification of the amyloid burden (69). This will help not only to improve the diagnosis of AD but also to study the effects of various kinds of treatments on one of the histological hallmarks of the disease.
MR in treatment trials of VD
VD is probably the second common form of dementia, with a prevalence of 4–10% of the European and North American autopsy series and 22–35% in Asian autopsy series (70). However, variations in the definition of the clinical syndrome, vascular etiologies, imaging criteria and different subtypes of VD (small-vessel disease vs large-vessel disease), make it difficult to determine its true incidence and prevalence. The fact that other forms of dementia, e.g. AD, can also be associated with significant amounts of vascular lesions contributing to the cognitive impairment results in additional diagnostic and therapeutic problems. Therefore, the identification of reliable diagnostic neuroimaging criteria well correlated with typical cognitive deficits and thus allowing for assessment of treatment effects in VD has been difficult (71). Current treatment strategies consist on the one hand in treating vascular risk factors, e.g. hypertension and hypercholesterolemia. On the other hand, some of the compounds developed for the treatment of AD, e.g. cholinesterase inhibitors, also seem to exert a positive effect on cognition in VD (72). Although not specific for VD (73), cortical gray matter changes have been found to be the most consistent predictor of cognitive decline in VD (74–77). Formal studies to estimate the sample sizes to detect treatment effects in VD using cortical gray matter changes as end-point have not yet been performed. Whereas VD has been the object of several treatment trials (78), the number of studies using neuroimaging methods as outcome measures in VD is relatively small. Broderick et al. (79) studied the effects of a treatment with aspirin alone vs a treatment with aspirin and pentoxyfylline. Of the 105 patients included in this study (diagnosed according to the DMS-III-R criteria for multi-infarct dementia), only 25 had comparable MRI of good quality at baseline and at the completion of the trial. Whereas the ventricular volume and the ischemic volume during the treatment phase increased significantly in all patients independently of the treatment regimen, the neuropsychological test scores did not change. However, it can be safely assumed that the number of subjects in this study was too small to detect any differences between the two treatment arms on the imaging or the neuropsychological measures. Sweet et al. (80) used changes in white matter hyperintensity volume and whole brain volume to assess treatment effects of citicoline in 23 patients with VD (diagnosed according to NINDS-AIREN and DSM-IV criteria). During the treatment trial lasting 12 months (12 placebo, 11 citicoline), the volume of white matter intensities increased and the whole brain volume decreased significantly whereas the cognitive outcome parameters changed only insignificantly in both groups. Again, the number of subjects was too small to detect any differences between the treatment arms.
SPECT and PET in VD treatment trials
There have also been a small number of PET and SPECT studies which assessed the effects of rivastigmine and pentoxyfylline on glucose metabolism and perfusion. Similarly as for AD, an improvement in these parameters was found, which was correlated with a cognitive improvement (81,82).
MR in treatment trials of ALS
ALS is the most common degenerative motor neuron disease [incidence 2 per 100 000 (83)]. Histopathologically, it is characterized by the degeneration of motor neurons in the cortex, brainstem and spinal cord. Clinically it manifests by progressive muscle weakness, muscle wasting and fasciculations and finally leads to death within 3–5 years. The diagnosis of ALS is based on clinical criteria. Currently, there exists no established diagnostic biomarker for this disease. Different neuroimaging modalities have been studied regarding their usefulness for diagnosis and disease progression in ALS. Resting SPECT and PET examinations show hypoperfusion/hypometabolism in the motor cortex, while activation studies have shown abnormal activation patterns. Hyperintensity of the corticospinal tract, sometimes extending into the spinal cord on T2-weighted or FLAIR MRI has been described in ALS. However, these hyperintensities have a low specificity because they also can be found in other neurodegenerative diseases or even in healthy subjects (84–89). Furthermore, the contrast of conventional MR varies depending on the acquisition parameters and in the absence of quantitative relaxation rate determination, the interpretation of these abnormalities depends on the subjective judgment of the rater. Preliminary results suggest that DTI might be superior to detect changes in the corticospinal tracts because it provides quantitative measures of the integrity of fiber tracts (89) and even might detect abnormalities in the absence of clinical symptoms (90). Atrophic changes of the corticospinal tracts and beyond the motor system have also been reported (91,92). Several studies using MRS have shown a good correlation between clinical disease severity and NAA reduction in the motor cortex/corticospinal tract (93–96). While there is a substantial overlap between patients and healthy controls particularly in the early stages, limiting the use of MRS for diagnostic purposes, the NAA reductions become more prominent as the disease progresses (97,98). These findings suggest a role for MRS assessment of disease progression and as an come measure for clinical drug trials. However, until now, no formal studies to determine the sizes necessary to detect treatment effects using NAA or other MRI measures have been performed. Nonetheless, three small studies used changes in AA to assess treatment efficacy in ALS. Kalra et al. (99) studied the effect of riluzole, the only currently available drug with a proven, but modest, effect on disease progression, in 19 patients with probable or definite ALS. In the treatment group (n = 11), there was a significant increase in NAA/Cr compared with baseline values after treatment with riluzole for ~24 days, whereas it decreased significantly in patients without treatment. However, only one patient in the treatment group also improved clinically. The same group (100) used NAA as an outcome measure to assess treatment effects of brain-derived neurotrophic factor (BDNF) in 11 patients with probable or definite ALS (placebo, six; BDNF, five). After 4 weeks of treatment, NAA/Cr was not different in patients treated with BDNF compared with those who received placebo. The lack of change of NAA/Cr correlated with the lack of clinical efficacy. A similar study assessed the efficacy of gabapentin for the treatment of ALS. Eight patients suffering from ALS underwent MRS before and after initiation of treatment with gabapentin for about 4 weeks. At the end of the treatment period NAA/Cr was not different from the NAA/Cr in 10 untreated ALS patients studied with the same protocol (101).
MR in treatment trials of Parkinson’s disease
PD is clinically characterized by the triad of tremor, rigor and bradykinesia but also includes other non-motor features such as autonomic dysfunction and cognitive and psychiatric changes. Histopathologically, it is characterized by the loss of dopaminergic projections from the substantia nigra to the basal ganglia and Lewy bodies in the surviving neurons. Its prevalence in industrialized countries is estimated at about 1% of the population older than 60 years (102). Despite increasing knowledge about the pathways of neurodegeneration in PD in recent years, the exact mechanism leading to neuronal death in this disease is still unclear. Therefore, the treatment of PD has been mainly symptomatic and aimed at alleviating the motor symptoms of the disease. However, in the last few years, neuroprotective treatments such as α-tocopherol, selegiline or coenzyme Q10 have been used in an attempt to slow the disease progress (103). The diagnosis is still based on the clinical findings and a diagnostic marker for this disease is currently not available. At present, the main role of MR in PD is differentiation of PD from other diseases with parkinsonism, e.g. multisystem atrophy, vascular parkinsonism and normal pressure hydrocephalus. Attempts to use volumetric MR measures or nigral changes in T1 or T2*for diagnostic purposes mostly failed, because either they became obvious only in advanced stages of the disease or were not well correlated with the clinical severity (104). However, recent reports suggest that MRI using special inversion–recovery sequences (105) or DTI (106) might be more sensitive to detect neurodegeneration in PD. Further research is needed to establish the value of these techniques in larger patient samples.
PET and SPECT in treatment trials of Parkinson’s disease
PET and SPECT using radioactively labeled dopamine analogues allow one to measure the density of postsynaptic dopaminergic receptors and have been employed not only for diagnostic purposes but also to monitor disease progression in clinical trials. However, nuclear medicine techniques also allow one to assess the function of the presynaptic dopaminergic system by using [18F]Dopa PET to measure Dopa decarboxylase activity, tropane-based tracers to assess the concentration of presynaptic dopamine receptors and [11C]dihydrotetrabenazine to measure vesicle monoamine transporter density. Although these techniques certainly give a unique insight into different aspects of the dopaminergic system, it has to be kept in mind that their use in treatment trials is based on the unproved assumptions that changes in the dopamine receptor/transporter density can be attributed solely to the neurodegenerative process and that a unspecific influence of the neuroprotective treatment on them does not exist. Three large trials have used SPECT/PET in addition to clinical variables as outcome measure. The REAL-PET study used [18F]Dopa PET to monitor change of [18F]Dopa uptake in the putamen in patients suffering from early Parkinson’s disease. During a 2-year treatment period these patients received either ropinirole (dopamine agonist) or levodopa (dopamine precursor). While patients treated with ropinirol showed a significantly better preserved striatal and nigral [18F]Dopa uptake compared with patients treated with levodopa, levodopa treatment showed greater effect on clinical outcome measures (107). Another multi-center study (CALM_PD), which used SPECT and a dopamine transporter ligand to compare the effects of another dopamine agonist pramipexole and levodopa, found the same discrepancy between imaging and clinical outcome measures (108). The possibility that levodopa treatment might actually enhance loss of striatal neurons was further supported by the ELLDOPA study, which compared treatment with levodopa with treatment with placebo and found that striatal loss of tracer binding was greater in patients treated with levodopa (109). In addition, [18F]Dopa has also been used to assess transplant function and survival in small treatment trials using restorative approaches, e.g. transplantation of human or porcine fetal mesencephalic cells, for treatment of Parkinson’s disease (110).
Summary
MR measures fulfill many of the criteria of an ideal outcome marker, i.e. have reasonably good test–retest reliability, are widely available, are non-invasive and, compared with other neuroimaging modalities such as PET, are inexpensive. In addition, several preliminary studies have shown that MR measures have the potential to be used to assess the efficacy of neuroprotective treatments in a variety of neurodegenerative diseases, e.g. AD and ALS. However, in order to establish MR measures as outcome markers for a neurodegenerative disease, the following requirements need to be fulfilled: (1) the relationship between the MR outcome measure and the neurodegenerative process modified by the drug has to be clearly established, which requires rigorous correlations of the MR measures with histopathological studies in patients or in representative animal models; (2) the MR measure has to be well correlated with a clinical measure that is meaningful to the patient, e.g. independent living, memory function or life expectancy; (3) in order to ensure that treatment effects can be detected by the MR measure, adequate patient populations and sample sizes for clinical trials need to be defined. Until now, the only MR measures meeting these requirements are measurements of brain atrophy rate in AD. More research will be necessary to ensure that these requirements are also fulfilled by the other potential MR measures. However, despite the promise of MR techniques for treatment trials, it has also to be acknowledged that at least at the moment there are some questions or some forms of neurodegenerative diseases where nuclear medicine techniques might be superior to MR techniques, e.g. for measurement of amyloid burden in AD or for evaluation of treatment efficacy in neurodegenerative diseases affecting well-defined neurotransmitter systems such as Parkinson’s disease.
FUTURE DIRECTIONS
Driven by the need to find a cure for a disease group with increasing socio-economic impact, the knowledge about genetic and environmental risk factors of the different neurodegenerative diseases is growing. Therefore, in the near future it might be possible that persons with a high risk of developing a certain form of neurodegenerative disease can be identified and eventually also treated long before the neurodegenerative processes actually lead to neuronal death. Hence it will be necessary to develop new MR measures that will be able to detect the very first manifestations of a disease. Potential new measures are, for example, MR tracers for the detection of amyloid deposits, which are currently being developed (111). As it is likely that different genetic subtypes of a neurodegenerative disease will show different responses to the different treatment strategies, it would be helpful to identify MR measures which may predict the response of a treatment in the individual patient so that the treatment with the highest prospect for success can be chosen from the beginning. The combination of different imaging modalities, e.g. volumetric MRI with perfusion MRI or fMRI, or volumetric MRI with SPECT/PET, will not only add to the understanding of the disease processes but also help to interpret treatment effects better. Finally, MR measures might also be helpful to identify patients at risk of developing adverse effects during a treatment, e.g. patients suffering from VD at risk of suffering from micro- or macroscopic bleeding due to a treatment intended to improve cerebrovascular perfusion.
However, developments should not be restricted to improvements of the different MR techniques but should also be aimed at the optimization of current trial designs to take full advantage of the properties that MR measures. Traditional drug trials usually assess drug effects by comparing the disease progression between a treated and an untreated patient group. However, differences between the two groups result not only from treatment effects but also from inter-individual differences of natural disease progression between the two groups. Those inter-individual effects can be reduced by trial designs in which subjects serve as their own controls. Because of their high test–retest reliability, MR measures would allow one to assess the individual natural disease progression over a relatively short drug-free baseline or placebo period (e.g. 6 months), which then can be compared with the individual disease progression during an equally long treatment period.
Acknowledgments
This work was supported by NIH grants R01 AG010897, P01 AA11493 and P01 AG19724.
Abbreviations used
- AD
Alzheimer’s disease
- ACHE
acetyl choline esterase
- ALS
amyotrophic lateral sclerosis
- BDNF
brain derived neurotrophic factor
- BOLD
blood oxygenation level-dependent
- Cho
choline containing compounds
- Cr
creatine, phosphocreatine
- DTI
diffusion tensor imaging
- DWI
diffusion weighted imaging
- FLAIR
fluid attenuated inversion recovery
- fMRI
functional magnetic resonance imaging
- MCI
mild cognitive impairment
- MRI
magnetic resonance imaging
- MRS
magnetic resonance spectroscopy
- NAA
N-acetylasparate
- PD
Parkinson’s disease
- PET
positron emission tomography
- ROI
region of interest
- SPECT
single photon emission tomography
- VD
vascular dementia
Footnotes
Contract/grant sponsor: NIH; contract/grant numbers: R01 AG010897, P01 AA11493, P01 AG19724.
References
- 1.Przedborski S, Vial M, Jackson-Lewis V. Neurodegeneration: what is it and where are we? J Clin Invest. 2003;111:3–10. doi: 10.1172/JCI17522. [DOI] [PMC free article] [PubMed] [Google Scholar]
- 2.Katzman R, Fox P. The world-wide impact of dementia. Projections of prevalence and costs. In: Mayeaux R, Christen Y, editors. Epidemiology of Alzheimer’s Disease: from Gene to Prevention. Springer-Verlag; Berlin: 1999. pp. 1–17. [Google Scholar]
- 3.O’Hara R, Yesavage JA, Derouesne C. Therapeutic approaches to age-associated neurocognitive disorders. Dialogues in clinical neuroscience. Cerebral Aging Concepts Assess. 2001;3:191–213. doi: 10.31887/DCNS.2001.3.3/rohara. [DOI] [PMC free article] [PubMed] [Google Scholar]
- 4.Mayeux R, Sano M. Treatment of Alzheimer’s disease. N Engl J Med. 1999;341:1670–1679. doi: 10.1056/NEJM199911253412207. [DOI] [PubMed] [Google Scholar]
- 5.Leber P. Slowing the progression of Alzheimer’s disease: methodological issues. Alzheimer Dis Assoc Disord. 1997;11 (Suppl 5):S10–S21. [PubMed] [Google Scholar]
- 6.Mani R. The evaluation of disease modifying therapies in Alzheimer’s disease: a regulatory review. Stat Med. 2004;23:305–314. doi: 10.1002/sim.1718. [DOI] [PubMed] [Google Scholar]
- 7.Hsu YY, Schuff N, Du AT, Mark K, Zhu X, Hardin D, Weiner MW. Comparison of automated and manual MRI volumetry of hippocampus in normal aging and dementia. J Magn Reson Imaging. 2002;16:305–310. doi: 10.1002/jmri.10163. [DOI] [PMC free article] [PubMed] [Google Scholar]
- 8.Jack CR, Dickson DW, Parisi JE, Xu YC, Cha RH, O’Brien PC, Edland SD, Smith GE, Boeve BF, Tangalos EG, Kokmen E, Petersen RC. Antemortem MRI findings correlate with hippo-campal neuropathology in typical aging and dementia. Neurology. 2002;58:750–757. doi: 10.1212/wnl.58.5.750. [DOI] [PMC free article] [PubMed] [Google Scholar]
- 9.Bobinski M, De Leon MJ, Wegiel J, Desanti S, Convit A, Saint Louis LA, Rusinek H, Wisnewski HM. The histological validation of post mortem magnetic resonance imaging determined hippocampal volume in Alzheimer’s disease. Neuroscience. 2000;95:721–725. doi: 10.1016/s0306-4522(99)00476-5. [DOI] [PubMed] [Google Scholar]
- 10.De Leon MJ, Desanti S, Zinkowski R, Metha PD, Pratico D, Segal S, Calk C, Kerkman D, Deberardis J, Li J, Lair L, Reisberg B, Tsui W, Rusinek H. MRI and CSF studies in the early diagnosis of Alzheimer’s disease. J Intern Med. 2004;256:205–223. doi: 10.1111/j.1365-2796.2004.01381.x. [DOI] [PubMed] [Google Scholar]
- 11.Resnick SM, Pham DL, Kraut MA, Zondrmann AB, Davatzikos C. Longitudinal magnetic resonance imaging studies of older adults: a shrinking brain. J Neurosci. 2003;23:3295–3301. doi: 10.1523/JNEUROSCI.23-08-03295.2003. [DOI] [PMC free article] [PubMed] [Google Scholar]
- 12.Fox NC, Schrott JM. Imaging cerebral atrophy: normal ageing to Alzheimer’s disease. Lancet. 2004;363:392–394. doi: 10.1016/S0140-6736(04)15441-X. [DOI] [PubMed] [Google Scholar]
- 13.Gunter JL, Shiung MM, Manduca A, Jack CR. Methodological considerations for measuring rates of brain atrophy. J Magn Reson Imaging. 2003;18:16–24. doi: 10.1002/jmri.10325. [DOI] [PMC free article] [PubMed] [Google Scholar]
- 14.Chatelat G, Desgranges B, De La Sayette V, Viader F, Eustache F, Baron JC. Mapping of gray matter loss with voxel based morphometry in mild cognitive impairment. Neuroreport. 2002;13:1939–1943. doi: 10.1097/00001756-200210280-00022. [DOI] [PubMed] [Google Scholar]
- 15.Cardenas VA, Du AT, Hardin D, Ezekiel F, Weber P, Jagust WJ, Chui HC, Schuff N, Weiner MW. Comparison of methods for measuring longitudinal brain change in cognitive impairment and dementia. Neurobiol Aging. 2003;24:537–544. doi: 10.1016/s0197-4580(02)00130-6. [DOI] [PubMed] [Google Scholar]
- 16.Freebourogh PA, Foc NC. The boundary shift integral: an accurate and robust measure of cerebral volume changes from registered repeat MRI. IEEE Trans Med Imag. 1997;15:623–629. doi: 10.1109/42.640753. [DOI] [PubMed] [Google Scholar]
- 17.Karas GB, Burton EJ, Rombouts SA, van Schijndel RA, O’Brien JT, Scheltens P, McKeith IG, Williams D, Ballard C, Barkhof F. A comprehensive study of gray matter loss in patients with Alzheimer’s disease using voxel based morphometry. Neuroimage. 2003;18:895–907. doi: 10.1016/s1053-8119(03)00041-7. [DOI] [PubMed] [Google Scholar]
- 18.Studholme C, Cardenas V, Maudsley A, Weiner MW. An intensity consistent filtering approach to the analysis of deformation tensor derived maps of brain shape. Neuroimage. 2003;19:1638–1649. doi: 10.1016/s1053-8119(03)00183-6. [DOI] [PubMed] [Google Scholar]
- 19.Kessler RM. Imaging methods for evaluating brain function in man. Neurobiol Aging. 2003;(Suppl 1):S21–S35. doi: 10.1016/s0197-4580(03)00047-2. [DOI] [PubMed] [Google Scholar]
- 20.McMahon PM, Araki SS, Sandberg EA, Neumann PJ, Gazelle GS. Cost effectivness of PET in the diagnosis of Alzheimer disease. Radiology. 2003;228:515–522. doi: 10.1148/radiol.2282020915. [DOI] [PubMed] [Google Scholar]
- 21.Frahm J, Krueger G, Merboldt KD, Kleinschmidt A. Dynamic NMR studies of perfusion and oxidative metabolism during focal brain activation. Adv Exp Med Biol. 1997;413:195–203. doi: 10.1007/978-1-4899-0056-2_21. [DOI] [PubMed] [Google Scholar]
- 22.Manczak M, Park BS, Jung Y, Reddy PH. Differential expression of oxidative phophorylation genes in patients with Alzheimer’s disease: implication for early mitochondrial dysfunction and oxidative damage. Neuromol Med. 2004;5:147–162. doi: 10.1385/NMM:5:2:147. [DOI] [PubMed] [Google Scholar]
- 23.Mc Gonigle DJ, Howseman AM, Athwal BS, Friston KJ, Frackowiak RS, Holmes AP. Variability in fMRI: an examination of intersession differences. Neuroimage. 2000;11:708–734. doi: 10.1006/nimg.2000.0562. [DOI] [PubMed] [Google Scholar]
- 24.Small SA. High resolution MRI: a promising approach for diagnosing Alzheimer’s disease and mapping its course. Alzheimer Dis Assoc Disord. 2003;17:154–161. doi: 10.1097/00002093-200307000-00007. [DOI] [PubMed] [Google Scholar]
- 25.Baslow MH. N-Acetylaspartate in the vertebrate brain:metabolism and function. Neurochem Res. 2003;28:941–953. doi: 10.1023/a:1023250721185. [DOI] [PubMed] [Google Scholar]
- 26.Adalsteinsson E, Sullivan EV, Kleinhans N, Spielman DM, Pfefferbaum A. Longitudinal decline of the neuronal marker N-acteylaspartate in Alzheimer’s disease. Lancet. 2000;355:1696–1697. doi: 10.1016/s0140-6736(00)02246-7. [DOI] [PubMed] [Google Scholar]
- 27.Trabesinger AH, Meier D, Boesiger P. In vivo1H NMR spectroscopy of individual human brain metabolites at moderate field strengths. Magn Reson Imaging. 2003;21:1295–1302. doi: 10.1016/j.mri.2003.08.029. [DOI] [PubMed] [Google Scholar]
- 28.Fitzpatrick AL, Kuller LH, Ives DG, Lopez OL, Jagust W, Breitner JC, Jones B, Lyketsos C, Dulberg C. Incidence and prevalence of dementia in the Cardiovascular Health Study. J Am Geriatr Soc. 2004;52:195–204. doi: 10.1111/j.1532-5415.2004.52058.x. [DOI] [PubMed] [Google Scholar]
- 29.McKeith I, Mintzer J, Aarsaland D, Burn D, Chiu H, Cohen-Mansfield J, Dickson D, Dubois B, Duda JE, Felman H, Gauthier S, Halliday G, Lawlor B, Lippa C, Lippa OL, Machado JC, O’Brien J, Playfer J, Reid W. Dementia with Lewy bodies. Lancet Neurol. 2004;3:19–28. doi: 10.1016/s1474-4422(03)00619-7. [DOI] [PubMed] [Google Scholar]
- 30.Hodges JR. Frontotemporal dementia (Pick’s disease): clinical features and assessment. Neurology. 2001;56 (Suppl 4):S6–S10. doi: 10.1212/wnl.56.suppl_4.s6. [DOI] [PubMed] [Google Scholar]
- 31.Mattson MP. Pathways towards and away from Alzheimer’s disease. Nature. 2004;430:631–639. doi: 10.1038/nature02621. [DOI] [PMC free article] [PubMed] [Google Scholar]
- 32.Cummings JL. Alzheimer’s disease. N Engl J Med. 2004;351:56–67. doi: 10.1056/NEJMra040223. [DOI] [PubMed] [Google Scholar]
- 33.Hock C, Konietzko U, Streffer JR, Tracey J, Signorell A, Muller-Tilmanns B, Lemke U, Henke K, Moritz E, Garcia E, Wollmer MA, Umbricht D, de Quervain DJ, Hofmann M, Maddalena A, Papassotiropoulos A, Nitsch RM. Antibodies against beta-amyloid slow cognitive decline in Alzheimer’s disease. Neuron. 2003;38:547–554. doi: 10.1016/s0896-6273(03)00294-0. [DOI] [PubMed] [Google Scholar]
- 34.Fox NC, Black RS, Gilman S, Rossor MN, Griffith SG, Jenkins L, Koller M. Effects of A-beta immunotherapy (AN1792) on MRI measures of brain, ventricle and hippocampal volumes in Alzheimer’s disase. Neurobiol Aging. 2004;25 (Suppl 2):84. [Google Scholar]
- 35.Braak H, Braak E. Evolution of the neuropathology of Alzheimer’s disease. Acta Neurol Scand. 1996;(Suppl 165):3–12. doi: 10.1111/j.1600-0404.1996.tb05866.x. [DOI] [PubMed] [Google Scholar]
- 36.Delacourt A, David JP, Sergeant N, Buee L, Wattez A, Vermersch P, Ghozali F, Fallet-Bianco C, Pasquier F, Lebert F, Petit H, Di Menza C. The biochemical pathway of neurofibrillary degeneration in aging and Alzheimer’s disease. Neurology. 1999;52:1158–1165. doi: 10.1212/wnl.52.6.1158. [DOI] [PubMed] [Google Scholar]
- 37.Petersen RC. Mild cognitive impairment a diagnostic entity. J Intern Med. 2004;256:183–194. doi: 10.1111/j.1365-2796.2004.01388.x. [DOI] [PubMed] [Google Scholar]
- 38.Jack CR, Petersen RC, Xu Y, O’Brien PC, Smith GE, Ivnik RJ, Boeve BF, Tangalos EG, Kokmen E. Rates of hippcampal atrophy correlate with change in clinical status in aging and AD. Neurology. 2000;55:484–489. doi: 10.1212/wnl.55.4.484. [DOI] [PMC free article] [PubMed] [Google Scholar]
- 39.Xu Y, Jack CR, O’Brien PC, Kokmen E, Smith GE, Ivnik RJ, Boeve BF, Tangalos RG, Petersen RC. Usefullness of MRI measures of entorhinal cortex versus hippocampus in AD. Neurology. 2000;54:1760–1767. doi: 10.1212/wnl.54.9.1760. [DOI] [PubMed] [Google Scholar]
- 40.Du AT, Schuff N, Amend D, Laakso MP, Hsu YY, Jagust WJ, Yaffe K, Kramer JH, Reed B, Norman D, Chui HC, Weiner MW. Magnetic resonance imaging of the entorhinal cortex and hippocampus in mild cognitive impairment and Alzheimer’s disease. J Neurol Neurosurg Psychiatry. 2001;71:441–447. doi: 10.1136/jnnp.71.4.441. [DOI] [PMC free article] [PubMed] [Google Scholar]
- 41.Grundman M, Petersen RC, Ferris SH, Thomas RG, Aisen PS, Bennett DA, Foster NL, Jack CR, Galasko DR, Doody R, Kaye J, Sano M, Mohs R, Gauthier S, Kim HT, Jin S, Schultz AN, Schafer K, Mulnard R, van Dyck CH, Mintzer J, Zamrini EY, Cahn-Weiner D, Thal LJ. Mild cognitive impairment can be distinguished from Alzheimer’s disease and normal ageing for clinical trials. Arch Neurol. 2004;61:59–66. doi: 10.1001/archneur.61.1.59. [DOI] [PubMed] [Google Scholar]
- 42.De Toledo-Morrell L, Stoub TR, Bulgakova M, Wilson RS, Bennett DA, Leurgans S, Wuu J, Turner DA. MRI derived entorhinal volume is a good predictor of conversion from MCI to AD. Neurobiol Aging. 2004;9:1197–1203. doi: 10.1016/j.neurobiolaging.2003.12.007. [DOI] [PubMed] [Google Scholar]
- 43.Petersen RC, Doody R, Kurz A, Mohs RC, Morris JC, Rabins PV, Ritchie K, Rossor M, Thal L, Winblad B. Current concepts in mild cognitive impairment. Arch Neurol. 2001;58:1985–1999. doi: 10.1001/archneur.58.12.1985. [DOI] [PubMed] [Google Scholar]
- 44.Thompson PM, Hayashi KM, De Zubicaray GI, Janke AL, Rose SE, Semple J, Hong MS, Herman DH, Gravano D, Doddrell DM, Toga AW. Mapping hippocampal and ventricular change in Alzheimer disease. Neuroimage. 2004;22:1754–1766. doi: 10.1016/j.neuroimage.2004.03.040. [DOI] [PubMed] [Google Scholar]
- 45.Wang L, Swank JS, Glick IE, Gado HM, Miller MI, Morris JC, Csernansky JG. Changes in hippocampal volume and shape across time distinguish dementia of the Alzheimer type from healthy aging. Neuroimage. 2003;20:667–682. doi: 10.1016/S1053-8119(03)00361-6. [DOI] [PubMed] [Google Scholar]
- 46.Chan D, Janssen JC, Withwell JL, Watts HC, Jenkins R, Frost C, Rossor MN, Fox NC. Change in rates of cerebral atrophy over time in early-onset Alzheimer’s disease: longitudinal MRI study. Lancet. 2003;362:1121–1122. doi: 10.1016/S0140-6736(03)14469-8. [DOI] [PubMed] [Google Scholar]
- 47.Silbert LC, Quinn JF, Moore MM, Corbridge E, Ball MJ, Murdoch G, Sexton G, Kaye JA. Changes in premorbid brain volume predict Alzheimer’s disease pathology. Neurology. 2003;61:487–492. doi: 10.1212/01.wnl.0000079053.77227.14. [DOI] [PubMed] [Google Scholar]
- 48.Killiany RJ, Gomez-Isla T, Moss M, Kikins R, Sandor T, Jolesz F, Tanzi R, Jones K, Hyman BT, Albert MS. Use of structural magnetic resonance imaging to predict who will get Alzheimer’s disease. Ann Neurol. 2000;47:430–439. [PubMed] [Google Scholar]
- 49.Bradley KM, Bydder GM, Budge MM, Hajnal JV, White SJ, Ripley BD, Smith AD. Serial brain MRI at 3–6 month intervals as a surrogate marker for Alzheimer’s disease. Br J Radiol. 2002;75:506–513. doi: 10.1259/bjr.75.894.750506. [DOI] [PubMed] [Google Scholar]
- 50.Fox NC, Cousens S, Scahill R, Harvey RJ, Rossor N. Using serial registered brain magnetic resonance imaging to measure disease progression in Alzheimer’s disease. Power calculations and estimates of sample size to detect treatment effects. Arch Neurol. 2000;57:339–344. doi: 10.1001/archneur.57.3.339. [DOI] [PubMed] [Google Scholar]
- 51.Jack CR, Shiung MM, Gunter JL, O’brien PC, Weigand SD, Knopman DS, Boeve BF, Ivnik RJ, Smith GE, Cha RH, Tangalos EG, Petersen RC. Comparison of different MRI brain atrophy rate measures with clinical disease progression in AD. Neurology. 2004;62:591–600. doi: 10.1212/01.wnl.0000110315.26026.ef. [DOI] [PMC free article] [PubMed] [Google Scholar]
- 52.Jack CR, Slomkowski M, Gracon S, Hoover TM, Felmlee JP, Stewart K, Xu Y, Shiung M, O’Brien PC, Cha R, Knopman D, Petersen RC. MRI as a biomarker of disease progression in a therapeutic trial of milameline for AD. Neurology. 2003;60:253–260. doi: 10.1212/01.wnl.0000042480.86872.03. [DOI] [PMC free article] [PubMed] [Google Scholar]
- 53.Krishnan KRR, Charles HC, Doraiswamy PM, Mintzer J, Weisler R, Yu X, Perdomo C, Ieni JR, Rogers S. Randomized, placebo-controlled trial of the effects of donepezil on neuronal markers and hippocampal volumes in Alzheimer’s disease. Am J Psychiatry. 2003;160:2003–2011. doi: 10.1176/appi.ajp.160.11.2003. [DOI] [PubMed] [Google Scholar]
- 54.Rombouts SARB, Barkhof F, van Meel CS, Scheltens P. Alteration in brain activation during cholinergic enhancement with rivastigmine in Alzheimer’s disease. J Neurol Neurosurg Psychiatry. 2002;73:665–671. doi: 10.1136/jnnp.73.6.665. [DOI] [PMC free article] [PubMed] [Google Scholar]
- 55.Saykin AJ, Wishart HA, Rabin LA, Flashman LA, McHugh TL, Mamourian AC, Santulli RB. Cholinergic enhancement of frontal lobe activity in mild cognitive impairment. Brain. 2004;127:1574–1583. doi: 10.1093/brain/awh177. [DOI] [PubMed] [Google Scholar]
- 56.Iyo M, Namba H, Fukushi K, Shinotoh H, Nagatsuka S, Suhara T, Sudo Y, Suzuki K, Irie T. Measurement of acetylcholinesterase by positron emisson tomography in the brains of healthy controls and patients with Alzheimer’s disease. Lancet. 1997;349:1805–1809. doi: 10.1016/S0140-6736(96)09124-6. [DOI] [PubMed] [Google Scholar]
- 57.Kuhl DE, Koeppe RA, Minoshima S, Snyder SE, Ficaro EP, Foster NL, Frey KA, Kilbourn MR. In vivo mapping of cerebral acetylcholinesterase activity in aging and Alzheimer’s disease. Neurology. 1999;52:691–699. doi: 10.1212/wnl.52.4.691. [DOI] [PubMed] [Google Scholar]
- 58.Shinotoh H, Namba H, Fukushi K, Nagatsuka S, Tanaka N, Aotsuka A, Ota T, Tanada S, Irie T. Progressive loss of cortical acetylcholinesterase activity in association with cognitive decline in Alzheimer’s disase: a positron emission tomography study. Ann Neurol. 2000;48:194–200. [PubMed] [Google Scholar]
- 59.Shinotoh H, Aotsuka A, Fukushi K, Nagatsuka S, Tanaka N, Ota T, Tanada S, Irie T. Effect of donepezil on brain acetylcholin-esterase activity in patients with AD measured by PET. Neurology. 2001;56:408–410. doi: 10.1212/wnl.56.3.408. [DOI] [PubMed] [Google Scholar]
- 60.Kuhl DE, Minoshima S, Frey KA, Foster NL, Kilbourn MR, Koeppe RA. Limited donepezil inhibition of acetylcholin-esterase measured with positron emission tomography in living Alzheimer cerebral cortex. Ann Neurol. 2000;48:391–395. [PubMed] [Google Scholar]
- 61.Venneri A, Shanks MF, Staff RT, Pestell SJ, Forbes K, Gemmell HG, Murray AD. Cerebral blood flow and cognitive response to riivastigmine treatment in Alzheimer’s disease. Neuroreport. 2002;13:83–87. doi: 10.1097/00001756-200201210-00020. [DOI] [PubMed] [Google Scholar]
- 62.Rodriguez G, Vitali P, Canfora M, Calvini P, Girtler N, De Leo C, Piccardo A, Nobili F. Quantitative EE and perfusional single photon emission computed tomography in Alzheimer’s disease. Clin Neurophysiol. 2004;115:39–49. doi: 10.1016/s1388-2457(03)00321-3. [DOI] [PubMed] [Google Scholar]
- 63.Mega MS, Cummings JL, O’Connor SM, Dinov ID, Reback E, Felix J, Masterman DL, Phelps ME, Small GW, Toga AW. Neuropsychiatry Neuropsychol Behav Neurol. 2001;14:63–68. [PubMed] [Google Scholar]
- 64.Nobili F, Vitali P, Confora M, Girtler N, De Leo C, Mariani G, Pupi A, Rodriquez G. Effects of long term donepezil therapy on rCBF of Alzheimer’s patients. Clin Neurophysiol. 2002;113:1241–1248. doi: 10.1016/s1388-2457(02)00110-4. [DOI] [PubMed] [Google Scholar]
- 65.Nakano S, Asada T, Matsuda H, Uno M, Takasaki M. Donepezil hydrochloride preserves regional cerebral blood flow in patients with Alzheimer’s disease. J Nucl Med. 2001;42:1441–1445. [PubMed] [Google Scholar]
- 66.Nobili F, Koulibaly M, Vitali P, Migneco O, Mariani G, Ebmeier K, Pupi A, Robert PH, Rodriguez G, Darcourt J. Brain perfusion follow-up in Alzheimer’s patients during treatment with acetyl-cholinesterase inhibitors. J Nucl Med. 2002;43:983–990. [PubMed] [Google Scholar]
- 67.Potkin SG, Anand R, Fleming K, Alva G, Keator D, Carreon D, Messina J, Wu JC, Hartman R, Fallon JH. Brain metabolic and clinical effects of rivastigmine in Alzheimer’s disease. Int J Neuropsychopharmacol. 2001;3:223–230. doi: 10.1017/S1461145701002528. [DOI] [PubMed] [Google Scholar]
- 68.Tune L, Tiseo PJ, Ieni J, Perdomo C, Pratt RD, Votaw JR, Jewart RD, Hoffman JM. Donepezil HCl (E2020) maintains functional brain activity in patients with Alzheimer disease: results of a 24-week, double-blind, placebo-controlled study. Am J Geriatr Psychiatry. 2003;11:169–177. [PubMed] [Google Scholar]
- 69.Klunk WE;Engler H, Nordberg A, Wang Y, Blomquist G, Holt D, Bergström M, Savitcheva I, Huang GF, Estrada S, Ausen B, Debnath ML, Barletta J, Price JC, Sandell J, Lopresti BJ, Wall A, Koivisto P, Anotoni G, Mathis CA, Långström B. Imaging brain amyloid in Alzheimer’s disease with Pittsburgh Compound-B. Ann Neurol. 2004;55:306–319. doi: 10.1002/ana.20009. [DOI] [PubMed] [Google Scholar]
- 70.Jellinger KA. The pathology of ischemic–vascular dementia: an update. J Neurol Sci. 2002;203–204:153–157. doi: 10.1016/s0022-510x(02)00282-4. [DOI] [PubMed] [Google Scholar]
- 71.Van Straaten EC, Scheltens P, Knol DL, van Buchem MA, van Dijk EJ, Hofman PA, Karas G, Kjartansson O, De Leeuw FE, Prins ND, Schmidt R, Visser MC, Weinstein HC, Brakhof F. Operational definitions for the NINDS-AIREN criteria for vascular dementia: an interobserver study. Stroke. 2003;34:1907–1912. doi: 10.1161/01.STR.0000083050.44441.10. [DOI] [PubMed] [Google Scholar]
- 72.Erkinjuntti T, Roman G, Gauthier S, Feldman H, Rockwood K. Emerging therapies for vascular dementia and vascular cognitive impairment. Stroke. 2004;35:1010–1017. doi: 10.1161/01.STR.0000120731.88236.33. [DOI] [PubMed] [Google Scholar]
- 73.O’Brien JT, Paling S, Barber R, Williams ED, Ballard C, McKeith IG, Gholkar A, Crum WR, Rossor MN, Fox NC. Progressive brain atrophy on serial MRI in dementia with Lewy bodies, AD and vascular dementia. Neurology. 2001;56:1386–1388. doi: 10.1212/wnl.56.10.1386. [DOI] [PubMed] [Google Scholar]
- 74.Mungas D, Jagust WJ, Reed BR, Kramer JH, Weiner MW, Schuff N, Norman D, Mack WJ, Willis L, Chui H. MRI predictors of cognition in subcortical ischemic vascular disease and Alzheimer’s disease. Neurology. 2001;57:2229–2235. doi: 10.1212/wnl.57.12.2229. [DOI] [PMC free article] [PubMed] [Google Scholar]
- 75.Mungas D, Reed BR, Jagust WJ, De Carli C, Mack WJ, Kramer JH, Weiner MW, Schuff N, Chui HC. Volumetric MRI predicts rate of cognitive decline related to AD and cerebrovascular disease. Neurology. 2002;59:867–873. doi: 10.1212/wnl.59.6.867. [DOI] [PMC free article] [PubMed] [Google Scholar]
- 76.Cohen RA, Paul RH, Ott BR, Moser DJ, Zawacki TM, Stone W, Gordon N. The relationship of subcortical MRI hyperintensities and brain volume to cognitive function in vascular dementia. J Int Neuropsychol Soc. 2002;8:743–752. doi: 10.1017/s1355617702860027. [DOI] [PubMed] [Google Scholar]
- 77.Boyle PA, Paul R, Moser D, Zawacki T, Gordon N, Cohen R. Cognitive neurologic predictors of functional impairment in vascular dementia. Am J Geriatr Psychiatry. 2003;11:103–106. [PubMed] [Google Scholar]
- 78.Pantoni L. Treatment of vascular dementia: evidence from trials with non-cholinergic drugs. J Neurosci. 2004;226:67–70. doi: 10.1016/j.jns.2004.09.014. [DOI] [PubMed] [Google Scholar]
- 79.Broderick JP, Gaskill M, Dhawan A, Khoury JC. Temoral changes in brain volume and cognition in a randomized treatment trial of vascular dementia. J Neuroimaging. 2001;11:6–12. doi: 10.1111/j.1552-6569.2001.tb00002.x. [DOI] [PubMed] [Google Scholar]
- 80.Sweet LH, Paul RH, Cohen RA, Moser D, Ott BR, Gordon N, Browndyke JN, Shah P, Garrett KD. Neuroimaging correlates of dementia rating scale performance at baseline and 12 month follow up. Geriatr Psychiatry Neurol. 2003;16:240–244. doi: 10.1177/0891988703258322. [DOI] [PubMed] [Google Scholar]
- 81.Mielke R, Moller HJ, Erkinjuntti T, Rosenkranz B, Rother M, Kittner B. Propentophylline in treatment of vascular dementia and Alzheimer-type dementia: overview of phase I and phase II clinical trials. Alzheimer Dis Assoc Disord. 1998;12 (Suppl 2):S29–S35. [PubMed] [Google Scholar]
- 82.Lojkowska W, Ryglewicz D, Jedrzejczak T, Minc S, Jakubowska T, Jarosz H, Bochnyska A. The effect of cholinesterase inhibitors on the regional blood flow in patients with Alzheimer’s disease and vascular dementia. J Neurol Sci. 2003;216:119–126. doi: 10.1016/s0022-510x(03)00229-6. [DOI] [PubMed] [Google Scholar]
- 83.Leigh PN, Swash M, Iwasaki Y, Ludolph A, Meiniger V, Miller RG, Mitsumoto H, Shaw P, Tashiro K, Van Den Berg L. Amyotrophic lateral sclerosis: a consensus viewpoint on designing and implementing a clinical trial. Amyotroph Lateral Scler Other Motor Neuron Disord. 2004;5:84–98. doi: 10.1080/14660820410020187. [DOI] [PubMed] [Google Scholar]
- 84.Kalra S, Arnold D. Neuroimaging in amyotrophic lateral sclerosis. Amyotroph Lateral Scler Other Motor Neuron Disord. 2003;4:243–248. doi: 10.1080/14660820310011269. [DOI] [PubMed] [Google Scholar]
- 85.Karitzky J, Ludolph AC. Imaging and neurochemical markers for diagnosis and disease progression in ALS. J Neurol Sci. 2001;191:35–41. doi: 10.1016/s0022-510x(01)00628-1. [DOI] [PubMed] [Google Scholar]
- 86.Cheung G, Gawel MJ, Cooper PW, Farb RI, Ang LC, Gawel MJ. Amyotrophic lateral sclerosis: correlation of clinical and MR imaging findings. Radiology. 1995;194:263–270. doi: 10.1148/radiology.194.1.7997565. [DOI] [PubMed] [Google Scholar]
- 87.Ishikawa T, Nagura H, Yokota T, Yamanouchi H. Signal loss in the motor cortex on magnetic resonance images in amyotrophic lateral sclerosis. Ann Neurol. 1993;33:218–222. doi: 10.1002/ana.410330214. [DOI] [PubMed] [Google Scholar]
- 88.Waragai M. MRI and clinical features in amyotrophic lateral sclerosis. Neuroradiology. 1997;39:847–851. doi: 10.1007/s002340050518. [DOI] [PubMed] [Google Scholar]
- 89.Graham JM, Papadakis N, Evans J, Widjaja E, Romanowski J, Paley MNJ, Wallis LI, Wilkinson ID, Shaw PJ, Griffiths PD. Diffusion tensor imaging for the assessment of upper motor neuron integrity in ALS. Neurology. 2004;63:2111–2119. doi: 10.1212/01.wnl.0000145766.03057.e7. [DOI] [PubMed] [Google Scholar]
- 90.Sach M, Winkler G, Glauche V, Liepert J, Heimbach B, Koch MA, Büchel C, Weiller C. Diffusion tensor MRI of early upper motor neuron involvement in amyotrophic lateral sclerosis. Brain. 2004;127:340–350. doi: 10.1093/brain/awh041. [DOI] [PubMed] [Google Scholar]
- 91.Ellis CM, Suckling J, Amaro E, Bullmore ET, Simmons A, Williams SCR, Leigh PN. Volumetric analysis reveals corticospinal tract degeneration and extramotor involvement in ALS. Neurology. 2001;57:1571–1578. doi: 10.1212/wnl.57.9.1571. [DOI] [PubMed] [Google Scholar]
- 92.Peretti-Viton P, Azulay JP, Trefouret S, Brunel H, Daniel C, Viton JM, Flori A, Salazard B, Pouget J, Serratrice G, Salamon G. MRI of the intracranial corticospinal tracts in amyotrophic and primary lateral sclerosis. Neuroradiology. 1999;41:744–749. doi: 10.1007/s002340050836. [DOI] [PubMed] [Google Scholar]
- 93.Rooney WD, Miller GR, Gelinas D, Schuff N, Maudsley AA, Weiner MW. Decreased N-acetylaspartate in motor cortex and corticospinal tract in ALS. Neurology. 1998;50:1800–1805. doi: 10.1212/wnl.50.6.1800. [DOI] [PubMed] [Google Scholar]
- 94.Schuff N, Rooney WD, Miller R, Gelinas DF, Amend DL, Maudsley AA, Weiner MW. Reanalysis of multislice 1H MRSI in amyotrophic lateral sclerosis. Magn Reson Med. 2001;45:513–516. doi: 10.1002/1522-2594(200103)45:3<513::aid-mrm1067>3.0.co;2-d. [DOI] [PubMed] [Google Scholar]
- 95.Sarchielli P, Pellicolli GP, Tarduci R, Chiarini P, Presciutti O, Gobbi G, Gallai V. Magnetic resonance imaging and 1H magnetic resonance spectroscopy in amyotrophic lateral sclerosis. Neuroradiology. 2001;43:189–197. doi: 10.1007/s002340000472. [DOI] [PubMed] [Google Scholar]
- 96.Kaufmann P, Pullman SL, Shungu DC, Chan S, Hays AP, Del Bene ML, Dover MA, Vukic M, Rowland LP, Mitsumoto H. Objective tests for upper motor neuron involvement in amyotrophic lateral sclerosis (ALS) Neurology. 2004;62:1753–1757. doi: 10.1212/01.wnl.0000125182.17874.59. [DOI] [PubMed] [Google Scholar]
- 97.Bowen BC, Pattany PM, Bradley WG, Murdoch JB, Rotta F, Younis AA, Duncan RC, Quencer RM. MR imaging and localized proton spectroscopy of the precentral gyrus in amyotrophic lateral sclerosis. Am J Neuroradiol. 2000;21:647–658. [PMC free article] [PubMed] [Google Scholar]
- 98.Suhy J, Miller RG, Rule R, Schuff N, Licht J, Dronsky V, Gelinas D, Maudsley AA, Weiner MW. Early detection and longitudinal changes in amyotrophic lateral sclerosis by 1H MRSI. Neurology. 2002;58:773–779. doi: 10.1212/wnl.58.5.773. [DOI] [PMC free article] [PubMed] [Google Scholar]
- 99.Kalra S, Cashman NR, Genge A, Arnold DL. Recovery of N-acetylaspartate in corticomotor neurons of patients with ALS after riluzole therapy. Neuroreport. 1998;9:1757–1761. doi: 10.1097/00001756-199806010-00016. [DOI] [PubMed] [Google Scholar]
- 100.Kalra S, Genge A, Arnold DL. A prospective, randomized, placebo-controlled evaluation of corticoneuronal response to intrathecal BDNF therapy in ALS using magnetic resonance spectroscopy: feasibility and results. Amyotroph Lateral Scler Other Motor Neuron Disord. 2003;4:22–26. doi: 10.1080/14660820310006689. [DOI] [PubMed] [Google Scholar]
- 101.Kalra S, Cashman NR, Caramanos Z, Genge A, Arnold DL. Gabapentin therapy for amyotrophic lateral sclerosis: lack of improvement in neuronal integrity shown by MR spectroscopy. Am J Neuroradiol. 2003;24:476–480. [PMC free article] [PubMed] [Google Scholar]
- 102.Sami A, Nutt JG, Ransom BR. Parkinson’s disease. Lancet. 2004;29:1783–1793. doi: 10.1016/S0140-6736(04)16305-8. [DOI] [PubMed] [Google Scholar]
- 103.Schapira AHV. Disease modification in Parkinson’s disease. Lancet Neurol. 2004;3:362–368. doi: 10.1016/S1474-4422(04)00769-0. [DOI] [PubMed] [Google Scholar]
- 104.Heiss WD, Hilker R. The sensitivity of 18-fluorodopa positron emisson tomography and magnetic resonance imaging in Parkinson’s disease. Eur J Neurol. 2004;11:5–12. doi: 10.1046/j.1351-5101.2003.00709.x. [DOI] [PubMed] [Google Scholar]
- 105.Hutchinson M, Raff U. Structural changes of the substantia nigra in Parkinson’s disease as revealed by MR imaging. Am J Neuroradiol. 2000;21:697–701. [PMC free article] [PubMed] [Google Scholar]
- 106.Yoshikawa K, Nakata Y, Yamata K, Nakagawa M. Early pathological changes in the parkinsonian brain demonstrated by diffusion tensor MRI. J Neurol Neurosurg Psychiatry. 2004;75:481–484. doi: 10.1136/jnnp.2003.021873. [DOI] [PMC free article] [PubMed] [Google Scholar]
- 107.Whone AL, Watts RL, Stoessl AJ, Davis M, Reske S, Nahmias C, Lang AE, Rasol O, Ribeiro MJ, Remy P, Poewe WH, Hauser RA, Brooks DJ REAL-PET study group. Slower progression of Parkinson’s disease with ropinirole versus levodopa: the REAL-PET study. Ann Neurol. 2003;54:93–101. doi: 10.1002/ana.10609. [DOI] [PubMed] [Google Scholar]
- 108.The Parkinson Study Group. Dopamine transporter brain imaging to assess the effects of pramipexole vs levodopa in Parkinson disease progression. JAMA. 2002;287:1653–1661. doi: 10.1001/jama.287.13.1653. [DOI] [PubMed] [Google Scholar]
- 109.The Parkinson Study Group. Does levodopa slow or hasten the rat eof progression of Parkinson’s disease? The results of the ELL-DOPA trial. Neurology. 2003;(Suppl 1):A80–A81. [Google Scholar]
- 110.Brooks DJ. Neuroimaging in Parkinson’s disease. Neuro Rx. 2004;1:243–254. doi: 10.1602/neurorx.1.2.243. [DOI] [PMC free article] [PubMed] [Google Scholar]
- 111.Poduslo JF, Curran GL, Peterson JA, McCormick DJ, Fauq AH, Khan MA, Wengenack T. Design and chemical synthesis of a magnetic resonance contrast agent with enhanced in vitro binding, high blood–brain barrier permeability and in vivo targeting to Alzheimer’s disase amyloid plaques. Biochemistry. 2004;43:6064–6075. doi: 10.1021/bi0359574. [DOI] [PMC free article] [PubMed] [Google Scholar]