

Abstract
Objective
To determine the effects of subcortical ischemic vascular dementia (SIVD) and AD on entorhinal cortex (ERC) and hippocampus.
Methods
Thirty-eight cognitively normal subjects, 18 patients with SIVD, and 22 patients with AD were included. Volumes of ERC and hippocampus were manually measured based on MRI. Global cerebral changes of cortical gray matter, subcortical gray matter, white matter, sulcal CSF, ventricular CSF (vCSF), and white matter signal hyperintensities (WMSH) were assessed.
Results
Patients with SIVD had 21.7% (p < 0.01) smaller ERC and 18.2% (p < 0.01) smaller hippocampi than cognitively normal subjects and 24.4% (p < 0.01) larger ERC and 11.1% (p < 0.05) larger hippocampi than patients with AD. In addition, patients with SIVD had less cortical gray matter and white matter and more vCSF and WMSH (all p < 0.01) than cognitively normal subjects and more vCSF and WMSH (p < 0.01) than patients with AD. The volumes of ERC and hippocampus were positively correlated to similar extents (p < 0.01) in SIVD and AD. Cortical gray matter loss was positively correlated (p < 0.01) with hippocampal atrophy, but not with ERC atrophy, in SIVD and AD. Hippocampal volume alone could classify 82% of patients with SIVD from cognitively normal subjects and 63% of patients with SIVD from subjects with AD. Adding global cerebral changes to hippocampus substantially improved the classification to 96% between patients with SIVD and cognitively normal subjects and 83% between subjects with SIVD and those with AD, whereas adding ERC change to hippocampus did not significantly improve the discrimination.
Conclusions
The entorhinal cortex and hippocampus are less affected by subcortical ischemic vascular dementia than by AD.
After AD, vascular dementia is a frequent cause of dementia, accounting for perhaps one-fifth as many cases as AD. 1 Furthermore, AD and vascular pathologies often occur together to varying extents,2 making it difficult to determine which type plays the major role in causing dementia in particular cases. Therefore, there is much interest in improving the accuracy of differential diagnosis between AD and vascular dementia.
Previous MRI studies of AD reported that hippocampal volume loss distinguished patients with AD from elderly persons who are cognitively normal, to a high degree.3,4 However, additional studies have shown that these measures may not be as accurate, especially for patients with early AD.5,6 Furthermore, hippocampal volume loss is not a specific feature of AD, limiting its usefulness for a differential diagnosis between AD and other types of dementia.7-9 In accordance with the theory that early AD pathology may start in the entorhinal cortex (ERC) before spreading to the hippocampus,10 it has been reported that there is greater ERC than hippocampal atrophy in patients with AD.11-14 However, the diagnostic value of ERC atrophy for AD is controversial. Some studies found that measurements of ERC atrophy in addition to hippocampus improved the discrimination of AD from cognitively normal subjects.11,14 In contrast, other studies found no advantage in measuring ERC.12,13 It was found that ERC volume loss was similar in AD and frontotemporal dementia but hippocampal volume loss was less severe in fronto-temporal dementia than AD.7 This suggests that the relationship between ERC and hippocampal changes might provide useful information for the discrimination between patient groups.
Subcortical ischemic vascular dementia (SIVD) is an important subtype of vascular dementia, but there are no reports of ERC measurements in SIVD. Therefore, the first goal of this study was to compare ERC volumes in patients with SIVD with those in cognitively normal subjects and patients with AD. Because of the well-known involvement of the ERC in AD, we hypothesized that there would be less ERC atrophy in SIVD than in AD. Another goal was to determine whether the relationship between ERC and hippocampal volume changes is different between SIVD and AD and, furthermore, to determine the extent to which ERC and hippocampal volume changes are associated with global cerebral volume changes. Pathologic studies have suggested that AD pathology initially affects the ERC before extending to the hippocampus; in contrast, we would expect that vascular pathology would affect ERC and hippocampus to a different extent depending on the location of vascular lesions because of different blood supplies of ERC and hippocampus.15 Therefore, we hypothesized that there would be a greater correlation between ERC and hippocampus volume in AD than in SIVD. A final goal was to assess the values of ERC, hippocampus, and global cerebral volume changes for the differentiation between the two types of dementia.
Methods
Thirty-eight cognitively normal subjects, 18 patients with SIVD, and 22 patients with AD were included in this study. Subjects with SIVD and AD were selected from a large sample of patients and matched for age, sex, and dementia severity as measured by the Mini-Mental State Examination score (MMSE). Cognitively normal subjects were selected to match only age and sex of dementia groups. MRI data from the patients with AD and cognitively normal subjects of this study have been reported in part in an earlier publication.14 Patients were recruited from the Memory and Aging Center (B.M.) of the University of California, San Francisco, and the Alzheimer Center (W.J.) of the University of California, Davis. SIVD was diagnosed according to the criteria of the State of California AD Diagnostic and Treatment Centers,16 and patients with AD had a clinical diagnosis of AD according to the criteria by the National Institute of Neurologic and Communicative Disorders and Stroke–AD and Related Disorders Association.17 Both patient groups received the standard battery of cognitive and neuropsychological tests in the referred centers and the diagnoses were made by the standard criteria in all patients.18 In addition, neuropsychological tests for characterization of SIVD and AD were included: two memory function tests with the List Recall Test from the Word List Learning Test of Memory Assessment Scales and recall of total number of words after an interference list (Delayed List Recall Test)19; an executive function test with the initiation-preservation subscale of Mattis Dementia Rating Scale20; and a verbal fluency test (Letter Verbal Fluency Test).21 Furthermore, Hachinski Ischemic Scores were obtained for each subject.22 A neuroradiologist (D.N.) evaluated the MRI data of all patients, especially for cortical and subcortical infarcts. Patients with SIVD were excluded if they had cortical infarcts or other major pathologies, except subcortical lacunes, white matter lesions, and atrophy. Patients with AD were excluded from the study if they had lacunes on MRI or other major pathologies, except white matter lesions and atrophy. In addition, four of the 18 SIVD cases have been confirmed as pure SIVD at autopsy, based on Consortium to Establish a Registry for AD criteria.23 Cognitively normal subjects were recruited from the community and received the same standard neuropsychological examinations at the centers. Cognitively normal subjects had cognitive test scores within the normal range and no clinical history of alcoholism, psychiatric illness, epilepsy, hypertension, diabetes, major heart disease, or head trauma. In addition, cognitively normal subjects were included only if they had no lacunes on MRI and no other major neuropathologies. All subjects or their guardians gave written informed consent before participating in the study, which was approved by the Committee of Human Research at the University of California, San Francisco.
MRI data were obtained on a 1.5-T Siemens Vision System (Siemens, Inc., Iselin, NJ), using a standard quadrature head coil. A vacuum-molded head holder (Vac-Pac, Olympic Medical, Seattle, WA) was used to restrict head movements. Structural MRI data were acquired using a double spin-echo sequence (DSE) with TR/TE1/TE2 (repetition and echo times) = 2,500/20/80-ms timing, 1.00 × 1.25 mm2 in-plane resolution, and about 50 contiguous 3.00-mm-thick axial slices oriented along the optic nerve as seen from a midsection sagittal scout MRI. In addition, a volumetric magnetization-prepared rapid gradient echo (MPRAGE) sequence was acquired, with TR/TE/TI = 10/7/300-ms timing, 15° flip angle, 1.00 × 1.00 mm2 in-plane resolution, and 1.40-mm-thick coronal partitions and oriented orthogonal to the image planes of DSE. Proton density and T2-weighted images from DSE and T1-weighted images from MPRAGE were used together for tissue segmentation. One experienced rater (A.T.D.) performed manual editing of the ERC and the hippocampus using T1-weighted images from MPRAGE. Boundaries of the ERC were defined using the protocol by Insausti et al.,24 and boundaries of the hippocampus were defined using the protocol by Watson et al.25 To assess global cerebral volume change, tissue segmentation analysis of MRI data was performed. First-pass segmentation of MRI data into gray matter, white matter, and CSF was achieved automatically with software developed in-house.26 Second-pass, operator-assisted segmentation classified further gray matter into cortical gray matter (cGM) and subcortical gray matter (sGM), white matter into normal white matter and white matter signal hyperintensities (WMSH), and CSF into sulcal (sCSF) and ventricular CSF (vCSF). Total intracranial volume was determined by summing the voxels from all tissue classes together. To account for variations in head size, the MRI measures were normalized to total intracranial volume. Rater reliability values expressed as a coefficient of variation were 2.6% for measurements of ERC, 1.0% for hippocampus, and <2% for tissue segmentation, as reported previously.14
The association between diagnosis and regional volume changes in subjects with SIVD and AD and cognitively normal subjects was tested using repeated-measures analysis of variance (rmANOVA), followed by post hoc Scheffe tests. Because volume changes of ERC and hippocampus in SIVD were a priori hypotheses, no adjustments were made for multiple comparisons in statistical tests of ERC and hippocampus. To reduce the probability of finding by chance significant differences between the groups based on MRI segmentation data, the level of α in rmANOVA was raised to 0.05/6 ≈ 0.01, according to Bonferroni-type corrections for multiple comparisons (six independent tests for cGM, sGM, white matter, vCSF, sCSF, WMSH). Relationships between volume changes of the ERC and hippocampus and between global cerebral changes and hippocampus or ERC were tested using linear regressions. The Pearson correlation coefficient was used to test the relationship between volume changes and MMSE scores. The powers of MRI volume measurements for discriminations of SIVD from cognitively normal subjects and SIVD from AD were tested using logistic regression analysis. Furthermore, receiver operator characteristics (ROC) analysis was performed. ROC tests correlate sensitivity (true rates) and “one minus” specificity (false-negative rates) for a series of rate values, providing a means to represent overall accuracy of a classifier (MRI measures) as area under the curve of ROC graph.
Results
Demographics
Table 1 lists the demographic data for the subjects and results from neuropsychological tests. The distribution of age (df = 2,75; F = 1.1; p = 0.3) and gender (χ2 = 1.4; p = 0.49) was comparable between the groups. Patients with AD and patients with SIVD had similar MMSE scores (p > 0.5), and both patient groups had lower MMSE scores than cognitively normal subjects (p < 0.001). Patients with SIVD had higher Hachinski Ischemic Scores than patients with AD (p < 0.01). Compared with patients with AD, patients with SIVD performed better in the List Recall Test (p < 0.01) and Delayed List Recall Test (p < 0.01) but worse in the Mattis Dementia Rating Scale (p < 0.05) and Letter Verbal Fluency Test (p < 0.01).
Table 1.
Demographics of the subjects
| Demographics | Cognitively normal subjects | Patients with AD | Patients with SIVD |
|---|---|---|---|
| No. (% F) | 38 (47) | 22 (55) | 18 (33) |
| Age, y | 75.0 ± 4.3 | 76.7 ± 4.7 | 74.2 ± 8.3 |
| Mini-Mental State Examination | 28.9 ± 0.9 | 19.5 ± 4.7* | 19.9 ± 4.7* |
| Hachinski Ischemic Score | 1.2 ± 2.0 | 1.0 ± 0.5 | 7.7 ± 3.7*‡ |
| List Recall Test | 9.9 ± 2.4 | 0.5 ± 1.3* | 3.1 ± 3.5*‡ |
| Delayed List Recall Test | 10.8 ± 1.7 | 0.6 ± 1.4* | 3.8 ± 3.8*‡ |
| Mattis Dementia Rating Scale | 8.0 ± 0.2 | 6.8 ± 1.8* | 5.1 ± 2.7*§ |
| Letter Verbal Fluency Test | 15.7 ± 4.8 | 12.0 ± 5.6* | 4.5 ± 3.7*‡ |
Data represented as mean ± SD.
p < 0.01, subjects with AD and SIVD compared with cognitively normal subjects.
p < 0.01,
p < 0.05 subjects with SIVD compared with subjects with AD.
SIVD = subcortical ischemic vascular dementia.
Entorhinal and hippocampal volumes
Table 2 lists volumes of ERC and hippocampus for all groups. Diagnosis was associated with volume losses of both ERC (F = 30.3; df = 2,75; p < 0.001) and hippocampus (F = 28.1; df = 2,75; p < 0.001). Post hoc Scheffe tests showed that patients with SIVD had 21.7% smaller volumes of ERC (F = 13.7; df = 1,54; p < 0.001) and 18.2% smaller volumes of hippocampus (F = 22.2, df = 1,54; p < 0.001) than cognitively normal subjects. However, patients with SIVD had 24.4% larger volumes of ERC (F = 10.3; df = 1,38; p < 0.01) and 11.1% larger volumes of hippocampus (F = 4.3; df = 1,38; p < 0.05) than patients with AD. In order to test whether the differences in ERC and hippocampus between AD and SIVD were due to differences in memory impairments between two patient groups, we accounted for individual neuropsychological tests in the analysis. List Recall Test, Delayed List Recall Test, Mattis Dementia Rating Scale, and Letter Verbal Fluency Test had no effect (all p > 0.05) on differences in ERC and hippocampus between AD and SIVD. The volumes of ERC and hippocampus from all subjects are shown in figure 1. Results from four subjects with pure SIVD confirmed by autopsy are highlighted. There was no effect by sex on volume changes of ERC (F = 0.4; df = 1,36; p = 0.5) and hippocampus (F = 1.1; df = 1,36; p = 0.3) and also no interaction between sex and diagnosis in ERC (F = 0.3; df = 1,36; p = 0.6) and hippocampal volume changes (F = 1.4; df = 1,36; p = 0.2) for patients.
Table 2.
Volumes of entorhinal cortex and hippocampus
| Diagnosis | Entorhinal cortex | Hippocampus |
|---|---|---|
| Cognitively normal subjects | 2,787 ± 582 | 6,307 ± 817 |
| AD | 1,649 ± 503 | 4,587 ± 997 |
| Percent change vs cognitively normal subjects | −40.8 | −27.3 |
| SIVD | 2,183 ± 543*† | 5,162 ± 915*‡ |
| Percent change vs cognitively normal subjects | −21.7 | −18.2 |
Data represented as mean ± SD in units of mm3.
p < 0.01, SIVD compared with cognitively normal subjects.
p < 0.01,
p < 0.05, subjects with SIVD compared with subjects with AD.
SIVD = subcortical ischemic vascular dementia.
Figure 1.
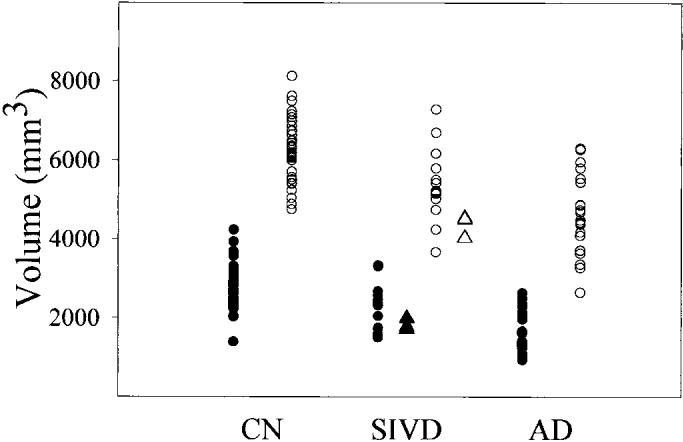
Plot of volumes of entorhinal cortex (ERC) and hippocampus in cognitively normal (CN) subjects, subjects with subcortical ischemic vascular dementia (SIVD) and AD. Black circles = ERC; open circles = hippocampus; black triangles = ERC of confirmed SIVD; open triangles = hippocampus of confirmed SIVD.
Segmentation
Table 3 lists the results from MRI tissue segmentation. Diagnosis was associated with volume losses of cGM (F = 24.0; df = 2,75; p < 0.001), white matter (F = 7.8; df = 2,75; p < 0.001), and enlarged spaces of vCSF (F = 27.8; df = 2,75; p < 0.001), sCSF (F = 6.4; df = 2,75; p < 0.01), and WMSH (F = 30.6; df = 2,75; p < 0.001). In contrast, sGM volume changes were not different among the groups (F = 2.9; df = 2,75; p = 0.06). Post hoc Scheffe tests showed that patients with SIVD had less cGM (F = 46.8; df = 1,54; p < 0.001) and white matter (F = 10.8; df = 1,54; p < 0.01) but more vCSF spaces (F = 56.8; df = 1,54; p < 0.001) and WMSH (F = 43.0; df = 1,54; p < 0.001) than cognitively normal subjects. Compared with patients with AD, patients with SIVD had more vCSF (F = 4.67; df = 1,38; p < 0.05) and WMSH (F = 20.4; df = 1,38; p < 0.001), whereas other differences between AD and SIVD from tissue segmentation were not significant.
Table 3.
Brain tissue volumes from segmentation
| Diagnosis | cGM | sGM | WM | sCSF | vCSF | WMSH |
|---|---|---|---|---|---|---|
| Control | 503 ± 28* | 18 ± 3 | 459 ± 31* | 267 ± 43 | 46 ± 14* | 5 ± 6* |
| AD | 458 ± 40 | 17 ± 5 | 419 ± 37 | 319 ± 52 | 66 ± 22‡ | 8 ± 7† |
| Percent change | −10 | −6 | −9 | 19 | 43 | 60 |
| SIVD | 438 ± 42* | 15 ± 4 | 426 ± 36* | 286 ± 65 | 85 ± 24*‡ | 45 ± 39*† |
| Percent change | −13 | −17 | −7 | 7 | 85 | 800 |
Data represented as mean ± SD in units of cm3. Percent change compared with cognitively normal subjects.
p < 0.01 subjects with SIVD vs cognitively normal subjects.
p < 0.01,
p < 0.05 subjects with SIVD vs subjects with AD.
cGM = cortical gray matter; sGM = subcortical gray matter; WM = white matter; sCSF = sulcal CSF; vCSF = ventricular CSF; WMSH = white matter signal hyperintensities; SIVD = subcortical ischemic vascular dementia.
Correlations
In order to determine the extents to which the ERC and hippocampal volume changes were correlated in SIVD and AD, we predicted ERC volume as a function of hippocampal volume and diagnosis using linear regression. Hippocampal volume loss alone was a significant predictor (F = 35.9; df = 1,36; p < 0.001) for ERC volume loss, without a significant interaction with diagnosis (F = 0.0; df = 1,36; p > 0.9), implying that the relationship between volume changes of ERC and hippocampus are similar in SIVD and AD. The relationships of ERC and hippocampal volume in SIVD and AD are plotted in figure 2. Using a similar model, we also determined the correlations between global volume changes and volumes of hippocampus or ERC in SIVD and AD. Volume changes of cGM were related (F = 5.5; df = 1,36; p < 0.05) with hippocampal volume without the interaction with diagnosis (F = 1.1; df = 1,36; p = 0.3), implying that the relationships between volume changes of cGM and hippocampus are also similar in SIVD and AD. In contrast to the hippocampus, volume change in cGM was not associated with ERC volume change (F = 1.9; df = 1,36; p = 0.2).
Figure 2.
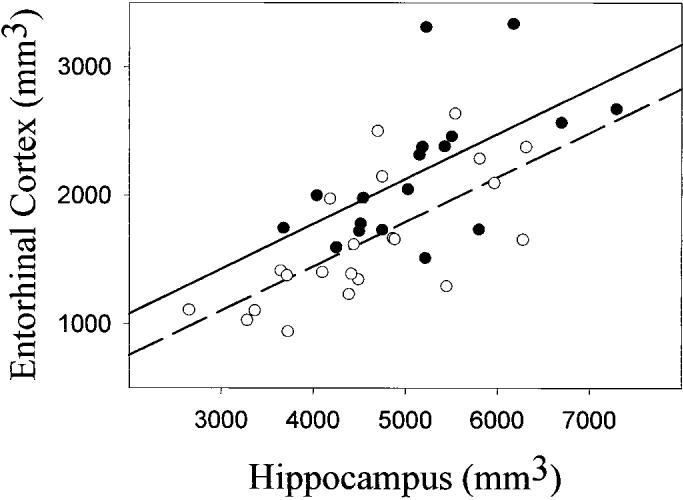
Relationship between entorhinal cortex and hippocampal volumes in subcortical ischemic vascular dementia (SIVD) and AD. SIVD, black circles, solid line, r = 0.59, p < 0.01; AD, open circles, dashed line, r = 0.69, p < 0.01).
Finally, there were correlations between dementia severity measured by MMSE and volume loss of either ERC (r = 0.49; p < 0.001) or hippocampus (r = 0.53; p < 0.001) in the whole group.
Discrimination
Table 4 lists sensitivity, specificity, overall classification, and area under the curve of an ROC analysis of the discrimination between 18 patients with SIVD and 38 cognitively normal subjects. Using hippocampal volume alone, discrimination between SIVD and cognitively normal subjects resulted in 82% overall correct classification (p < 0.01), with 66% sensitivity and 89% specificity and an area under the ROC curve of 0.83. Adding ERC volume to the discrimination model did not improve the classification between subjects with SIVD and cognitively normal subjects (p = 0.09). Classification improved, however, adding to hippocampal volume either volume of cGM (p < 0.01), sGM (p = 0.03), vCSF (p < 0.01), white matter (p = 0.03), or WMSH (p = 0.01). Together, these measures resulted in a 96% overall correct classification of subjects with SIVD and cognitively normal subjects, with 89% sensitivity, 100% specificity, and an area under the ROC curve of 0.96.
Table 4.
Discriminations between groups of elderly subjects with subcortical ischemic vascular dementia and AD and cognitively normal elderly with entorhinal cortex, and hippocampus, and segmentation
| SIVD vs cognitively normal |
SIVD vs AD |
|||||
|---|---|---|---|---|---|---|
| Discrimination | HP | + ERC | + SEG | HP | + ERC | + SEG |
| Sensitivity, % | 66 | 66 | 89 | 50 | 50 | 72 |
| Specificity, % | 89 | 89 | 100 | 73 | 73 | 91 |
| Classification, % | 82 | 82 | 96 | 63 | 63 | 83 |
| AUC | 0.83 | 0.83 | 0.96 | 0.66 | 0.66 | 0.89 |
Sensitivity, specificity, and classification were performed by logistic regression.
SIVD = subcortical ischemic vascular dementia; HP = hippocampus; ERC = entorhinal cortex; SEG = segmentation; AUC = area under the receiver operator characteristics curve.
Also listed in table 4 are sensitivity, specificity, overall classification, and area under the ROC curve for the discrimination between 18 patients with SIVD and 22 patients with AD. Using hippocampal volume alone, discrimination between patients with SIVD and patients with AD resulted in 63% overall correct classification (p < 0.05) with 50% sensitivity, 73% specificity, and an area under the ROC curve of 0.66. Adding ERC volume to the discrimination model did not improve the classification, similar to the discrimination between subjects with SIVD and cognitively normal subjects (p > 0.05). Discrimination improved, however, adding to hippocampal volume either volumes of cGM (p = 0.03), vCSF (p = 0.02), or WMSH (p = 0.02). Together, these measures resulted in an overall correct classification of 83% with 72% sensitivity, 91% specificity, and area under the ROC curve of 0.89.
In addition to MRI measures, we tested the discrimination power of individual neuropsychological tests between AD and SIVD using logistic regression and ROC analysis. Using List Recall Test, the discrimination between AD and SIVD resulted in 73% overall correct classification (p < 0.05) with 61% sensitivity, 82% specificity, and an area under the ROC curve of 0.73. Using Delayed List Recall Test, the discrimination between AD and SIVD resulted in 73% overall correct classification (p < 0.05) with 61% sensitivity, 82% specificity, and an area under the ROC curve of 0.77. Using Mattis Dementia Rating Scale, the discrimination between AD and SIVD resulted in 63% overall correct classification (p < 0.05) with 50% sensitivity, 73% specificity, and an area under the ROC curve of 0.70. Using Letter Verbal Fluency Test, the discrimination between AD and SIVD resulted in 73% overall correct classification (p < 0.01) with 72% sensitivity, 73% specificity, and an area under the ROC curve of 0.85. Together, these neuropsychological tests resulted in an overall correct classification of 93% with 89% sensitivity, 95% specificity, and area under the ROC curve of 0.98.
Discussion
The major findings of this study were, first, that patients with SIVD had smaller ERC and hippocampal volume than cognitively normal subjects; second, that volume losses of ERC and hippocampus were less severe in SIVD than in AD, despite similar levels of dementia severity; third, that volume losses of ERC and hippocampus were similarly correlated in SIVD and AD; and finally, hippocampal and global cerebral volume changes combined improved the discrimination of SIVD from cognitively normal subjects and subjects with AD.
The finding of smaller hippocampal volume in patients with SIVD than in cognitively normal subjects is consistent with previous reports.8,9,27 In addition to hippocampus, our study also demonstrates smaller ERC volume in subjects with SIVD than in cognitively normal subjects, which provides additional evidence that atrophy of limbic structures is not specific for AD. However, atrophies of the ERC and hippocampus were more severe in patients with AD than in patients with SIVD for similar levels of dementia. Furthermore, differences in neuropsychological performances between AD and SIVD did not contribute to variations of ERC and hippocampal volumes, suggesting selective volume loss of ERC and hippocampus in AD and SIVD. Other investigators have reported greater hippocampal atrophy in AD than in vascular dementia.8,9 In addition to hippocampus, our finding that ERC atrophy was also larger in AD than in SIVD is consistent with the hypothesis that Alzheimer pathology impacts limbic structures more severely than vascular pathology. In practice, however, this information may have limited consequences, because the magnitude of ERC and hippocampal atrophy alone may not be sufficient indicators of the extent to which atrophy is associated with AD or vascular pathology. Volume changes of ERC and hippocampus over time may provide more valuable information.
Another major finding was that the relationships between volume losses of ERC and hippocampus were similar in SIVD and AD. This result was unexpected. In accordance with the theory that early AD pathology may start in the ERC before spreading to the hippocampus,10 we assumed that AD pathology(i.e., amyloid plaques and tangles) would damage ERC and hippocampus to a similar extent. In contrast, we expected that ischemia/infarction in SIVD would damage the ERC and hippocampus to varying extents, depending on the location of vascular insults. This expectation is supported by pathologic reports of isolated hippocampal sclerosis, which has been associated with cerebrovascular disease.28
Therefore, volume changes in these structures should be less correlated in SIVD than AD. Our finding of similar correlations between volume losses of ERC and hippocampus in SIVD and AD implies that relationship between volume losses of ERC and hippocampus is not helpful for distinguishing SIVD from AD. In addition, our finding of similar correlations in SIVD and AD implies that deafferentation of afferent pathways to ERC and hippocampus, rather than direct vascular insults as hypothesized, are responsible for volumes loss in ERC and hippocampus. This is also consistent with a previous MRI study from this group that showed a correlation between WMSH and hippocampal volumes in patients with dementia with subcortical vascular disease.23
Another finding was that hippocampal atrophy and global cerebral volume changes together helped to improve classification of subjects with SIVD from cognitively normal subjects and patients with AD. This emphasizes the added values of global atrophy measurements. However, MRI measures did not achieve a better discrimination between AD and SIVD than neuropsychological tests. Further studies on a larger population with unselected subjects are necessary to assess the diagnostic value of MRI volume measurements in comparison with that available with the current clinical methods, ideally substantiated by histopathologic confirmation of SIVD and AD.
A limitation that should be considered when interpreting the findings is that the diagnoses were clinical and not all confirmed by autopsy. Given the overlap between the clinical manifestations in various forms of dementia, this may contribute to the findings. It is likely that AD pathology may contribute to the brain damage in the patients with SIVD and it is also likely that vascular pathology contributed to brain damage in the patients with AD. However, if the patients with SIVD in this study simply had dementia from AD, then it would be expected that their MRI findings would be the same as in AD. The results show that these patients with SIVD had larger ERC, larger hippocampi, and more vCSF spaces than patients with AD, supporting the view that they did not simply have dementia from AD. Notwithstanding the lack of autopsy confirmation, each clinically diagnosed group displayed characteristics that could distinguish them with substantial accuracy, suggesting true differences between the groups. It is possible that these differences would be even greater if pathologic information were available.
Footnotes
Supported in part by NIH grants AG10897, AG12435, the Research Council for Health of the Academy of Finland, and the Alzheimer's Association.
References
- 1.Jellinger K, Danielczyk W, Fischer P, Gabriel E. Clinicopathological analysis of dementia disorders in the elderly. J Neurol Sci. 1990;95:239–258. doi: 10.1016/0022-510x(90)90072-u. [DOI] [PubMed] [Google Scholar]
- 2.Wade JP, Mirsen TR, Hachinski VC, Fisman M, Lau C, Merskey H. The clinical diagnosis of Alzheimer's disease. Arch Neurol. 1987;44:24–29. doi: 10.1001/archneur.1987.00520130016010. [DOI] [PubMed] [Google Scholar]
- 3.Seab JP, Jagust WJ, Wong ST, Roos MS, Reed BR, Budinger TF. Quantitative NMR measurements of hippocampal atrophy in Alzheimer's disease. Magn Reson Med. 1988;8:200–208. doi: 10.1002/mrm.1910080210. [DOI] [PubMed] [Google Scholar]
- 4.Kesslak JP, Nalcioglu O, Cotman CW. Quantification of magnetic resonance scans for hippocampal and parahippocampal atrophy in Alzheimer's disease. Neurology. 1991;41:51–54. doi: 10.1212/wnl.41.1.51. [DOI] [PubMed] [Google Scholar]
- 5.Jack CRJ, Petersen RC, O'Brien PC, Tangalos EG. MR-based hippocampal volumetry in the diagnosis of Alzheimer's disease. Neurology. 1992;42:183–188. doi: 10.1212/wnl.42.1.183. [DOI] [PubMed] [Google Scholar]
- 6.Lehericy S, Baulac M, Chiras J, et al. Amygdalohippocampal MR volume measurements in the early stages of Alzheimer disease. AJNR Am J Neuroradiol. 1994;15:929–937. [PMC free article] [PubMed] [Google Scholar]
- 7.Frisoni GB, Laakso MP, Beltramello A, et al. Hippocampal and entorhinal cortex atrophy in frontotemporal dementia and Alzheimer's disease. Neurology. 1999;52:91–100. doi: 10.1212/wnl.52.1.91. [DOI] [PubMed] [Google Scholar]
- 8.Laakso MP, Partanen K, Riekkinen P, et al. Hippocampal volumes in Alzheimer's disease, Parkinson's disease with and without dementia, and in vascular dementia: an MRI study. Neurology. 1996;46:678–681. doi: 10.1212/wnl.46.3.678. [DOI] [PubMed] [Google Scholar]
- 9.Barber R, Ballard C, McKeith IG, Gholkar A, O'Brien JT. MRI volumetric study of dementia with Lewy bodies: a comparison with AD and vascular dementia. Neurology. 2000;54:1304–1309. doi: 10.1212/wnl.54.6.1304. [DOI] [PubMed] [Google Scholar]
- 10.Braak H, Braak E. Staging of Alzheimer's disease-related neurofibrillary changes. Neurobiol Aging. 1995;16:271–278. doi: 10.1016/0197-4580(95)00021-6. [DOI] [PubMed] [Google Scholar]
- 11.Bobinski M, de Leon MJ, Convit A, et al. MRI of entorhinal cortex in mild Alzheimer's disease. Lancet. 1999;353:38–40. doi: 10.1016/s0140-6736(05)74869-8. [DOI] [PubMed] [Google Scholar]
- 12.Juottonen K, Laakso MP, Partanen K, Soininen H. Comparative MR analysis of the entorhinal cortex and hippocampus in diagnosing Alzheimer disease. AJNR Am J Neuroradiol. 1999;20:139–144. [PubMed] [Google Scholar]
- 13.Xu Y, Jack CJ, O'Brien PC, et al. Usefulness of MRI measures of entorhinal cortex versus hippocampus in AD. Neurology. 2000;54:1760–1767. doi: 10.1212/wnl.54.9.1760. [DOI] [PubMed] [Google Scholar]
- 14.Du AT, Schuff N, Amend D, et al. MRI of entorhinal cortex and hippocampus in mild cognitive impairment and Alzheimer's disease. J Neurol Neurosurg Psychiatry 2001. 2001;71:441–447. doi: 10.1136/jnnp.71.4.441. [DOI] [PMC free article] [PubMed] [Google Scholar]
- 15.Huther G, Dorfl J, Van der Loos H, Jeanmonod D. Microanatomic and vascular aspects of the temporomesial region. Neurosurgery. 1998;43:1118–1136. doi: 10.1097/00006123-199811000-00065. [DOI] [PubMed] [Google Scholar]
- 16.Chui HC, Victoroff JI, Margolin D, Jagust W, Shankle R, Katzman R. Criteria for the diagnosis of ischemic vascular dementia proposed by the State of California Alzheimer's Disease Diagnostic and Treatment Centers. Neurology. 1992;42:473–480. doi: 10.1212/wnl.42.3.473. [DOI] [PubMed] [Google Scholar]
- 17.McKhann G, Drachman D, Folstein M, Katzman R, Price D, Stadlan EM. Clinical diagnosis of Alzheimer's disease: report of the NINCDS-ADRDA Work Group under the auspices of Department of Health and Human Services Task Force on Alzheimer's Disease. Neurology. 1984;34:939–944. doi: 10.1212/wnl.34.7.939. [DOI] [PubMed] [Google Scholar]
- 18.Tierney MC, Black SE, Szalai JP, et al. Recognition memory and verbal fluency differentiate probable Alzheimer disease from subcortical ischemic vascular dementia. Arch Neurol. 2001;58:1654–1659. doi: 10.1001/archneur.58.10.1654. [DOI] [PubMed] [Google Scholar]
- 19.Williams JM. Memory assessment scales. Psychological Assessment Resources; Odessa, FL: 1991. [Google Scholar]
- 20.Mattis S. Dementia rating scale. Psychological Assessment Resources; Odessa, FL: 1998. [Google Scholar]
- 21.Benton AL, Hamsher KD. Multilingual aphasia examination. University of Iowa; Iowa City, IA: 1976. [Google Scholar]
- 22.Hachinski VC, Iliff LD, Zilhka E, et al. Cerebral blood flow in dementia. Arch Neurol. 1975;32:632–637. doi: 10.1001/archneur.1975.00490510088009. [DOI] [PubMed] [Google Scholar]
- 23.Fein G, Di Sclafani V, Tanabe J, et al. Hippocampal and cortical atrophy predict dementia in subcortical ischemic vascular disease. Neurology. 2000;55:1626–1635. doi: 10.1212/wnl.55.11.1626. [DOI] [PMC free article] [PubMed] [Google Scholar]
- 24.Insausti R, Juottonen K, Soininen H, et al. MR volumetric analysis of the human entorhinal, perirhinal, and temporopolar cortices. AJNR Am J Neuroradiol. 1998;19:659–671. [PMC free article] [PubMed] [Google Scholar]
- 25.Watson C, Andermann F, Gloor P, et al. Anatomic basis of amygdaloid and hippocampal volume measurement by magnetic resonance imaging. Neurology. 1992;42:1743–1750. doi: 10.1212/wnl.42.9.1743. [DOI] [PubMed] [Google Scholar]
- 26.Tanabe JL, Amend D, Schuff N, et al. Tissue segmentation of the brain in Alzheimer disease. AJNR Am J Neuroradiol. 1997;18:115–123. [PMC free article] [PubMed] [Google Scholar]
- 27.Libon DJ, Bogdanoff B, Cloud BS, et al. Declarative and procedural learning, quantitative measures of the hippocampus, and subcortical white alterations in Alzheimer's disease and ischaemic vascular dementia. J Clin Exp Neuropsychol. 1998;20:30–41. doi: 10.1076/jcen.20.1.30.1490. [DOI] [PubMed] [Google Scholar]
- 28.Dickson DW, Davies P, Bevona C, et al. Hippocampal sclerosis: a common pathological feature of dementia in very old (≥80 years of age) humans. Acta Neuropathol (Berl) 1994;88:212–221. doi: 10.1007/BF00293396. [DOI] [PubMed] [Google Scholar]