Abstract
Rice (Oryza sativa) is a typical silicon (Si) accumulator and requires a large amount of Si for high-yield production. Recently, a gene (Low silicon rice1 [Lsi1]) encoding a Si transporter was identified in rice roots. Here, we characterized Lsi1 in terms of spatial distribution and temporal variation using both physiological and molecular approaches. Results from a multicompartment transport box experiment showed that the major site for Si uptake was located at the basal zone (>10 mm from the root tip) of the roots rather than at the root tips (<10 mm from the root tip). Consistent with the Si uptake pattern, Lsi1 expression and distribution of the Lsi1 protein were found only in the basal zone of roots. In the basal zones of the seminal, crown, and lateral roots, the Lsi1 protein showed a polar localization at the distal side of both the exodermis and endodermis, where the Casparian bands are formed. This indicates that Lsi1 is required for the transport of Si through the cells of the exodermis and endodermis. Expression of Lsi1 displayed a distinct diurnal pattern. Furthermore, expression was transiently enhanced around the heading stage, which coincides with a high Si requirement during this growth stage. Expression was down-regulated by dehydration stress and abscisic acid, suggesting that expression of Lsi1 may be regulated by abscisic acid.
Silicon (Si) is an important element for plant growth and development. It helps plants overcome many biotic and abiotic stresses (Epstein, 1999; Richmond and Sussman, 2003; Ma, 2004; Ma and Yamaji, 2006). For example, Si increases rice (Oryza sativa) resistance to leaf and neck blast, sheath blight, brown spot, leaf scald, and stem rot (Datnoff and Rodrigues, 2005) and decreases the incidence of powdery mildew in several crops (Fauteux et al., 2005). Si also reduces lodging and alleviates the adverse impact of drought and nutrient imbalance (Ma, 2004). Most of the beneficial effects of Si are realized through Si deposition in cell walls of the epidermal surfaces of leaves, stems, and hulls. Si is taken up in the form of silicic acid and translocated from the roots to the shoots in the same form (Takahashi and Hino, 1978; Casey et al., 2003; Mitani et al., 2005). It is finally deposited in the cell wall materials as a polymer of hydrated amorphous silica, forming silica-cuticle double layers and silica-cellulose double layers in the shoots (Ma and Takahashi, 2002). Deposition of Si enhances the strength and rigidity of cell walls and thus increases the resistance of plants to various stresses. Therefore, the beneficial effects of Si are quantitatively related to the amount of Si accumulated in the shoots. In addition, it has also been suggested that Si induces an active defense system that suppresses plant diseases (Fauteux et al., 2005). For example, Si enhances production of phytoalexins in cucumber (Cucumis sativus) and rice (Fauteux et al., 2005).
Plants differ widely in Si accumulation; the Si concentration of shoots ranges from 0.1% to 10.0% in dry weight. In angiosperms, plants mainly in Gramineae and Cyperaceae show high Si accumulation (Ma and Takahashi, 2002; Hodson et al., 2005). The large difference among plant species in Si accumulation has been attributed to the capability of roots to take up Si (Takahashi et al., 1990; Mitani and Ma, 2005). Rice is able to accumulate Si up to 10% of dry weight in the shoots; this concentration is several-fold higher than those of the essential macronutrients, including nitrogen, phosphorus, and potassium (Savant et al., 1997). High accumulation of Si is required for maximal sustainable rice production (Savant et al., 1997). Physiological studies have shown that Si uptake in rice is mediated by transporters (Raven, 2003; Tamai and Ma, 2003; Mitani and Ma, 2005). Recently, we reported isolation of the first gene (Low silicon rice1 [Lsi1]) that is essential for Si transport in rice roots using a low-Si rice mutant (lsi1; Ma et al., 2006). The (Lsi1) gene encodes an aquaporin-like transmembrane protein that possesses silicic acid permeability. Lsi1 is constitutively expressed mainly in the roots (Ma et al., 2006). Nevertheless, expression is regulated by the Si level to certain extent; a continuous supply of Si resulted in a one-fourth decrease in expression. Further investigation showed that the transport protein is localized on the plasma membrane of the distal side of both exodermis and endodermis cells, where the Casparian strips exist (Ma et al., 2006). In this study, we further characterized the rice Si transporter in terms of spatial distribution and temporal variation in expression using both physiological and molecular approaches.
RESULTS
Si Uptake and Lsi1 Expression in Different Root Regions
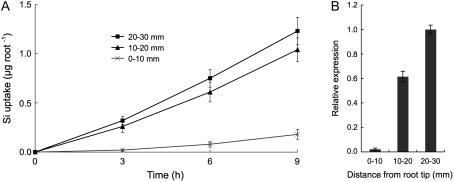
Si uptake by different root regions was investigated with a multicompartment transport box by dividing the primary roots into three regions. Si uptake by the root tip region (0–10 mm) comprising both the apical meristem and the elongation zone was much lower than that by the basal regions (>10 mm from the root tips; Fig. 1A). Si uptake by the region between 10 to 20 mm from the root tips was slightly lower than that by the 20- to 30-mm region, but the difference was not significant (Fig. 1A).
Figure 1.
Regional difference of Si uptake and Lsi1 expression in rice seminal roots. A, Multicompartment transport box experiment. Excised seminal roots were placed in a box consisting of four compartments. One of the three compartments, first (0–10 mm from the root tip), second (10–20 mm), or third (20–30 mm), was exposed to a Si-containing solution individually. Si concentration in the fourth compartment (containing the cut ends) was determined at the times indicated. B, Relative Lsi1 transcript levels at each segment were measured by real-time RT-PCR. Data are means ± sd (n = 3).
The transcript level of Lsi1 was determined in different root regions by quantitative reverse transcription (RT)-PCR. Expression of Lsi1 was much lower in the root tip region between 0 to 10 mm than that in the basal regions (>10 mm; Fig. 1B). This result is in accord with root Si uptake capability measured in different regions (Fig. 1A).
Spatial Distribution of Lsi1 in Relation to Development of an Apoplastic Barrier
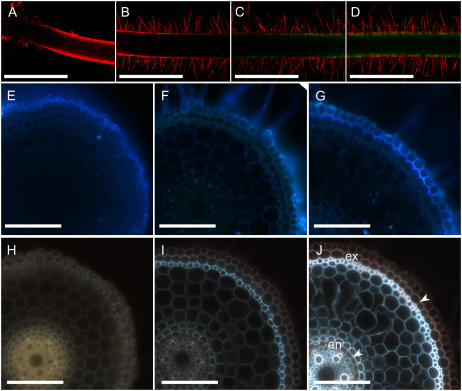
To observe the localization of Lsi1 along the root axis, the open reading frame for Lsi1 was fused with green fluorescent protein (GFP) and expressed in a transgenic rice plant under the control of the Lsi1 promoter region (Ma et al., 2006). No GFP signal was observed in the root tips (<10 mm; Fig. 2, A and B). In contrast, the signal was clearly visible at 15 and 30 mm from the tip (Fig. 2, C and D) and other further basal parts of the root (data not shown). Because the root sample was too thick, GFP fluorescence was only observed at the exodermis, but in a cross section of the root, the signal was observed at both exodermis and endodermis (data not shown).
Figure 2.
Distribution of Lsi1 transporter and development of apoplastic barrier in rice. A to D, Confocal laser-scanning images of root apex (A) and 10 mm (B), 15 mm (C), 30 mm (D) from tip of intact seminal root of Lsi1∷GFP transgenic rice counterstained with propidium iodide. E to G, Cross section at 3 mm (E), 10 mm (F), and 30 mm (G) from the apex of a seminal root prestained with the apoplastic transport dye, Fluostain I, for 2 h. H to J, Cross section at 3 mm (H), 10 mm (I), 30 mm (J) from the apex of a seminal root stained with Fluorol yellow 088 to visualize the suberin lamella (arrowheads). The exodermis (ex) and endodermis (en) are shown. Scale bars = 1 mm (A–D) and 100 μm (E–J).
The apoplastic barrier was examined by staining with Fluostain I, a dye showing pale blue fluorescence after binding to cellulose of the cell walls (Hughes and McCully, 1975). This dye has been used as a tracer of apoplastic solute flow in the roots (Ochiai and Matoh, 2002). At 3 mm from the tip, fluorescence was only observed at the outside of the epidermal cells (Fig. 2E), whereas at 15 and 30 mm from the root tips, fluorescence was observed at both the epidermal cells and the outside of the exodermal cells (Fig. 2, F and G). These results suggest that apoplastic solute flow is stopped at the epidermal cell in the root tip and at the exodermal cells in the basal regions.
Localization of the Casparian bands was also investigated in different root regions by staining the suberinized cell walls with Fluorol yellow 088 (Brundrett et al., 1991). The Casparian bands were absent in the root regions less than 10 mm from the tips (Fig. 2, H and I), but were observed at both the exodermis and endodermis in the basal part of the roots (Fig. 2J).
Cellular Localization of Lsi1 in Different Roots
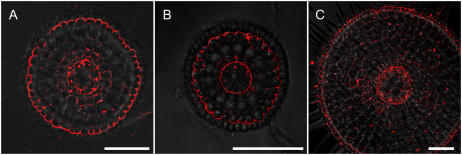
Cellular localization of Lsi1 was examined with an anti-Lsi1 polyclonal antibody in different root types, including seminal, crown, and lateral roots. In all root types, Lsi1 was localized at the distal side of both the exodermis and endodermis (Fig. 3).
Figure 3.
Cellular localization of Lsi1 in different types of rice roots. Roots were stained with anti-Lsi1 polyclonal antibody. A, Seminal root. B, Lateral root. C, Crown root. Scale bar = 100 μm.
Diurnal and Temporal Variation of Lsi1 Expression
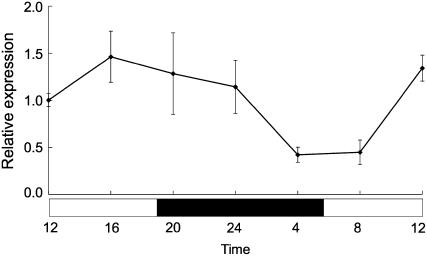
Diurnal changes in Lsi1 expression were investigated by sampling rice roots every 4 h over a 24-h time course. Expression of Lsi1 was the lowest from 4 am to 8 am, but increased from 8 am onward and reached a plateau at around 12 am to 12 pm (Fig. 4). The maximal difference in expression between different time points was about 3-fold.
Figure 4.
Diurnal variation of Lsi1 expression in rice roots. Roots were sampled every 4 h. Lsi1 expression level in the root was measured by real-time RT-PCR. White and black columns indicate the light and dark period, respectively. Data are means ± sd (n = 3).
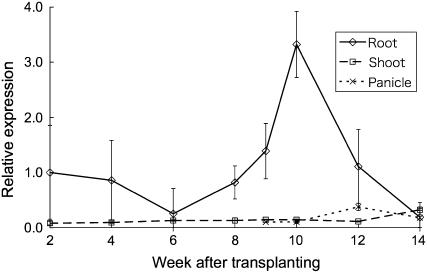
To examine the temporal variation of Lsi1 expression, samples of leaves, roots, and panicles of rice plants grown in a field were taken at different growth stages. Lsi1 was constitutively expressed in the roots but not in the leaves and panicles (Fig. 5). The level of Lsi1 expression in the roots showed a peak around the heading stage (Fig. 5). Expression at other growth stages was similar.
Figure 5.
Developmental variation of Lsi1 expression in different tissues of rice. Rice plants grown in a field were sampled every 2 weeks and at heading (at 9 weeks after transplanting). Lsi1 expression level in the root, shoot, and panicle was measured by real-time RT-PCR. Data are means ± sd (n = 3).
Effect of Dehydration Stress and Abscisic Acid on Lsi1 Expression
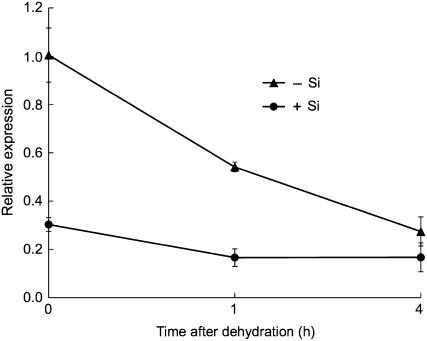
Dehydration stress was imposed by removing roots from the nutrient solution. Lsi1 expression decreased markedly with the duration of dehydration in the roots of the plants that had been cultivated in the solution without Si (−Si plants; Fig. 6). However, in the plants that had received Si (+Si plants), Lsi1 expression was at a lower level and was decreased only slightly by dehydration (Fig. 6). At 4 h after dehydration, Lsi1 expression reached a similar level in the −Si and +Si plants.
Figure 6.
Effect of dehydration on Lsi1 expression in rice roots. Rice seedlings precultured with or without 1 mm Si for 3 d was used. Dehydration was induced by removal of the nutrient solution. Lsi1 expression level in the root was measured by real-time RT-PCR. Data are means ± sd (n = 3).
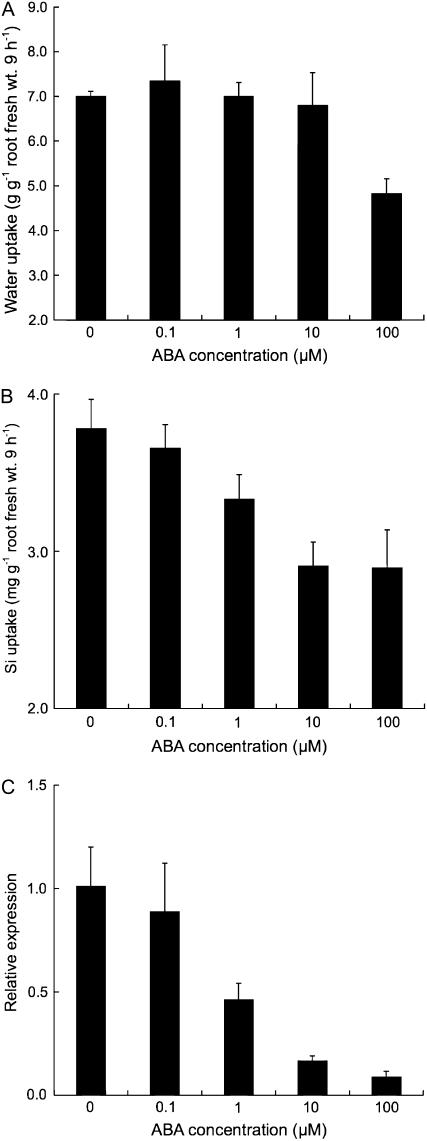
The effects of abscisic acid (ABA) on water and Si uptake and Lsi1 expression were investigated. Addition of ABA up to 10 μm did not affect water uptake (Fig. 7A), whereas ABA at 100 μm decreased water uptake. Both Si uptake and Lsi1 expression decreased with increasing ABA concentration (Fig. 7, B and C).
Figure 7.
Effect of ABA on Lsi1 expression and Si and water uptake in rice. The uptake experiment was conducted in a nutrient solution containing 1 mm Si in the presence of various concentrations of ABA. Water uptake (A), Si uptake (B), and Lsi1 expression (C) were measured at 9 h. Data are means ± sd (n = 3).
DISCUSSION
Localization of Si Uptake Site, Lsi1 Expression, and Spatial Distribution of Lsi1
Lsi1 is the first identified gene responsible for Si uptake in higher plants (Ma et al., 2006). This gene plays a crucial role in Si uptake in rice because mutation of this gene resulted in a remarkable decrease in Si uptake and accumulation (Ma et al., 2002, 2004). To gain further insight into the molecular mechanism of Si uptake in rice, in this study we investigated Si uptake, Lsi1 expression, and spatial distribution of Lsi1 along the longitudinal axis of the developing rice roots. Roots vary both anatomically and physiologically along their longitudinal axes. In general, the rate of ion uptake per unit root length declines from the root apex to the basal region (Marschner, 1995). For example, uptake of magnesium and calcium is much higher in the apical than in the basal root zones (Ferguson and Clarkson, 1976; Häussling et al., 1988). However, uptake of phosphorus and potassium is less affected by root structural development compared with that of calcium; both apical and basal regions of the roots take up phosphorus and potassium (Harrison-Murray and Clarkson, 1973). Results from this study clearly show that Si uptake does not follow either pattern. In contrast to other minerals, Si uptake by the root tips was much lower than that by the basal regions (Fig. 1A), indicating that the major sites of Si uptake are located at the basal root zone rather than the apical zone, including the root caps, apical meristem, and elongation zones. The longitudinal pattern of Si uptake is in agreement with expression of Lsi1 in different root regions (Fig. 1B) and also with distribution of Lsi1-GFP fusion protein in the transgenic rice root (Fig. 2, A–D). Taken together, our results indicate that Lsi1 is a dominant transporter for high Si uptake in rice roots.
For the radial transport of a mineral from the external solution to the xylem, a series of concentric cell layers must be crossed, including the epidermis, exodermis, cortex cells, endodermis, pericycle, and xylem parenchyma. The presence of physiological barriers, such as the Casparian band, usually prevents free pass into the stele. In this study, we investigated the localization of Lsi1 in relation to the development of a physiological barrier and the Casparian band. In the root tips (<10 mm), formation of the Casparian band was not observed (Fig. 2, H and I); yet, an apoplastic dye could not penetrate the root surface in the root tip zone (Fig. 2E), suggesting the presence of a physiological barrier other than the Casparian band. This barrier was also observed in a previous study, although its nature has not been identified (Ochiai and Matoh, 2002). Therefore, a much lower Si uptake in the root tip zone could be ascribed to both the absence of the Si transporter Lsi1 and the presence of a physiological barrier. In the basal root zones, the Casparian band was observed at both the exodermis and endodermis (Fig. 2J). Lsi1 was also localized in the same cells (Fig. 3). This demonstrates that Lsi1 is required for the influx transport of Si across the Casparian band at the exodermis and endodermis (Figs. 2 and 3). In fact, Si is deposited in the endodermis of the rice root (Parry and Soni, 1972), indicating that Si is not able to pass through the endodermis freely. Similarly, symplastic movement of calcium across the exodermis and the endodermis was reported in onion (Allium cepa) roots (Cholewa and Peterson, 2004).
The rice root system consists of seminal, crown, and lateral roots. Lateral roots play an important role in Si uptake (Ma et al., 2001). Regardless of different roots, the Lsi1 protein is localized anisotropically in the distal sides of both the exodermis and endodermis (Fig. 3; see also Ma et al., 2006). Such polar localization of plant nutrient transporters was also reported for the maize (Zea mays) water channel, ZmPIP2;5 (Hachez et al., 2006) and the potato (Solanum tuberosum) phosphate transporter, StPT2 (Gordon-Weeks et al., 2003). However, in contrast to Lsi1, polar localization of ZmPIP2;5 was observed only in the epidermis even though the protein was found in all root cells, whereas StPT2 is located at the apical surface of the epidermal plasma membrane in the root elongation zone. Localization of Lsi1 also differs from that of other transporters for essential nutrients (e.g. nitrate, phosphate, potassium, sulfate, and iron), which are expressed in the epidermal cells (Huang et al., 1996; Vert et al., 2002; Buchner et al., 2004; Ashley et al., 2006; Murata et al., 2006). This difference is also reflected in the role of root hairs in mineral uptake. In contrast to the important role of root hairs for the uptake of other essential nutrients (e.g. Huang et al., 1996; Vert et al., 2002; Buchner et al., 2004; Ashley et al., 2006), root hairs do not contribute to Si uptake because they lack the Si transporter Lsi1 (Ma et al., 2001, 2006). These differences might be attributed to the chemical properties of different minerals. At a pH below 9, Si is present in the form of silicic acid as uncharged molecules. Therefore, different from other ionic mineral nutrients, which may be bound by the cell wall of the epidermal cells, Si can pass through the apoplast of the epidermal layer without binding to the cell wall.
Rice roots are characterized by the formation of the aerenchyma, which is accompanied by the destruction of almost all cortex cells except the exodermis and endodermis. Therefore, Si transported through the exodermis is released to the apoplast of a spoke-like structure across the aerenchyma. This anatomical structure probably explains why Lsi1 is also required to be localized at the endodermis for efficient transport of Si into the stele.
Diurnal and Temporal Variation in Lsi1 Expression
Lsi1 belongs to the NOD26-like intrinsic protein subfamily of aquaporins. It has been shown that some aquaporin genes display diurnal changes in their expression. For example, expression of maize ZmPIP1-1 and ZmPIP2-5 showed a peak at 2 to 4 h after the beginning of the light period (Lopez et al., 2003). In rice, expression of OsPIP2;4 and OsPIP2;5 showed a peak at 3 h after the onset of light and decreased to a minimum at 3 h after the onset of darkness (Sakurai et al., 2005). In this study, we also observed a diurnal change in the expression of Lsi1 (Fig. 4), although there are differences in the expression between Lsi1 and other aquaporin genes; Lsi1 expression was high throughout the period from 12 pm to 12 am (the start of the light period is at 5 am), but low from 4 am to 8 am. Furthermore, fluctuation of Lsi1 expression during a day was not as large as that reported for other aquaporin genes.
There was a peak in the expression of Lsi1 during the whole growth and development period of rice (Fig. 5). This peak appeared around the heading stage (9–10 weeks after transplanting; Fig. 5). A previous study showed that 67% of total Si was taken up during the reproductive stage from panicle initiation to heading in rice (Ma et al., 1989). Deficiency of Si during this stage resulted in significant reduction in the grain yield, suggesting that high Si uptake during this period is required for producing a high yield. Therefore, the increased expression of Lsi1 during the heading stage may reflect a high requirement of Si during this period.
Effect of ABA on Lsi1 Expression
Although Lsi1 is constitutively expressed in the roots, expression was down-regulated by Si supply (Fig. 5; Ma et al., 2006). However, signal control of Lsi1 expression remains unknown. Previous studies indicated that some plant aquaporin genes are regulated by drought stress and ABA (Alexandersson et al., 2005; Zhu et al., 2005). For example, both positive and negative effects of salt and ABA on transcription of aquaporin genes were reported, depending on the concentration and duration of the treatment (Zhu et al., 2005). Lsi1 expression decreased in response to dehydration stress (Fig. 6). The decrease was more evident in the −Si plants than in the +Si plants. It is well documented that high accumulation of Si decreases transpiration by 30% (Ma and Takahashi, 2002). Therefore, the difference in response to dehydration stress between the −Si and +Si plants may be attributed to the Si-induced decrease of transpiration, resulting in rapid response to dehydration in the −Si plants.
ABA is known to accumulate in response to water stress. Therefore, it is possible that decreased expression of Lsi1 under dehydration stress is caused by increased ABA. To examine this possibility, the effect of ABA on Lsi1 expression was investigated in this study. Lsi1 expression was markedly suppressed by ABA in a dose-response manner (Fig. 7C) concurrently with root Si uptake (Fig. 7B). Because water uptake was not affected by ABA up to 10 μm, it is possible that ABA directly regulates Lsi1 expression, leading to reduced Si uptake (Fig. 7). In fact, in the promoter region of Lsi1, there exists an ABA-responsive domain. It will be interesting to elucidate how ABA regulates Lsi1 expression in the future.
In conclusion, the major sites for Si uptake are accommodated in the basal zone of rice roots, where the Si transporter Lsi1 is also localized. Lsi1 displays polar localization in the exodermis and endodermis of seminal, crown, and lateral roots. High expression of Lsi1 during the reproductive stage reflects the high requirement of Si during this stage. Expression of Lsi1 is down-regulated by ABA.
MATERIALS AND METHODS
Plant Materials and Growth Condition
Seeds of rice (Oryza sativa L. cv Nipponbare) were soaked in water overnight at 25°C in the dark. Seeds were then transferred to a net floated on 0.5 mm CaCl2 solution in a plastic container. On day 7, seedlings were transferred to a 3.5-L plastic pot containing one-half-strength Kimura B solution and grown in a greenhouse at 22°C to 25°C. Composition of the nutrient solution was described previously (Ma et al., 2001). The pH of this solution was 5.6 and the nutrient solution was renewed every 2 d. For the field experiment, seedlings prepared as above were transplanted to a field and grown from June to September in 2005. All experiments were carried out with three replicates.
Multicompartment Transport Box Experiment
Uptake of Si by different zones of roots was examined using a multicompartment transport box as described previously (Ma et al., 2001). Briefly, 15 excised roots each (40-mm long) from 1-week-old seedlings were placed in a box consisting of four compartments (14-mm height × 47-mm length × 10-mm width). Each compartment was isolated by acrylic resin plates (4-mm wide) sealed with white petroleum jelly. Four milliliters of the nutrient solution containing 1.5 mm Si were added to the first, second, or third compartment, while 4 mL of the nutrient solution without Si were added to the remaining compartments. Si was supplied as silicic acid, which was prepared by passing potassium silicate through a cationic exchange resin (Ma et al., 2001). At 3, 6, and 9 h, the solution in each compartment was replaced with fresh solution and the Si concentration in each compartment was determined by the colorimetric molybdenum blue method (Mitani and Ma, 2005). The amount of Si exuded in the fourth compartment containing the cut ends of the roots was calculated.
Effect of Dehydration and ABA on Lsi1 Expression
For dehydration experiments, 10-d-old rice seedlings that had been grown hydroponically with or without 1 mm Si for 3 d were used. Dehydration was induced by removing the nutrient solution. Root samples were taken at 1 and 4 h after initiation of the dehydration treatment and frozen in liquid nitrogen.
To investigate the effect of ABA on Lsi1 expression, Si, and water uptake, 4-week-old seedlings were exposed to nutrient solution containing 1 mm Si in the presence of various concentrations of ABA (0.1, 1, 10, 100 μm) in a 50-mL black bottle. At 9 h, Si concentration in the solution was measured and transpiration (water loss) was also recorded as described previously (Ma et al., 2001). The roots and shoots were harvested separately and their fresh weights were recorded before the samples were used for RNA extraction.
Diurnal and Developmental Variation of Lsi1 Expression
To investigate the diurnal change, root samples of 10-d-old seedlings were taken every 4 h over a 24-h period. Variation in Lsi1 expression between different growth stages was investigated by taking the root, shoot, and panicle samples of rice grown in the field every 2 weeks plus at the heading stage (at 9 weeks) after transplanting. All samples were immediately frozen in liquid nitrogen and stored at −80°C for RNA extraction as described below.
Quantitative RT-PCR
Total RNA was extracted from the roots, shoots, and panicles using an RNeasy plant extraction minikit (Qiagen) according to the manufacturer's instructions. First-strand cDNA was synthesized from 1 μg of total RNA using an oligo(dT)18 primer and SuperScript first-strand synthesis system for RT-PCR (Invitrogen). Relative transcript levels of Lsi1 and Actin (internal control) were measured as described previously (Ma et al., 2006). Quantitative real-time PCR was performed in a 20-μL reaction volume containing 2 μL of 1:5 diluted cDNA, 200 nm each gene-specific primers, and SYBR Premix Ex Taq (Takara Bio) using Applied Biosystems 7500. Primer sequences used are Lsi1, 5′-CGGTGGATGTGATCGGAACCA-3′ (forward) and 5′-CGTCGAACTTGTTGCTCGCCA-3′ (reverse); Actin, 5′-GACTCTGGTGATGGTGTCAGC-3′ (forward) and 5′-GGCTGGAAGAGGACCTCAGG-3′ (reverse).
Localization of Lsi1-GFP along the Root Axis
A construct containing the 2-kb promoter region and Lsi1 cDNA fused with GFP was introduced to rice calluses (cv Nipponbare) using an Agrobacterium-mediated transformation system as described previously (Ma et al., 2006). Regenerated T2 seedlings were used for fluorescence observation. The roots were counterstained with propidium iodide (5 mg mL−1) for 3 min. The observation was made with a laser-scanning confocal microscope (LSM510; Carl Zeiss).
Immunohistological Staining
Lsi1 immunostaining was performed according to the method previously described (Murata et al., 2006). The synthetic peptide C-ADDVDEMEN (positions 287–295 of Lsi1) was used to immunize rabbits to obtain antibodies against Lsi1. Rice roots, including seminal, crown, and lateral roots, were fixed in 4% (w/v) paraformaldehyde and 60 mm Suc buffered with 50 mm cacodylic acid (pH 7.4) for 2 h at room temperature with occasional degassing. After three washes with 60 mm Suc and 50 mm cacodylic acid (pH 7.4), the fixed samples were embedded in 5% agar and sectioned 80-μm thick with a microslicer (ZERO 1; Dosaka EM). Sections were placed on microscope slides, incubated with phosphate-buffered saline (PBS; 10 mm PBS, pH 7.4, 138 mm NaCl, 2.7 mm KCl) containing 0.1% (w/v) pectolyase Y-23 (Seishin) at 30°C for 2 h and then reincubated in PBS containing 0.3% (v/v) Triton X-100 at 30°C for 2 h, washed three times with PBS, and blocked with 5% (w/v) bovine serum albumin in PBS. Slides were incubated in a 37°C chamber with the purified rabbit anti-Lsi1 polyclonal antibodies (1:100 dilution in PBS). After three washes in PBS and blocking with 5% (w/v) bovine serum albumin in PBS, the slides were exposed to secondary antibodies (Alexa Fluor 555 goat anti-rabbit IgG; Molecular Probes) for 2 h at room temperature, washed five times in PBS, and mounted with 50% (v/v) glycerol in PBS. Samples were examined with a laser-scanning confocal microscope (LSM510; Carl Zeiss).
Cell Wall Staining with Apoplastic Transport Dye
Intact rice roots were exposed to nutrient solution containing an apoplastic transport dye fluostain I (Sigma) at 0.005%. After 2 h, free-hand cross sections at different root zones were prepared and then observed with fluorescence microscopy under UV excitation.
Staining of the Casparian Bands
The Casparian bands were observed after root cross sections at different root zones were stained with 0.01% Fluorol yellow 088 (Brundrett et al., 1991) for 1 h and then observed with fluorescence microscopy under UV excitation.
Sequence data from this article can be found in the GenBank/EMBL data libraries under accession number AB222272.
Acknowledgments
We thank Kazunori Tamai for his assistance in the measurement of Si uptake and Lawrence Datnoff and Fangjie Zhao for their critical reading of this manuscript.
This work was supported by a Grant-in-Aid for Scientific Research on Priority Areas from the Ministry of Education, Culture, Sports, Science and Technology of Japan (grant nos. 15380053 and 17078008 to J.F.M.) and a grant from the Ministry of Agriculture, Forestry and Fisheries of Japan (Rice Genome Project IP–5003 to J.F.M.).
The author responsible for distribution of materials integral to the findings presented in this article in accordance with the policy described in the Instructions for Authors (www.plantphysiol.org) is: Jian Feng Ma (maj@rib.okayama-u.ac.jp).
References
- Alexandersson E, Fraysse L, Sjövall-Larsen S, Gustavsson S, Fellert M, Karlsson M, Johanson U, Kjellbom P (2005) Whole gene family expression and drought stress regulation of aquaporins. Plant Mol Biol 59 469–484 [DOI] [PubMed] [Google Scholar]
- Ashley MK, Grant M, Grabov A (2006) Plant responses to potassium deficiencies: a role for potassium transport proteins. J Exp Bot 57 425–436 [DOI] [PubMed] [Google Scholar]
- Brundrett MC, Kendrick B, Peterson CA (1991) Efficient lipid staining in plant material with sudan red 7B or fluorol yellow 088 in polyethylene glycol-glycerol. Biotech Histochem 66 111–116 [DOI] [PubMed] [Google Scholar]
- Buchner P, Takahashi H, Hawkesford MJ (2004) Plant sulphate transporters: co-ordination of uptake, intracellular and long-distance transport. J Exp Bot 55 1765–1773 [DOI] [PubMed] [Google Scholar]
- Casey WH, Kinrade SD, Knight CTG, Rains DW, Epstein E (2003) Aqueous silicate complexes in wheat, Triticum aestivum L. Plant Cell Environ 27 51–54 [Google Scholar]
- Cholewa E, Peterson CA (2004) Evidence for symplastic involvement in the radial movement of calcium in onion roots. Plant Physiol 134 1793–1802 [DOI] [PMC free article] [PubMed] [Google Scholar]
- Datnoff LE, Rodrigues FÁ (2005) The role of silicon in suppressing rice diseases. APSnet Features. http://apsnet.org/online/feature/silicon/ (February, 2005)
- Epstein E (1999) Silicon. Annu Rev Plant Physiol Plant Mol Biol 50 641–664 [DOI] [PubMed] [Google Scholar]
- Fauteux F, Remus-Borel W, Menzies JG, Belanger RR (2005) Silicon and plant disease resistance against pathogenic fungi. FEMS Microbiol Lett 249 1–6 [DOI] [PubMed] [Google Scholar]
- Ferguson IB, Clarkson DT (1976) Simultaneous uptake and translocation of magnesium and calcium in barley (Hordeum vulgare L.) roots. Planta 128 267–269 [DOI] [PubMed] [Google Scholar]
- Gordon-Weeks R, Tong Y, Davies TGE, Leggewie G (2003) Restricted spatial expression of a high-affinity phosphate transporter in potato roots. J Cell Sci 116 3135–3144 [DOI] [PubMed] [Google Scholar]
- Hachez C, Moshelion M, Zelazny E, Cavez D, Chaumont F (2006) Localization and quantification of plasma membrane aquaporin expression in maize primary root: a clue to understanding their role as cellular plumbers. Plant Mol Biol 62 305–323 [DOI] [PubMed] [Google Scholar]
- Harrison-Murray RS, Clarkson DT (1973) Relationships between structural development and the absorption of ions by the root system of Cucurbita pepo. Planta 114 1–16 [DOI] [PubMed] [Google Scholar]
- Häussling M, Jorns CA, Lehmbecker G, Hecht-Buchholz C, Marschner H (1988) Ion and water uptake in relation to root development in Norway spruce (Picea abies (L.) Karst.). J Plant Physiol 133 486–491 [Google Scholar]
- Hodson MJ, White PJ, Mead A, Broadley MR (2005) Phylogenetic variation in the silicon composition of plants. Ann Bot (Lond) 96 1027–1046 [DOI] [PMC free article] [PubMed] [Google Scholar]
- Huang NC, Chiang CS, Crawford NM, Tsay YF (1996) CHL1 encodes a component of the low-affinity nitrate uptake system in Arabidopsis and shows cell type-specific expression in roots. Plant Cell 8 2183–2191 [DOI] [PMC free article] [PubMed] [Google Scholar]
- Hughes J, McCully ME (1975) The use of an optical brightener in the study of plant structure. Stain Technol 50 319–329 [DOI] [PubMed] [Google Scholar]
- Lopez F, Bousser A, Sissoëff I, Gaspar M, Lachaise B, Hoarau J, Mahé A (2003) Diurnal regulation of water transport and aquaporin gene expression in maize roots: contribution of PIP2 proteins. Plant Cell Physiol 44 1384–1395 [DOI] [PubMed] [Google Scholar]
- Ma JF (2004) Role of silicon in enhancing the resistance of plants to biotic and abiotic stresses. Soil Sci Plant Nutr 50 11–18 [Google Scholar]
- Ma JF, Goto S, Tamai K, Ichii M (2001) Role of root hairs and lateral roots in silicon uptake by rice. Plant Physiol 127 1773–1780 [PMC free article] [PubMed] [Google Scholar]
- Ma JF, Mitani N, Nagao S, Konishi S, Tamai K, Iwashita T, Yano M (2004) Characterization of Si uptake system and molecular mapping of Si transporter gene in rice. Plant Physiol 136 3284–3289 [DOI] [PMC free article] [PubMed] [Google Scholar]
- Ma JF, Nishimura K, Takahashi E (1989) Effect of silicon on the growth of rice plant at different growth stages. Soil Sci Plant Nutr 35 347–356 [Google Scholar]
- Ma JF, Takahashi E (2002) Soil, Fertilizer, and Plant Silicon Research in Japan. Elsevier Science, Amsterdam
- Ma JF, Tamai K, Ichii M, Wu K (2002) A rice mutant defective in active Si uptake. Plant Physiol 130 2111–2117 [DOI] [PMC free article] [PubMed] [Google Scholar]
- Ma JF, Tamai K, Yamaji N, Mitani N, Konishi S, Katsuhara M, Ishiguro M, Murata Y, Yano M (2006) A silicon transporter in rice. Nature 440 688–691 [DOI] [PubMed] [Google Scholar]
- Ma JF, Yamaji N (2006) Silicon uptake and accumulation in higher plants. Trends Plant Sci 11 392–397 [DOI] [PubMed] [Google Scholar]
- Marschner H (1995) Nutritional physiology. In H Marschner, ed, Mineral Nutrition of Higher Plants. Academic Press Limited, London, pp 18–30, 313–363
- Mitani N, Ma JF (2005) Uptake system of silicon in different plant species. J Exp Bot 56 1255–1261 [DOI] [PubMed] [Google Scholar]
- Mitani N, Ma JF, Iwashita T (2005) Identification of the silicon form in xylem sap of rice (Oryza sativa L.). Plant Cell Physiol 46 279–283 [DOI] [PubMed] [Google Scholar]
- Murata Y, Ma JF, Yamaji N, Ueno D, Nomoto K, Iwashita T (2006) A specific transporter for iron(III)-phytosiderophore in barley roots. Plant J 46 563–572 [DOI] [PubMed] [Google Scholar]
- Ochiai K, Matoh T (2002) Characterization of the Na+ delivery from roots to shoots in rice under saline stress: excessive salt enhances apoplastic transport in rice plants. Soil Sci Plant Nutr 48 371–378 [Google Scholar]
- Parry DW, Soni SL (1972) Electron-probe microanalysis of silicon in the roots of Oryza sativa L. Ann Bot (Lond) 36 781–783 [Google Scholar]
- Raven JA (2003) Cycling silicon—the role of accumulation in plants. New Phytol 158 419–430 [DOI] [PubMed] [Google Scholar]
- Richmond KE, Sussman M (2003) Got silicon? The non-essential beneficial plant nutrient. Curr Opin Plant Biol 6 268–272 [DOI] [PubMed] [Google Scholar]
- Sakurai J, Ishikawa F, Yamaguchi T, Uemura M, Maeshima M (2005) Identification of 33 rice aquaporin genes and analysis of their expression and function. Plant Cell Physiol 46 1568–1577 [DOI] [PubMed] [Google Scholar]
- Savant NK, Snyder GH, Datnoff LE (1997) Silicon management and sustainable rice production. In DL Sparks, ed, Advances in Agronomy, Vol 58. Academic Press, San Diego, pp 151–199
- Takahashi E, Hino K (1978) Silica uptake by plant with special reference to the forms of dissolved silica. J Soil Sci Manure Jpn 49 357–360 [Google Scholar]
- Takahashi E, Ma JF, Miyake Y (1990) The possibility of silicon as an essential element for higher plants. Comments Agr Food Chem 2 99–122 [Google Scholar]
- Tamai K, Ma JF (2003) Characterization of silicon uptake by rice roots. New Phytol 158 431–436 [DOI] [PubMed] [Google Scholar]
- Vert G, Grotz N, Dédaldéchamp F, Gaymard F, Guerinot ML, Briat JF, Curie C (2002) IRT1, an Arabidopsis transporter essential for iron uptake from the soil and for plant growth. Plant Cell 14 1223–1233 [DOI] [PMC free article] [PubMed] [Google Scholar]
- Zhu C, Schraut D, Hartung W, Schäffner AR (2005) Differential responses of maize MIP genes to salt stress and ABA. J Exp Bot 56 2971–2981 [DOI] [PubMed] [Google Scholar]


