Abstract
Perceptual transparency is a surprising phenomenon in which a number of regions of different shades organize into overlaying transparent objects. We recorded single neuron responses from Macaca mulatta area V2 to a display of two bright and two dark squares that appeared as two overlaying bars. We found that neurons assign border ownership according to the transparent interpretation, representing the shapes of the bars rather than the squares.
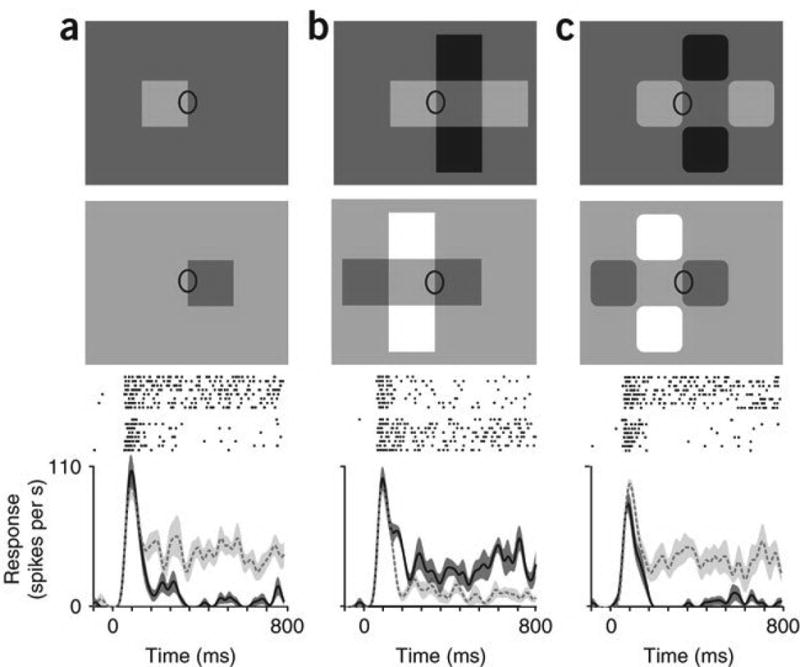
Perceptual transparency has been studied extensively1, 2, 3, but the underlying neural mechanisms have rarely been investigated4, presumably because of the uncertainty about how transparency is coded in the neural activity. A tool for studying transparency is provided by recent work on figure-ground coding in which neurons in the visual cortex were found to signal the assignment of borders to regions (‘border ownership’)5, 6. Perception of transparency is linked to border ownership assignment. For example, the border marked by an ellipse in Figure 1a is part of the contour of the small square. However, in Figure 1b it is perceived as the edge of a transparent vertical bar. The light and dark regions abutting within the ellipse are exactly the same, but their interpretation by the visual system has changed. When the corners of the light and dark squares are rounded off (Fig. 1c), transparency is no longer perceived, and the marked edge again appears as the contour of the small square. The assignment of the edge to one or the other side determines which shapes are perceived. Thus, resolving transparency and assigning border ownership are fundamental operations for the interpretation of images7, 8.
Figure 1. Neural border ownership assignment in situations of transparent overlay.

(a–c) A V2 neuron was tested with three different configurations, one of which appears as a transparent overlay of two bars (b). Each configuration was applied in two mirror-image versions with local edge contrast preserved, as illustrated in the two rows of displays (ellipse marks the location of the receptive field). Below, raster plots represent corresponding responses of the neuron. The curves show the smoothed mean firing rate; shaded region indicates ± s.e.m. Dashed line and light shading correspond to the top displays; solid line and dark shading correspond to the bottom displays. Displays with the opposite contrast polarity (not illustrated) were also tested; raster plots and curves include the responses for both polarities. Typically, the squares measured 3° on a side, with luminances of 93, 62, 32 and 2 cd m−2 for white, light gray, dark gray and black, respectively. Single neuron responses were recorded from the visual cortex of macaques during behaviorally induced fixation. See Supplementary Note.
In the secondary cortical area V2, a large fraction of orientation-selective neurons respond to the same local contrast border with different strength depending on whether the border is the contour of a figure on one side of the receptive field or the other5. The differential firing rate of opponent pairs of such neurons is thought to signal border ownership5, 6. These findings relate to the task of figure-ground segregation, a process that assigns order to surfaces in depth. The phenomenon of transparency is different in that it does not imply depth ordering. Our transparency configuration (Fig. 1b) can be perceived as a shadow cast across a white object (or as a beam of light across a dark object) without implication of depth. Thus, the system does not rely on depth cues to resolve transparency. How do neurons respond to transparent overlay? We measured the responses of a V2 neuron to three different object configurations (Fig. 1a–c). The marked edges were presented in the receptive field (Fig. 1, ellipses) at the neuron’s preferred orientation. Each figure was also flipped about this edge and the contrast was reversed (Fig. 1a–c, lower images), so that the edge in the receptive field was identical in all figures. The transparent configuration differed from the single-square display only in the addition of three squares, all of which were well outside the classical receptive field of the neuron (the center square was the same gray as the background). The neuron’s response to the isolated square was strongest when the square was to the left of the receptive field (Fig. 1a, top). However, our transparency configuration elicited the strongest response for the flipped configuration (Fig. 1b, lower) in which the apparent bar was to the left, and the square to the right of the receptive field, in agreement with the perception of border ownership. When the corners of the squares were rounded off and the marked edge again appeared as the contour of the small square, the neuron responded most strongly when the small square was to the left of the receptive field (Fig. 1c, top).
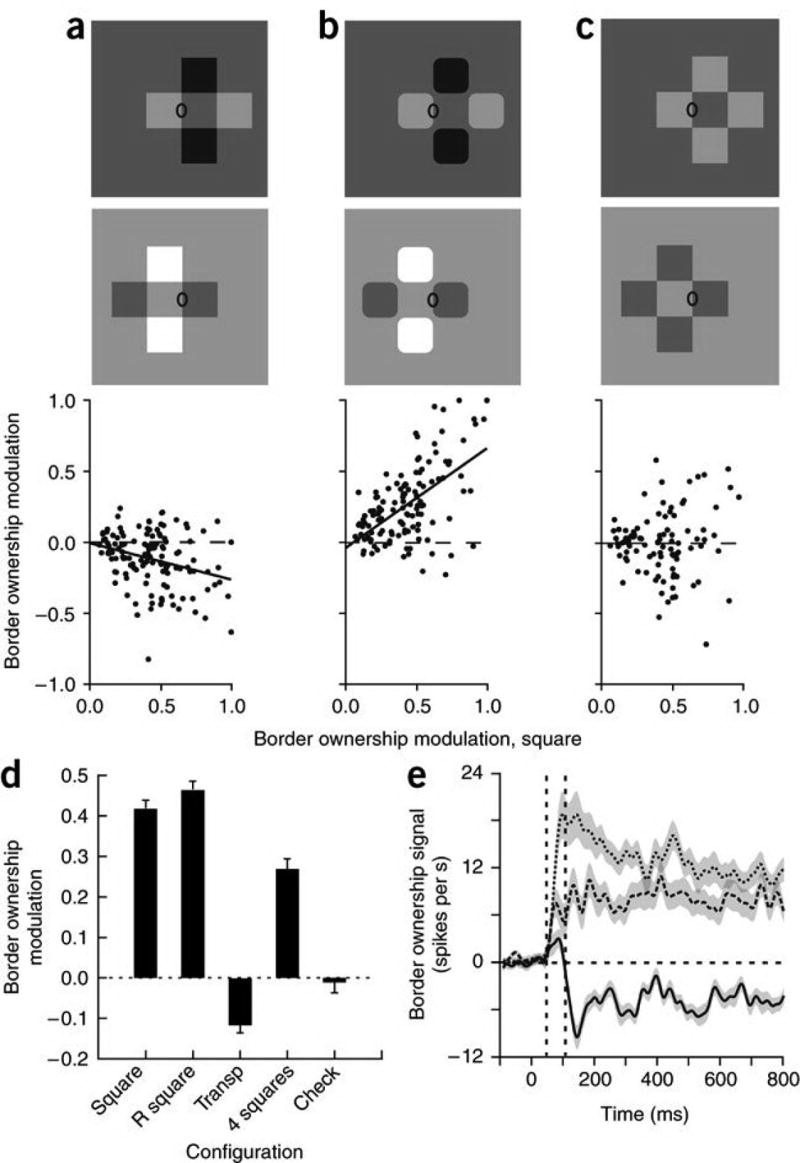
To characterize the behavior of each cell, we calculated a border ownership modulation index (the normalized difference in firing rate produced by flipping the configuration, assigning the sign of the difference for each neuron according to the preferred side for the single square condition; see Supplementary Note online). We compared our transparency configuration (Fig. 2a), a configuration of squares with rounded corners (Fig. 2b), and a ‘checkerboard’ configuration (Fig. 2c). This last configuration included four squares of the same contrast polarity. It does not suggest transparency: it is perceived as five squares rather than two crossed bars. We plotted the modulation index for these three configurations against the modulation index for the single square. Only cells with significant modulation in the single square condition were included (P < 0.05, 127 of 244, Fig. 2a,b; 100 of 173, Fig. 2c). The response modulation for the transparent bars tended to be negative (90 of 127, P = 2.5 × 10⁻⁶, proportion test; negative modulation significant at P < 0.05 in 30 cells, ANOVA), and was negatively correlated with that for the single square, whereas modulation for the rounded square configuration tended to be positive and positively correlated. The index for the checkerboard pattern showed no correlation with the index for the single square.
Figure 2. The influence of transparency cues on neural border ownership signals in V2.

(a–c) Scatter plots of the border ownership modulation index for the illustrated configurations as a function of the index for an isolated square (a,b, n = 127; c, n = 100). (d) Mean modulation index with s.e.m. for a square, a square with rounded corners (R square) and configurations a (Transp), b (4 squares) and c (Check). The transparent cross produced negative modulation (that is, modulation opposite to that of a single square); the four rounded squares produced positive, but reduced, modulation; and the checkerboard produced no modulation, on average. (e) Time course of the mean border ownership signal for isolated square (dashed line), four rounded squares (dashed, bold line) and transparent cross (solid line) in the cells that showed reversal of modulation in the transparent condition (n = 90). Shaded areas indicate ± s.e.m. Note the delayed reversal of the border ownership signal in the transparent condition.
We compared the mean values of the modulation index for five configurations: a square, a square with rounded corners, the transparent cross, the four rounded squares and the checkerboard (Fig. 2d). The single squares of both types produced virtually the same degree of border ownership modulation, whereas the four rounded squares produced a somewhat lower modulation. The checkerboard pattern produced zero net modulation, which is consistent with the observation that, in this case, the test edge can be associated with either the left square or the central square. In the transparent condition, border ownership modulation was reversed. This reversal is notable considering the subtle difference between the configurations (Fig. 2a,b): the presence or absence of ‘X junctions’9. The negative modulation for the transparent cross means that the square regions forming the arms of the cross are not represented as squares—they do not own the fourth edge—but as the ends of two crossed bars.
We determined a time course of the border ownership signal (firing-rate difference) for the single square, the control figure of four rounded squares and the transparent cross (Fig. 2e). The curves are averaged over all neurons that showed the signal reversal in the transparent condition. All signals showed an onset at about 50 ms. The signal for the transparent condition first deviated in the positive direction before turning negative, which occurred at 110 ms (the positive deviation was significant; P = 0.028, n = 90, two-sided t-test). Thus, the influence of the X junctions seems to build up later than the influence of the cues that determine border ownership for squares.
The neural signals paralleled perception in all of our tests. Taken together, these results are compelling evidence for mechanisms designed to resolve transparent overlay. The strong influence of transparency on the border ownership signals suggests that the underlying mechanisms in V2 serve not only figure-ground segregation, but the more general function of grouping contour features for the purpose of object identification.
Supplementary Material
Acknowledgments
We thank O. Garalde for technical assistance. This research was supported by US National Institutes of Health grant R01 EY02966.
Footnotes
Competing interests statement: The authors declare that they have no competing financial interests.
References
- 1.Metelli F. Sci Am. 1974;230:91–98. doi: 10.1038/scientificamerican0474-90. [DOI] [PubMed] [Google Scholar]
- 2.Beck J, Prazdny K, Ivry R. Percept Psychophys. 1984;35:407–422. doi: 10.3758/bf03203917. [DOI] [PubMed] [Google Scholar]
- 3.Adelson EH. In: The New Cognitive Neurosciences. Gazzaniga M, editor. MIT Press; Cambridge, Massachusetts, USA: 2000. pp. 339–351. [Google Scholar]
- 4.Stoner GR, Albright TD. Nature. 1992;358:412–414. doi: 10.1038/358412a0. [DOI] [PubMed] [Google Scholar]
- 5.Zhou H, Friedman HS, von der Heydt RJ. Neurosci. 2000;20:6594–6611. doi: 10.1523/JNEUROSCI.20-17-06594.2000. [DOI] [PMC free article] [PubMed] [Google Scholar]
- 6.Qiu FT, von der Heydt R. Neuron. 2005;47:155–166. doi: 10.1016/j.neuron.2005.05.028. [DOI] [PMC free article] [PubMed] [Google Scholar]
- 7.Nakayama K, Shimojo S, Silverman GH. Perception. 1989;18:55–68. doi: 10.1068/p180055. [DOI] [PubMed] [Google Scholar]
- 8.Nakayama K, Shimojo S, Ramachandran VS. Perception. 1990;19:497–513. doi: 10.1068/p190497. [DOI] [PubMed] [Google Scholar]
- 9.Adelson EH, Anandan P. Proceedings of the American Association for Artificial Intelligence Workshop on Qualitative Vision; Boston, MA. 1990. pp. 77–81. [Google Scholar]
Associated Data
This section collects any data citations, data availability statements, or supplementary materials included in this article.


