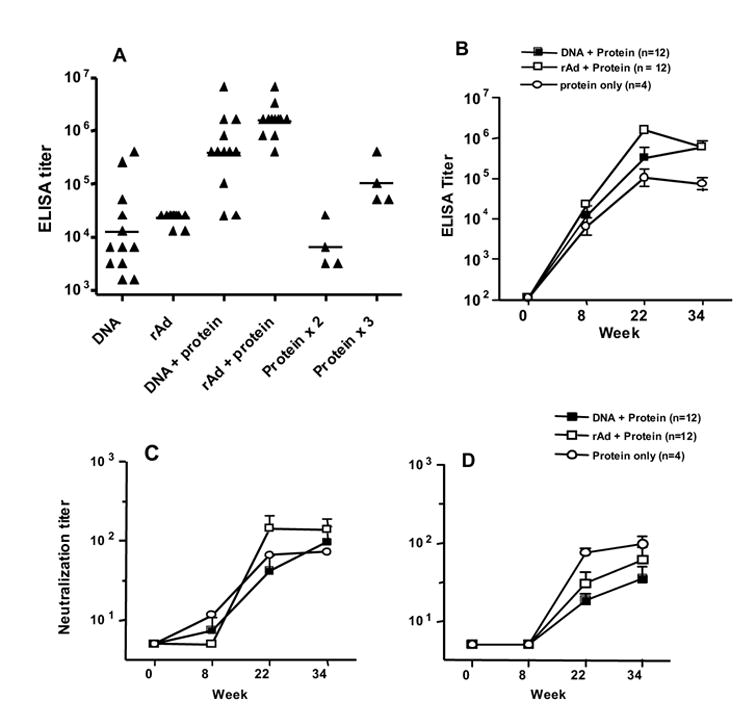
Fig 2.

Comparison of DNA and rAd prime. (A) Anti-Env ELISA titers for the 12 GPs that received 3 DNA immunizations (DNA) and the 12 GPs that received one rAd5 immunization (rAd); the time point shown is week 8. ELISA titers are also shown from sera sampled at week 22, two weeks after the first protein boost immunization (DNA + protein, DNA + rAd). The two columns furthest to the right show data from the four protein only immunized GPs; time points are week 8 (after protein x 2) and week 22 (after protein x 3). The line within each group of scatter points indicates the GMT. (B) Longitudinal ELISA titers for the same animals described above. The immunization scheme is shown above in Fig. 1. (C) Neutralization IC50 values for viral isolate SS1196. (D) Neutralization IC50 values for viral isolate BaL.01. All line graphs show the geometric mean value and SEM for each time point.
