Abstract
An increasing number of publications are replicating a previously reported disease-marker association but with the risk allele reversed from the previous report. Do such “flip-flop” associations confirm or refute the previous association findings? We hypothesized that these associations may indeed be confirmations but that multilocus effects and variation in interlocus correlations contribute to this flip-flop phenomenon. We used theoretical modeling to demonstrate that flip-flop associations can occur when the investigated variant is correlated, through interactive effects or linkage disequilibrium, with a causal variant at another locus, and we show how these findings could explain previous reports of flip-flop associations.
Associations of opposite alleles at the same biallelic locus with the same disease are confusing findings, particularly in the same ethnic group. For example, both the long and short allele at the HTTLR locus of the serotonin transporter gene have been found to be risk alleles for autistic disorder (MIM %209850) in different studies.1–6 Additionally, two independent studies report the opposite alleles at the same SNP in the glutathione-S-transferase omega-1 gene (GSTO1 [MIM *605482]) positively associated with age at onset (AAO) in late-onset Alzheimer disease (AD [MIM #104300]).7,8 Another example is the association of the catechol-O-methyltranserase gene (COMT [MIM +116790]) with schizophrenia (SCZD [MIM #181500]).9–13 Theoretically, such “flip-flop” associations for a genuine causal variant would be unlikely to occur in samples ascertained similarly from a common population. Thus, flip-flop associations found in apparently similar samples are often regarded as spurious findings.
Flip-flops of risk alleles have also been reported across different ethnic groups14,15 and may be more easily explained by population differences. These flip-flop associations may indicate heterogeneous effects of the same variant that are due to differences in genetic background or environment. It is well known that changing the genetic background (strain) in transgenic mouse experiments can significantly change the resulting phenotype. Differences in linkage disequilibrium (LD) between populations could also lead to inconsistent patterns of association when noncausal variants are tested. Despite these possible explanations, it remains arguable whether flip-flop associations in general suggest a confirmation or spurious association.
False-positive results may account for most cases of irreproducibility of association studies.16 It has been speculated that extreme positive or opposite findings tend to attract investigators and journal editors and are hence published earlier than other results.17 Inconsistent findings, therefore, may be attributable to publication biases (i.e., significant results tend to be favored for publication) and reporting biases (i.e., investigators may report only positive findings). Lack of acknowledgment of these biases may result in false-positive results.
When multiple loci act in concert to cause a disease, a single-locus association may be confounded by the other loci. We hypothesized that some flip-flop associations may be attributable to failure to account for multilocus effects or correlation with other loci. Our study consists of three parts. In the part I, we used theoretical models to evaluate how multilocus effects can explain flip-flop associations. In part II, we examined how variable LD patterns within the COMT gene might lead to inconsistent associations of the gene with SCZD. In part III, we extended the framework of LD to the correlation between two nonsyntenic loci. We used observed flip-flop associations between the glyceraldehyde-3-phosphate dehydrogenase gene (GAPDH [MIM *138400]) and AD as an example.
Part I: Assessment of single-locus association in the presence of multilocus effects.—Suppose we conduct a single-locus association analysis in a sample of unrelated cases and controls. We observe genotypes at a target SNP denoted by “SNP1”; another untested SNP is denoted by “SNP2.” Assume that SNP1 has two alleles A and a and that SNP2 has two alleles B and b. We computed the correlation coefficient between alleles A and B, such that the frequencies
 |
where D=PAB-PAPB is the LD coefficient, PAB is the frequency of haplotype AB, and PA, Pa, PB, and Pb are allele frequencies for the four alleles A, a, B, and b, respectively. The constraints are such that PA+Pa=1, PB+Pb=1, and D lies between -min(PAPB,PaPb) and min(PAPb,PaPB).
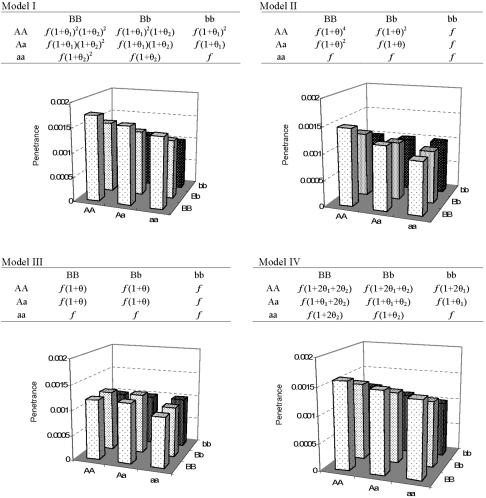
Assuming that only SNP1 is analyzed in an association study, we evaluated how the unexamined SNP2 may influence the observed direction of association between SNP1 alleles and risk of disease. To assess the observed association between SNP1 and disease risk in the presence of a joint effect of SNP1 and SNP2, we compared the frequency of allele A at SNP1 in affected individuals and unaffected individuals for four different theoretical models of multilocus effects (fig. 1). Models I, II, and III are based on the locus-locus interaction models proposed by Marchini et al.18 The values for parameters f, θ1, and θ2 were used to compute probabilities of being affected with a disease (i.e., penetrance) for individuals carrying different two-locus genotypes. Baseline penetrance f is the probability of being affected if the two-locus genotype is aabb. θ1 and θ2 reflect the genetic effect of allele A and allele B, respectively. For example, under model I (multiplicative model), each copy of allele A increases the risk of disease by a factor of 1+θ1. Similarly, each copy of allele B increases the risk of disease by a factor of 1+θ2. We added a fourth model, model IV, that specifies simple additive effects for the two loci. Figure 1 shows the penetrance values for various two-locus combinations under the four different models of multilocus effects. To compute the penetrance values, we specified f=0.001, θ1=0 or 0.1, and let θ2=0.1, 0.2, or 0.4, such that either of the two causative alleles A and B, at best, exerts modest effect on susceptibility to disease. Using the penetrance values, we computed the odds ratio (OR) for allele A in affected versus unaffected individuals, given the allele frequencies for two alleles A and B in the whole population were either 0.1 or 0.5.
Figure 1. .
Penetrance values for each two-locus genotype combination under different models of multilocus effect. The penetrance values were calculated by specifying α=.001, θ1=0.1, and θ2=0.2 for each model.
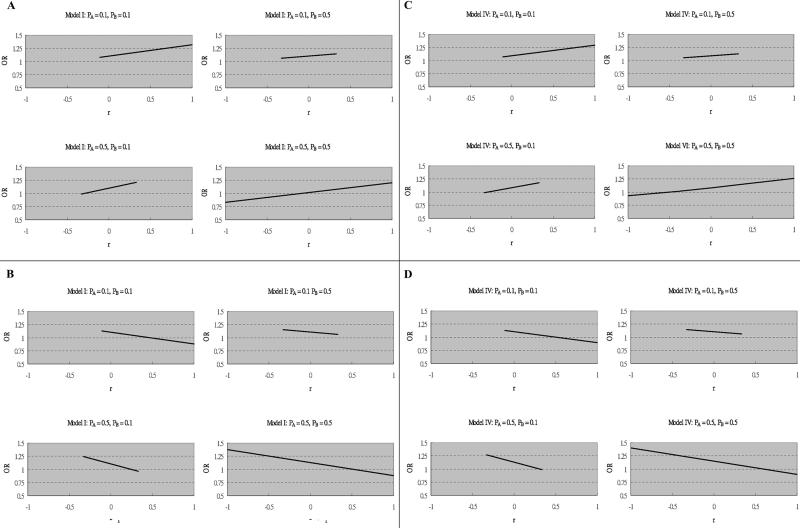
ORs for allele A at SNP1 in affected individuals versus unaffected individuals corresponding to various r values with fixed θ1 and θ2 are presented in figure 2 (only models I and IV are shown, since models II and III showed no flip-flop associations). Figure 2A and 2B shows how association with allele A at SNP1 varies with r under model I. Figure 2C and 2D shows how association with allele A at SNP1 varies with r under model IV. The direction of single-locus association flips (i.e., the OR crosses 1) under models I and IV as r varies. We also performed simulations in which the allele A frequency was set at 0.01 and 0.005 and saw no change in the direction of association when allele B frequency was 0.005, 0.01, 0.3, or 0.5 (data not shown). Therefore, such flip-flop associations are seen particularly when the risk allele (A) at the target locus is a relatively common allele. Additionally, the point at which the direction of association changes tends to be when the two SNPs are in weak LD with each other (e.g., r≈-0.25 in fig. 2A). This indicates that the observed direction of allelic association may be particularly susceptible to sampling variation when there is little LD, and remarkable variation in LD patterns is not required.
Figure 2. .
ORs corresponding to the effect size of allele A under models I and IV. Parameters for each situation are specified. A, f=0.001, θ1=0.1, and θ2=0.2 under model I. B, f=0.001, θ1=0.1, and θ2=-0.2 under model I. C, f=0.001, θ1=0.1, and θ2=0.2 under model IV. D, f=0.001, θ1=0.1, and θ2=-0.2 under model IV.
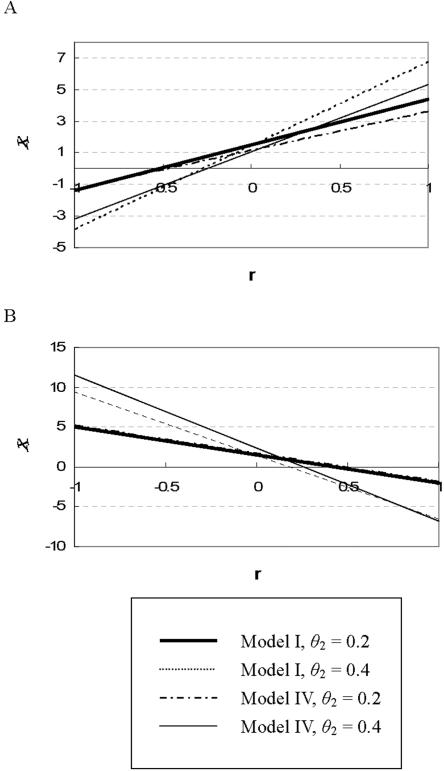
Figure 3 demonstrates how association of allele A with disease risk varies by r, θ1, and θ2 (only models I and IV are shown). Again we see that the A allele may be positively or negatively associated with the disease, depending on the allelic correlation and the disease model. Interestingly, we may still observe a flip-flop association at SNP1 even if it has no direct effect on disease risk. This was seen in models with θ1=0 for which the observed SNP acts only through LD with SNP2. The results based on θ1=0 are similar to those based on θ1=0.1 (data not shown).
Figure 3. .
Directions of allelic association for the A allele in different situations. We used the statistic χ=(PA-PB)/ , where P=(PA+PB)/2, to demonstrate how the direction of allelic association varies depending on θ2, given the same frequency of the A (and B) allele (∼50%) and model of multilocus effect. θ1 is fixed at 0.1 for all models. Panel A indicates the situation where A is a risk allele and B is also a risk allele; panel B indicates the situation where the A allele is a risk allele and the B allele is a protective allele.
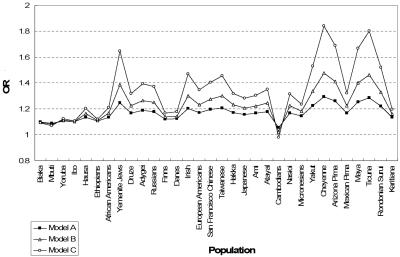
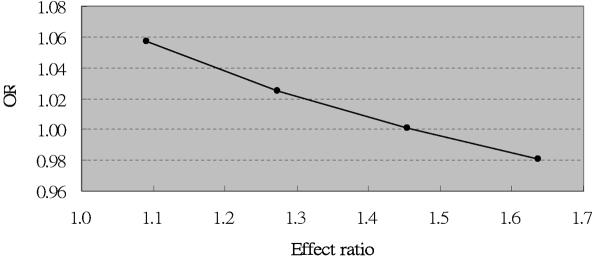
Part II: Examining population variation in LD across the COMT gene.—For 32 populations, we estimated, on the basis of published data,19 the correlation coefficient r between an RFLP (HindIII-1217) located in the P2 promoter and an NlaIII RFLP containing the Val158Met polymorphism in exon 4 of the COMT gene. Table 1 summarizes, for each population, the allele frequencies of A (site absent) and B (site absent) in the NlaIII and HindIII RFLPs in the COMT gene, respectively, and r between these two loci. We see that estimates of allele frequencies and allelic correlation vary across the populations. The effect of the A allele on disease risk was modeled under several putative disease models in these 32 populations (fig. 4). We found that the observed magnitude of association between the A allele and risk of disease varied across different populations. In the Cambodian population, allele A became overrepresented in unaffected individuals when the effect ratio—that is, (1+θ2)/(1+θ1)—for the P2 promoter compared with the Val allele exceeds 1.4 under model I (fig. 5). Note that a previous study estimated ORs of 1.6 and 1.1 for the effects of the P2 promoter polymorphism and the Val allele, respectively, on SCZD, which is consistent with an effect ratio in excess of 1.4.20
Table 1. .
Population Variation in LD between the Val158Met Polymorphism (A Allele) and the P2 Promoter (B Allele) within the COMT Gene[Note]
| Allele Frequency |
||||
| Population | 2Na | A | B | r |
| Biaka | 140 | .51 | .94 | −.03 |
| Mbuti | 76 | .67 | .80 | −.07 |
| Yoruba | 152 | .86 | .64 | .03 |
| Ibo | 94 | .66 | .64 | .01 |
| Hausa | 76 | .57 | .74 | .20 |
| Ethiopians | 64 | .64 | .67 | .03 |
| African Americans | 180 | .57 | .67 | .19 |
| Yemenite Jews | 86 | .69 | .62 | .66 |
| Druze | 148 | .65 | .62 | .32 |
| Adygei | 108 | .72 | .66 | .40 |
| Russians | 96 | .52 | .49 | .38 |
| Finns | 70 | .56 | .47 | .10 |
| Danes | 102 | .43 | .39 | .11 |
| Irish | 230 | .59 | .50 | .48 |
| European Americans | 186 | .53 | .38 | .34 |
| Chinese | 120 | .69 | .78 | .52 |
| Taiwanese | 98 | .63 | .75 | .59 |
| Hakka | 80 | .65 | .83 | .46 |
| Japanese | 102 | .58 | .69 | .31 |
| Ami | 80 | .75 | .85 | .41 |
| Atayal | 84 | .86 | .82 | .36 |
| Cambodians | 50 | .69 | .72 | −.22 |
| Nasioi | 46 | .66 | .74 | .37 |
| Micronesians | 74 | .91 | .86 | .19 |
| Yakut | 102 | .70 | .70 | .59 |
| Cheyenne | 112 | .73 | .71 | .85 |
| Arizona Pima | 102 | .85 | .82 | .72 |
| Mexican Pima | 106 | .68 | .65 | .33 |
| Maya | 104 | .42 | .47 | .72 |
| Ticuna | 132 | .78 | .78 | .86 |
| Rondonian Surui | 92 | .75 | .70 | .54 |
| Karitiana | 110 | .95 | .99 | .42 |
Note.— Negative estimates of r are shown in bold.
N=number of individuals recruited in each study.
Figure 4. .
The effect of the Val allele (i.e., the A allele at NlaIII RSP) on SCZD across 32 populations. Allelic effect is presented by OR. For model A, θ1=0.1 and θ2=0.2; for model B, θ1=0.1 and θ2=0.4; for model C, θ1=0.1 and θ2=0.8. For all four models, f=0.001.
Figure 5. .
The effect of the Val allele (presented by OR) on SCZD in the Cambodian population, given different disease models (i.e., different effect ratios for the P2 promoter compared with the Val allele).
Part III: The GAPDH and APOE genes in AD.—The Alzheimer Disease Family data set and genotyping methods for GAPDH and APOE were described elsewhere.21 Briefly, the overall data set was composed of 653 white individuals: 369 unrelated subjects with AD and 284 unrelated control subjects. The mean (±SD) AAO for the affected subjects is 71.1±6.6, and controls were age matched at the time of examination (AAE), with a mean AAE of 71.9±6.3. Twelve SNPs in the GAPDH gene and its paralogs were genotyped using the ABI 7900 TaqMan system. APOE alleles were genotyped as reported elsewhere.22
Li et al.23 reported that the G allele at a 5′ UTR SNP—rs3741916 (C→G)—in the GAPDH gene was positively associated with AD, whereas Lin et al.21 (from our laboratory) reported that the C allele at the same locus was the positively associated allele in an independent AD sample. The original study reported that the G allele was positively associated with AD in the subset, without any copies of the APOE ɛ4 allele, whereas Lin et al.21 found that the same allele was inversely associated with AD in the subset carrying at least one copy of APOE ɛ4 alleles (a well-documented risk factor for AD). We thus sought to examine whether such opposite effects could be attributed to the variation in correlation between the rs3741916 SNP and the APOE polymorphism.
Table 2 summarizes the findings of association between rs3741916 in the GAPDH gene and risk of AD. We found that, under a recessive model, the G allele at rs3741916 was positively associated with AD in the earlier-onset subset (P=.007) but that the C allele was positively associated with AD in the later-onset subset (P=.047). We further found that the G allele at rs3741916 was inversely correlated with APOE ɛ4 allele (r=-0.021; P=.049) in the earlier-onset subset in our data set. On the contrary, the G allele at rs3741916 was not significantly correlated with the APOE ɛ4 allele in the later-onset subset of our data set (r=0.005; P=.884). The data set (of subjects recruited by Washington University in St. Louis) analyzed by Li and colleagues23 included subjects with AD who had a mean AAO of 76.2±6.8 years. The subjects included in our data set had significantly younger AAO than did the subjects included in the Washington University data set (t=11.1; P<.001). These results suggest that opposite alleles are associated with AD in these two different samples because of differences in the interlocus correlation between APOE ɛ4 and GAPDH alleles.
Table 2. .
Genotypic Relative Risk for rs3741916 in the GAPDH Gene and the Correlation between rs3741916 and the APOE Polymorphism[Note]
|
rs3741916 and Disease |
rs3741916 and APOE Polymorphism |
||||
| AAO | OR (95% CI) | P | ORa (95% CI) | P | rb |
| ⩽72 years (N=195) | .36c (.17–.76) | .007 | .27 (.07–.99) | .049 | −.021 |
| >72 years (N=211) | 2.78d (1.02–7.62) | .047 | .92 (.32–2.70) | .884 | .005 |
Note— The genotypic relative risk is presented as an OR.
The relative risk of carrying at least one APOE ɛ4 allele for individuals carrying at least one G allele at rs3741916, compared with individuals carrying no G alleles at rs3741916.
The APOE polymorphism was treated as a biallelic marker (the ɛ4 allele vs. the non-ɛ4 allele).
The genotype at rs3741916 in the GAPDH gene was coded as 1 for CC and 0 for GC+CC.
The genotype at rs3741916 in the GAPDH gene was coded as 1 for GG and 0 for GC+CC.
The current study demonstrates that the observed effect of a genetic variant can differ between studies because of differences in its correlation with other causal variants. Association studies are often conducted on a marker-by-marker basis. For a complex disease, the interplay of multiple loci and environmental factors plays a role in its etiology. Therefore, examining the association between a single locus and disease may produce ambiguous results because of the lack of consideration of other disease-influencing genetic loci or environmental factors correlated with the target susceptibility locus.
Not only can flip-flop associations occur when a multilocus effect is not accounted for, but they may also be attributable to investigation of a noncausal variant in LD with a genuine causal variant. When the investigated allele at the noncausal variant is positively associated with the disease-risk allele in a population, the target allele at this SNP appears to be a risk allele. When this target allele at this SNP is negatively associated with the disease-risk allele in another population, the target allele at this SNP will appear to be a protective allele.
There are two scenarios we need to address separately. First, flip-flop phenomena may be attributable to genuinely different LD architectures. We have found notable difference in LD patterns in the COMT gene across populations with different ancestral origins. Therefore, flip-flop associations of the Val allele with SCZD across different ethnic populations (e.g., Irish vs. Cambodian) could easily be due to the variation in LD architecture. Second, flip-flop phenomena may also be attributable to sampling variation that leads to variation in observed LD patterns. In this scenario, we may see flip-flop phenomena in different samples of the same ethnic origin, particularly when there is low LD between loci within the same gene.
LD patterns across the same genetic region can be highly variable across different ethnic populations.24,25 Variation in LD architecture across different populations within the same ethnic group has also been noted.26 LD patterns are modulated by several factors, including local recombination rate,27 mutation-selection balance, genetic drift, and population history. Another crucial factor, sampling variation, may lead to more-extreme swings in observed LD that may produce controversial opposite single-locus effects, as our theoretical modeling predicts. Therefore, we suggest that LD patterns be examined in different samples whenever flip-flop phenomena occur. If the samples show different patterns of LD between markers in the region, then this may explain the flip-flop. According to our theoretical modeling results, markers in weak LD with each other (e.g., r2<0.3) may also need to be considered carefully, since flip-flop associations may be due only to sampling variation. Additionally, for loci with a minor-allele frequency <5%, it may be more likely that flip-flop phenomena indicate spurious results than confirmatory results confounded by the multilocus effect.
In summary, single-locus association studies may be complicated by interaction between an investigated locus and other risk factors. Consequently, conventional association tests performed in a “one-marker-at-a-time” fashion may produce ambiguous results, despite the genuine genetic effect. The current study shows that flip-flop associations may be partially attributable to population variation in interlocus correlation when the loci are not considered jointly. In-depth investigation is required to verify whether such phenomena indicate a confirmation or spurious association. These contradictory results should not be dismissed out of hand, and we should remember that genomic context is critical to the accurate interpretation of association results. Indeed, we would adapt the famous work of John Donne28: “No gene is an island, entire of itself, every gene is a piece of the interactive genome.”
Acknowledgments
This work was supported by National Institute of Health grants NS311530 (to J.M.V.), AG021547 (to M.A.P.-V.), AG19757 (to M.A.P.-V.), AG05128 (to M.A.P.-V.), and AG20135 (to E.R.M.); T. L. L. Temple award TLL-97-012 (to M.A.P.-V.); and Zenith Award ZEN-01-2935 from the Alzheimer’s Association (to M.A.P.-V.).
Web Resource
The URL for data presented herein is as follows:
- Online Mendelian Inheritance in Man (OMIM), http://www.ncbi.nlm.nih.gov/Omim/ (for autistic disorder, GSTO1, AD, COMT, SCZD, and GAPDH)
References
- 1.Devlin B, Cook EH Jr, Coon H, Dawson G, Grigorenko EL, McMahon W, Minshew N, Pauls D, Smith M, Spence MA, et al (2005) Autism and the serotonin transporter: the long and short of it. Mol Psychiatry 10:1110–1116 10.1038/sj.mp.4001724 [DOI] [PubMed] [Google Scholar]
- 2.Betancur C, Corbex M, Spielewoy C, Philippe A, Laplanche JL, Launay JM, Gillberg C, Mouren-Simeoni MC, Hamon M, Giros B, et al (2002) Serotonin transporter gene polymorphisms and hyperserotonemia in autistic disorder. Mol Psychiatry 7:67–71 [DOI] [PMC free article] [PubMed] [Google Scholar]
- 3.Maestrini E, Lai C, Marlow A, Matthews N, Wallace S, Bailey A, Cook EH, Weeks DE, Monaco AP, The International Molecular Genetic Study of Autism Consortium (1999) Serotonin transporter (5-HTT) and γ-aminobutyric acid receptor subunit β3 (GABRB3) gene polymorphisms are not associated with autism in the IMGSA families. Am J Med Genet 88:492–496 [DOI] [PubMed] [Google Scholar]
- 4.McCauley JL, Olson LM, Dowd M, Amin T, Steele A, Blakely RD, Folstein SE, Haines JL, Sutcliffe JS (2004) Linkage and association analysis at the serotonin transporter (SLC6A4) locus in a rigid-compulsive subset of autism. Am J Med Genet B Neuropsychiatr Genet 127:104–112 10.1002/ajmg.b.20151 [DOI] [PubMed] [Google Scholar]
- 5.Tordjman S, Gutknecht L, Carlier M, Spitz E, Antoine C, Slama F, Carsalade V, Cohen DJ, Ferrari P, Roubertoux PL, et al (2001) Role of the serotonin transporter gene in the behavioral expression of autism. Mol Psychiatry 6:434–439 10.1038/sj.mp.4000873 [DOI] [PubMed] [Google Scholar]
- 6.Yirmiya N, Pilowsky T, Nemanov L, Arbelle S, Feinsilver T, Fried I, Ebstein RP (2001) Evidence for an association with the serotonin transporter promoter region polymorphism and autism. Am J Med Genet 105:381–386 10.1002/ajmg.1365 [DOI] [PubMed] [Google Scholar]
- 7.Li YJ, Oliveira SA, Xu P, Martin ER, Stenger JE, Scherzer CR, Hauser MA, Scott WK, Small GW, Nance MA, et al (2003) Glutathione S-transferase omega-1 modifies age-at-onset of Alzheimer disease and Parkinson disease. Hum Mol Genet 12:3259–3267 10.1093/hmg/ddg357 [DOI] [PubMed] [Google Scholar]
- 8.Kolsch H, Linnebank M, Lutjohann D, Jessen F, Wullner U, Harbrecht U, Thelen KM, Kreis M, Hentschel F, Schulz A, et al (2004) Polymorphisms in glutathione S-transferase omega-1 and AD, vascular dementia, and stroke. Neurology 63:2255–2260 [DOI] [PubMed] [Google Scholar]
- 9.Chen X, Wang X, O’Neill AF, Walsh D, Kendler KS (2004) Variants in the catechol-O-methyltransferase (COMT) gene are associated with schizophrenia in Irish high-density families. Mol Psychiatry 9:962–967 10.1038/sj.mp.4001519 [DOI] [PubMed] [Google Scholar]
- 10.Glatt SJ, Faraone SV, Tsuang MT (2003) Association between a functional catechol O-methyltransferase gene polymorphism and schizophrenia: meta-analysis of case-control and family-based studies. Am J Psychiatry 160:469–476 10.1176/appi.ajp.160.3.469 [DOI] [PubMed] [Google Scholar]
- 11.Park TW, Yoon KS, Kim JH, Park WY, Hirvonen A, Kang D (2002) Functional catechol-O-methyltransferase gene polymorphism and susceptibility to schizophrenia. Eur Neuropsychopharmacol 12:299–303 10.1016/S0924-977X(02)00030-5 [DOI] [PubMed] [Google Scholar]
- 12.Sanders AR, Rusu I, Duan J, Vander Molen JE, Hou C, Schwab SG, Wildenauer DB, Martinez M, Gejman PV (2005) Haplotypic association spanning the 22q11.21 genes COMT and ARVCF with schizophrenia. Mol Psychiatry 10:353–365 10.1038/sj.mp.4001586 [DOI] [PubMed] [Google Scholar]
- 13.Wonodi I, Stine OC, Mitchell BD, Buchanan RW, Thaker GK (2003) Association between Val108/158 Met polymorphism of the COMT gene and schizophrenia. Am J Med Genet B Neuropsychiatr Genet 120:47–50 10.1002/ajmg.b.20037 [DOI] [PubMed] [Google Scholar]
- 14.Singleton AB, Farrer M, Johnson J, Singleton A, Hague S, Kachergus J, Hulihan M, Peuralinna T, Dutra A, Nussbaum R, et al (2003) Alpha-synuclein locus triplication causes Parkinson’s disease. Science 302:841 10.1126/science.1090278 [DOI] [PubMed] [Google Scholar]
- 15.Tan EK, Tan C, Shen H, Chai A, Lum SY, Teoh ML, Yih Y, Wong MC, Zhao Y (2003) Alpha synuclein promoter and risk of Parkinson’s disease: microsatellite and allelic size variability. Neurosci Lett 336:70–72 10.1016/S0304-3940(02)01178-3 [DOI] [PubMed] [Google Scholar]
- 16.Colhoun HM, McKeigue PM, Davey Smith G (2003) Problems of reporting genetic associations with complex outcomes. Lancet 361:865–872 10.1016/S0140-6736(03)12715-8 [DOI] [PubMed] [Google Scholar]
- 17.Patsopoulos NA, Ntzani EE, Zintzaras E, Ioannidis JP (2005) CYP2D6 polymorphisms and the risk of tardive dyskinesia in schizophrenia: a meta-analysis. Pharmacogenet Genomics 15:151–158 [DOI] [PubMed] [Google Scholar]
- 18.Marchini J, Donnelly P, Cardon LR (2005) Genome-wide strategies for detecting multiple loci that influence complex diseases. Nat Genet 37:413–417 10.1038/ng1537 [DOI] [PubMed] [Google Scholar]
- 19.Palmatier MA, Pakstis AJ, Speed W, Paschou P, Goldman D, Odunsi A, Okonofua F, Kajuna S, Karoma N, Kungulilo S, et al (2004) COMT haplotypes suggest P2 promoter region relevance for schizophrenia. Mol Psychiatry 9:859–870 10.1038/sj.mp.4001496 [DOI] [PubMed] [Google Scholar]
- 20.Fan JB, Zhang CS, Gu NF, Li XW, Sun WW, Wang HY, Feng GY, St Clair D, He L (2005) Catechol-O-methyltransferase gene Val/Met functional polymorphism and risk of schizophrenia: a large-scale association study plus meta-analysis. Biol Psychiatry 57:139–144 10.1016/j.biopsych.2004.10.018 [DOI] [PubMed] [Google Scholar]
- 21.Lin PI, Martin ER, Bronson PG, Browning-Large C, Small GW, Schmechel DE, Welsh-Bohmer KA, Haines JL, Gilbert JR, Pericak-Vance MA (2006) Exploring the association of glyceraldehyde-3-phosphate dehydrogenase gene and Alzheimer disease. Neurology 67:64–68 10.1212/01.wnl.0000223438.90113.4e [DOI] [PubMed] [Google Scholar]
- 22.Saunders AM, Strittmatter WJ, Schmechel D, George-Hyslop PH, Pericak-Vance MA, Joo SH, Rosi BL, Gusella JF, Crapper-MacLachlan DR, Alberts MJ, et al (1993) Association of apolipoprotein E allele epsilon 4 with late-onset familial and sporadic Alzheimer’s disease. Neurology 43:1467–1472 [DOI] [PubMed] [Google Scholar]
- 23.Li Y, Nowotny P, Holmans P, Smemo S, Kauwe JS, Hinrichs AL, Tacey K, Doil L, van Luchene R, Garcia V, et al (2004) Association of late-onset Alzheimer’s disease with genetic variation in multiple members of the GAPDH gene family. Proc Natl Acad Sci USA 101:15688–15693 10.1073/pnas.0403535101 [DOI] [PMC free article] [PubMed] [Google Scholar]
- 24.Schneider JA, Pungliya MS, Choi JY, Jiang R, Sun XJ, Salisbury BA, Stephens JC (2003) DNA variability of human genes. Mech Ageing Dev 124:17–25 10.1016/S0047-6374(02)00165-3 [DOI] [PubMed] [Google Scholar]
- 25.Nielsen R, Hubisz MJ, Clark AG (2004) Reconstituting the frequency spectrum of ascertained single-nucleotide polymorphism data. Genetics 168:2373–2382 10.1534/genetics.104.031039 [DOI] [PMC free article] [PubMed] [Google Scholar]
- 26.Faraone SV, Skol AD, Tsuang DW, Bingham S, Young KA, Prabhudesai S, Haverstock SL, Mena F, Menon AS, Bisset D, et al (2002) Linkage of chromosome 13q32 to schizophrenia in a large veterans affairs cooperative study sample. Am J Med Genet 114:598–604 10.1002/ajmg.10601 [DOI] [PubMed] [Google Scholar]
- 27.Mullerova J, Hozak P (2004) Use of recombinant congenic strains in mapping disease-modifying genes. News Physiol Sci 19:105–109 [DOI] [PubMed] [Google Scholar]
- 28.Donne J (1623) Meditation XVII: devotions upon emergent occasions. Oxford University Press, Oxford, United Kingdom (published in 1986) [Google Scholar]


