Abstract
Hutchinson–Gilford progeria syndrome (HGPS) is a rare genetic disorder characterized by dramatic premature aging. Classic HGPS is caused by a de novo point mutation in exon 11 (residue 1824, C → T) of the LMNA gene, activating a cryptic splice donor and resulting in a mutant lamin A (LA) protein termed “progerin/LAΔ50” that lacks the normal cleavage site to remove a C-terminal farnesyl group. During interphase, irreversibly farnesylated progerin/LAΔ50 anchors to the nuclear membrane and causes characteristic nuclear blebbing. Progerin/LAΔ50's localization and behavior during mitosis, however, are completely unknown. Here, we report that progerin/LAΔ50 mislocalizes into insoluble cytoplasmic aggregates and membranes during mitosis and causes abnormal chromosome segregation and binucleation. These phenotypes are largely rescued with either farnesyltransferase inhibitors or a farnesylation-incompetent mutant progerin/LAΔ50. Furthermore, we demonstrate that small amounts of progerin/LAΔ50 exist in normal fibroblasts, and a significant percentage of these progerin/LAΔ50-expressing normal cells are binucleated, implicating progerin/LAΔ50 as causing similar mitotic defects in the normal aging process. Our findings present evidence of mitotic abnormality in HGPS and may shed light on the general phenomenon of aging.
Keywords: aging, laminopathy, progerin
The LMNA gene encodes the A-type lamins, including lamin A (LA), lamin C, lamin C2, and LAΔ10. LA is a major component of the nuclear lamina, a dynamic meshwork located just under the nuclear envelope (NE), providing essential mechanical support. In addition, LA associates with chromatin both directly and indirectly and has been suggested to play important roles in chromatin organization, transcription, DNA replication, and apoptosis (1, 2). At the NE periphery, the LA precursor undergoes a unique posttranslational maturation process in which its CAAX motif at the carboxyl terminus is farnesylated before the proteolytic removal of the AAX sequence and carboxymethylation. Then the last 15 amino acids of prelamin A are cleaved off by an endoprotease called Zmpste24/FACE1, releasing the unfarnesylated mature LA (3).
At least 12 diseases have been associated with various mutations in the LMNA gene (collectively referred to as the “laminopathies”) (1, 4). Among them, Hutchinson–Gilford progeria syndrome (HGPS) is one of the most devastating diseases, affecting multiple tissues in a pattern that resembles precocious aging. Children born with HGPS typically appear normal at birth, but within a year begin to display the effects of accelerated aging, including loss of hair, diminished subcutaneous fat, cardiovascular disease, and skeletal abnormalities. On average, death occurs at the age of 13 from heart attack or stroke (5, 6). The majority of HGPS cases are associated with a de novo nucleotide substitution at position 1824, C → T. This mutation does not cause an amino acid change (G608G), but partially activates a cryptic splice donor site and leads to the in-frame deletion of 150 bp within the prelamin A mRNA (7, 8). This truncated prelamin A mRNA is then translated into a protein recently named progerin/LAΔ50 (7). The Zmpste24/FACE1 cleavage site is missing in progerin/LAΔ50 because of the internal 50-aa deletion, so that progerin/LAΔ50 retains the C-terminal farnesylation (9, 10).
At the cellular level, HGPS is associated with significant changes in the interphase nucleus, including blebbing of the NE, thickening of the nuclear lamina, loss of peripheral heterochromatin, and clustering of nuclear pores (11). Transcriptional misregulation has also been reported in HGPS fibroblasts (12, 13). These alterations in interphase nuclear structure have been correlated with the progressive accumulation of the progerin/LAΔ50 protein in HGPS cells (11). Treating HGPS fibroblast cells with farnesyltransferase inhibitors (FTIs) leads to partial relocalization of progerin/LAΔ50 away from the NE and a reduction in interphase nuclear morphological abnormalities (9, 14). A recent study (15) has determined that progerin/LAΔ50 is also present in small amounts in cells from normal individuals, suggesting that similar mechanisms might also be active in the normal aging process.
To date, research on the biology of HGPS has been focused primarily on studying the nuclear abnormalities in interphase. Neither the localization of progerin/LAΔ50 during mitosis nor the possible mitotic defects caused by progerin/LAΔ50 accumulation have been previously addressed to our knowledge. In this study, we have examined the mitotic localization of progerin/LAΔ50 in both transfected HeLa cells and fibroblasts derived from HGPS patients. Our results demonstrate that progerin/LAΔ50 mislocalizes into insoluble cytoplasmic aggregates and membranes during mitosis and leads to chromosome missegregation and binucleation. In addition, we show that these phenotypes are largely rescued with either FTIs or a farnesylation-incompetent mutant progerin/LAΔ50. Furthermore, we demonstrate that small amounts of progerin/LAΔ50 exist in normal fibroblasts, and a significant percentage of these progerin/LAΔ50-expressing normal cells are binucleated, implicating progerin/LAΔ50 as causing similar mitotic defects in the normal aging process.
Results and Discussion
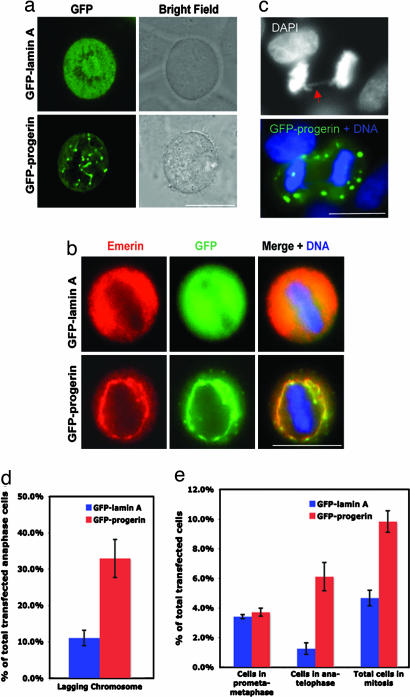
To localize progerin/LAΔ50 in mitosis, we first examined the mitotic localization of progerin/LAΔ50 tagged with GFP at its N terminus. HeLa cells were transfected with either GFP-progerin/LAΔ50 or control GFP-LA and visualized 48 h later. In contrast to the uniform diffuse signal of GFP-LA at metaphase, GFP-progerin/LAΔ50 assembled into insoluble cytoplasmic aggregates and associated with membrane-like network structures (Fig. 1a). Observations made by confocal microscopy suggested that these cytoplasmic aggregates were distributed throughout the mitotic cytoplasm (data not shown). Immunofluorescence studies showed that GFP-progerin/LAΔ50 colocalized with emerin, an established membrane vesicle marker during mitosis (16, 17) (Fig. 1b), confirming the association of progerin with membranes in mitosis. Interestingly, in the GFP-progerin/LAΔ50-expressing mitotic cells, the membrane network appeared more integrated (polymerized), indicating that progerin/LAΔ50 interferes with normal membrane morphogenesis during mitosis. Importantly, DAPI staining revealed that the expression of GFP-progerin/LAΔ50 resulted in a significant increase in lagging chromosomes at anaphase as compared with control cells expressing GFP-LA (Fig. 1 c and d), suggesting that the abnormal localization of progerin/LAΔ50 leads to chromosome segregation defects during mitosis. Notably, similar anaphase chromosome segregation defects have been reported in Caenorhabditis elegans when the expression of lamin was down-regulated by RNAi (18). Furthermore, FACS analysis revealed an increase of G2-M index in HeLa cells expressing GFP-progerin/LAΔ50 in comparison to those expressing control GFP-LA [supporting information (SI) Fig. 6], suggesting a delay in mitotic progression in GFP-progerin/LAΔ50-expressing cells. Consistent with the FACS analysis, quantification revealed that the time cells spent in late mitosis (from anaphase to telophase) was significantly longer in GFP-progerin/LAΔ50-transfected cells than that in control GFP-LA-transfected cells (6% versus 2%, respectively), whereas the time that GFP-progerin/LAΔ50- or GFP-LA-transfected cells spent in early mitosis (from prometaphase to metaphase) is comparable (Fig. 1e). This delay suggests GFP-progerin/LAΔ50-expressing cells have difficulties in resolving the lagging chromosomes between two daughter cells in late mitosis.
Fig. 1.
Mitotic defects in GFP-progerin/LAΔ50-transfected cells (progerin/LAΔ50 is referred to as progerin in all figures). (a) Live cell images of GFP-LA- and GFP-progerin-transfected mitotic cells. (b) Immunofluorescence on GFP-LA- or GFP-progerin-transfected mitotic cells, using an anti-emerin antibody. (c) DAPI staining showing a lagging chromosome (red arrow) in a GFP-progerin-transfected anaphase cell. (d) Quantification of abnormal chromosome segregation in GFP-LA- or GFP-progerin-transfected cells. (e) Quantification of GFP-LA- or GFP-progerin-transfected cells in early (from prometaphase to metaphase) or late (from anaphase to telophase) mitosis. A significant increase of cells in late mitosis was observed when GFP-progerin was transfected. (Scale bars: 20 μm.)
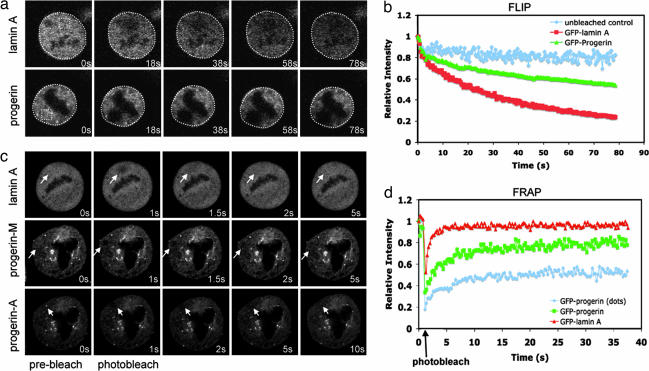
Because the abnormal localization of progerin/LAΔ50 during mitosis may affect its mobility, we next used both fluorescence loss in photobleaching (FLIP) and fluorescence recovery after photobleaching (FRAP) to measure the dynamic behavior of GFP-progerin/LAΔ50 during mitosis. Experiments were carried out in HeLa cells 48 h after transfection with either GFP-LA or GFP-progerin/LAΔ50. In FLIP, we found that the overall GFP fluorescence intensity dropped significantly faster in control GFP-LA-transfected cells than in GFP-progerin/LAΔ50-transfected cells in early mitosis (Fig. 2 a and b). Previous studies have shown that LA is normally in a free unpolymerized state during mitosis (19), but the FLIP data suggests that GFP-progerin/LAΔ50 is in a nondiffusible state, consistent with the microscopic observation (Fig. 1 a and b) that a significant fraction of progerin/LAΔ50 is either membrane-associated or in aggregates during mitosis. Using FRAP, we found that in control GFP-LA-expressing mitotic cells, the half-time (t1/2) of LA recovery is 1.5–2.5 s (Fig. 2 c and d), similar to a previous report (20). However, the t1/2 for the membrane-associated GFP-progerin/LAΔ50 recovery was increased to 5–7 s (referred to as progerin-M in Fig. 2c), with 20% remaining immobile. Furthermore, the GFP-progerin/LAΔ50 in the insoluble cytoplasmic aggregates had a much slower recovery (t1/2 >10 s) than the membrane-associated GFP-progerin/LAΔ50 in mitotic HeLa cells (referred to as progerin-A in Fig. 2c), with an increase of the immobile fraction to ≈50%. Thus, progerin/LAΔ50 associates with membranes and forms insoluble aggregates in mitosis. The abnormal localization of progerin/LAΔ50 affects its mobility and causes subsequent chromosome segregation defects and mitotic delay.
Fig. 2.
Abnormal dynamic behavior of GFP-progerin/LAΔ50 during mitosis. (a and b) FLIP analysis. (a) Selected images of GFP-LA- or GFP-progerin/LAΔ50-transfected mitotic cells during FLIP of the indicated area (yellow square). (b) Kinetics of overall FLIP (white circled area) in GFP-LA- or GFP-progerin/LAΔ50-transfected mitotic cells. (c and d) FRAP analysis. (c) Selected images of the GFP-progerin/LAΔ50- or GFP-LA-transfected mitotic cells during FRAP of the indicated area in the cytoplasm (as indicated by white arrows). Progerin-M, membrane-associated progerin/LAΔ50; progerin-A, aggregated progerin/LAΔ50 (bright dots). (d) GFP-LA or GFP-progerin/LAΔ50 FRAP kinetics in transfected mitotic cells. Values in b and d represent means from at least six different cells. Photographs were taken at ×60 magnification.
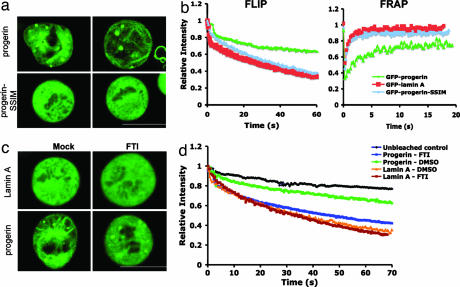
Previous studies have suggested that retention of the farnesylated C terminus causes progerin/LAΔ50 to become permanently anchored in the NE during interphase, resulting in the characteristic nuclear blebbing in HGPS (9, 11). We hypothesized here that during mitosis, C-terminal farnesylation promotes the abnormal association of progerin/LAΔ50 with cytoplasmic membrane vesicles, and therefore that blocking the farnesylation of progerin/LAΔ50 would restore its normal localization and motility during mitosis. To test this idea, we first used GFP-progerin/LAΔ50-SSIM, which cannot be farnesylated because the cysteine residue of the C-terminal CSIM motif was mutated to serine. This construct was transfected into HeLa cells and imaged after 48 h. As controls, we also transfected wt GFP-LA, GFP-progerin/LAΔ50, or GFP-LA-SSIM into HeLa cells. As predicted, GFP-progerin/LAΔ50-SSIM was not aggregated, but instead diffusely located throughout the cytoplasm (Fig. 3a), with a signal indistinguishable from that of GFP-LA or GFP-LA-SSIM (Fig. 1a and data not shown). In addition, no progerin/LAΔ50-induced membrane polymerization was observed in the GFP-progerin/LAΔ50-SSIM expressing mitotic cells (Fig. 3a). FRAP and FLIP analyses further confirmed that progerin/LAΔ50-SSIM was in an unpolymerized free state during mitosis, with its mobility very similar to that of GFP-LA (Fig. 3b).
Fig. 3.
Retention of farnesylated C terminus causes the abnormal localization and dynamic behavior of GFP-progerin/LAΔ50 during mitosis. (a) Live cell images of GFP-progerin- and GFP-progerin-SSIM-transfected mitotic cells. Two examples are shown for each type. (b) Kinetics of overall FLIP (Left) and FRAP (Right) in GFP-LA-, GFP-progerin-, and GFP-progerin-SSIM-transfected mitotic cells. (c) Live cell images of GFP-LA- or GFP-progerin-transfected mitotic cells after mock (DMSO) or FTI (2.0 μM lonafarnib) treatment for 48 h. (d) Kinetics of overall FLIP in the mitotic cells in c. Values in b and d represent means from at least five different cells. (Scale bars: 20 μm.)
Next, we explored the effect of treating GFP-progerin/LAΔ50-transfected HeLa cells with a clinical candidate FTI (lonafarnib/SCH66336). Cells were treated with two daily doses of 2.0 μM FTI (one dose at the time of transfection and the other dose 24 h later) and were analyzed 48 h after transfection. We found that the FTI treatment led to significant solubilization of progerin/LAΔ50 from membranes, leading to a mostly homogenous and diffuse signal of GFP-progerin/LAΔ50 in the mitotic cytoplasm, although some aggregates remained (Fig. 3c). Quantification revealed that ≈20% of FTI-treated GFP-progerin/LAΔ50-transfected mitotic cells showed no cytoplasmic aggregates, compared with <3% in the DMSO-treated cells (data not shown). Consistent with this finding, the FLIP analysis of these cells demonstrated that FTI treatment significantly restored the mobility of GFP-progerin/LAΔ50 (Fig. 3d). Thus, the abnormal localization and motility of progerin/LAΔ50 during mitosis is apparently attributed to its retention of C-terminal farnesylation.
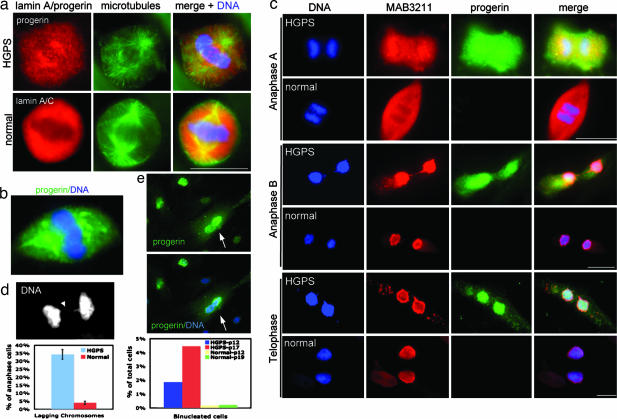
To further investigate the mitotic phenotype caused by progerin/LAΔ50, we examined primary dermal fibroblast cells from individuals with classic HGPS. Cultured fibroblasts from three HGPS patients and one unaffected parent were tested. Because all of the HGPS primary cells demonstrated similar results, here we show only the results from two cell lines: HGADFN167 (HGPS) and HGADFN168 (normal). To detect progerin/LAΔ50 in mitosis, we first carried out double immunofluorescence staining with a newly developed anti-progerin/LAΔ50 specific antibody (21) (anti-progerin) and an anti-α-tubulin antibody in mitotic HGPS fibroblast cells. In the control fibroblast cell line, we immunostained with an anti-LA/lamin C antibody MAB3211 and the same anti-α-tubulin antibody. In most of the mitotic HGPS fibroblasts, we observed that progerin/LAΔ50 was localized as numerous punctate dots throughout the cytoplasm at metaphase (Fig. 4a), while the staining of LA/lamin C in the control normal fibroblasts appeared diffuse and homogeneous (Fig. 4a), which is consistent with a previous report (20). In fewer cases (<5%), the anti-progerin antibody labeled large membrane-like aggregates in HGPS mitotic cells (Fig. 4b), resembling those observed in GFP-progerin/LAΔ50-transfected HeLa cells (Figs. 1a and 3a). Based on the intensity of the fluorescence labeling by anti-progerin, we speculate that these HGPS mitotic cells have accumulated more progerin/LAΔ50. Next, to compare the localization of progerin/LAΔ50 with wt LA simultaneously, we costained the HGPS and control normal fibroblast cells with anti-LA/lamin C antibody MAB3211 and anti-progerin, and followed progerin/LAΔ50 and LA/lamin C throughout mitosis. The epitope recognized by MAB3211 is also present in progerin/LAΔ50, so MAB3211 labels both LA/lamin C and progerin/LAΔ50 in HGPS cells, but quantitatively we expect the majority of the signal with this monoclonal antibody to arise from LA and lamin C, as progerin/LAΔ50 is synthesized at lower levels (7, 11, 22). We found that the signal of MAB3211 overlapped extensively with that of anti-progerin in HGPS cells from the onset of mitosis to metaphase (data not shown). However, interestingly, immunofluorescence analysis revealed that there is a delay in the recruitment of progerin/LAΔ50 to the NE in late mitosis compared with wt LA/lamin C in normal cells at similar mitotic stages (Fig. 4c). Specifically, when >90% of LA had accumulated around the segregated chromosomes in normal cells at anaphase B, ≈40% of progerin/LAΔ50 remained in the cytoplasm (as judged by the fluorescence intensity of the anti-progerin staining) (Fig. 4c). At telophase, when almost 100% of LA was localized in the newly reassembled nucleus in normal control cells, ≈10% of progerin/LAΔ50 still remained in the cytoplasm of the HGPS fibroblasts. These observations suggest that the membrane vesicle-associated progerin/LAΔ50 is reassembled to the NE at a slower rate than wt LA in late mitosis.
Fig. 4.
Mitotic defects in HGPS fibroblast cells. (a) Immunofluorescence on primary dermal fibroblasts from a normal father (HGADFN168) and a child with classic HGPS (HGADFN167) with anti-LA/lamin C or anti-progerin, respectively (red). The same cells were also counterstained with anti-α-tubulin (green) and DAPI for DNA (blue). (b) An example showing that anti-progerin antibody sometimes labeled large membrane-like aggregates in HGPS mitotic cells. (c) Double immunodetection with anti-progerin (green) and anti-LA/lamin C (red) antibodies on mitotic fibroblasts from a normal father (HGADFN168) and a child with classic HGPS (HGADFN167), showing delay of reassembly of progerin/LAΔ50 to the NE in late mitosis. (d) A representative image and quantification of abnormal chromosome segregation in HGPS and normal fibroblasts. Arrowhead points to a lagging chromosome. (e) Images and quantification of binucleation in the HGPS fibroblasts. Arrows point to a binucleated cell. (Scale bars: 20 μm.)
Because transfected GFP-progerin/LAΔ50 induced chromosome mis-segregation in mitotic HeLa cells, we asked whether the endogenous progerin/LAΔ50 in HGPS fibroblasts could disrupt chromosome segregation in a similar manner. Indeed, DAPI staining revealed an increased percentage of lagging chromosomes in HGPS anaphase cells (Fig. 4d; ≈30% in HGPS fibroblasts versus <5% in normal fibroblasts). In addition, quantification revealed that there was an increase in binucleated cells in HGPS fibroblasts to 2–5%, in comparison to <0.5% in control fibroblasts (Fig. 4e). Consistent with our observations here, a previous report (12) has shown an increase of polyploid (8N) cells in HGPS fibroblasts. We suggest that the binucleation observed in HGPS is caused by the failure of resolving the lagging chromosomes during cytokinesis. We also found that the percentage of binucleated HGPS cells increased with passage number, possibly caused by the accumulation of more progerin/LAΔ50 in older HGPS cells.
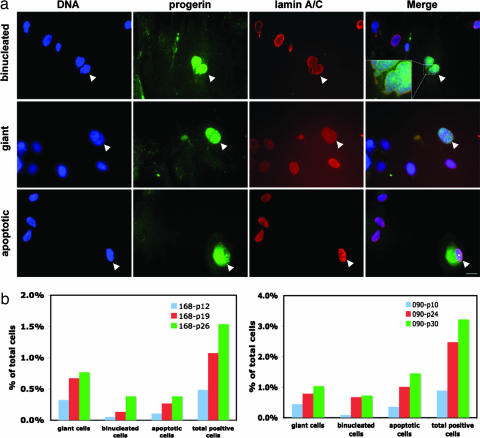
A recent study (15) provided evidence of the presence of a very small amount of the progerin/LAΔ50 transcript in normal cells, implying that the cryptic splice site in exon 11 can be used even in the presence of the normal sequence. Using anti-progerin/LAΔ50 antibody, we performed immunofluorescence to directly visualize progerin/LAΔ50 in normal human fibroblast cells. A total of four unaffected fibroblast cell lines were tested in our initial studies. Because they all behaved similarly, only the images from one normal fibroblast line are shown here. While the anti-progerin/LAΔ50 antibody showed virtually no signal in the vast majority of the normal cells as described (21), it brightly labeled a very small subpopulation of the normal nuclei (examples are shown in Fig. 5a and SI Fig. 7). Consistent with the immunofluorescence study, Western blotting analysis with this antibody detected a weak but definitive band in whole-cell lysates from normal cells (data not shown). Based on these observations, we conclude that there is a small amount of progerin/LAΔ50 present in normal fibroblasts, but that it is not uniformly distributed.
Fig. 5.
Expression of progerin/LAΔ50 in normal human fibroblasts. (a) Immunofluorescence of fibroblasts from an unaffected individual (HGADFN168), using anti-LA/lamin C (red) and anti-progerin (green). DNA is counterstained in blue with DAPI. Arrows indicate the progerin/LAΔ50-expressing normal cells. (Scale bar: 20 μm.) (b) Quantification of progerin/LAΔ50-positive normal cells in two independent normal fibroblast cell lines at various passages (HGADFN168 at passages 12, 19, and 26; HGADFN090 at passages 10, 24, and 30).
Next, we determined the abnormalities in these progerin/LAΔ50-expressing normal cells. Because of the small percentage of mitotic cells in primary fibroblasts, we did not detect any normal mitotic cells expressing progerin/LAΔ50. In the normal interphase cells, the anti-progerin antibody primarily labeled two types of nuclei: binucleated nuclei or giant nuclei (defined as a nucleus whose diameter is at least twice the length of the diameter in an average cell) (Fig. 5a). In addition, this antibody generated some diffuse staining around the hypercondensed nuclei in a few apoptotic cells (Fig. 5a). Interestingly, in the binucleated progerin/LAΔ50-positive normal cells, the unresolved chromosome bridges between two daughter nuclei were frequently detected (as shown in the high magnification image in Fig. 5a; further examples are in SI Fig. 7), indicating abnormal chromosome segregation had occurred in prior mitosis. Furthermore, as suggested by a previous study (23), the giant nuclei in progerin/LAΔ50-expressing cells are likely to be polyploidy based on their total DAPI staining intensity, which also implicates aberrant mitosis. These results suggest that progerin/LAΔ50 may contribute to the normal aging process by inducing similar mitotic defects as those seen in HGPS cells. Importantly, quantification of two independent normal fibroblast lines demonstrated that the percentages of progerin/LAΔ50-positive normal cells, including both the binucleated and the giant cells, increased with passage number (Fig. 5b), further supporting a correlation between progerin/LAΔ50-induced mitotic abnormalities and normal aging. The bimodal distribution of progerin/LAΔ50 expression in normal fibroblasts is curious and suggests the presence of some sort of irreversible switch in late-passage cells, activating the cryptic splice site in exon 11 and initiating a series of events that lead to mitotic defects and ultimate senescence.
In summary, our studies demonstrate the abnormal membrane association and dynamic behavior of progerin/LAΔ50 during mitosis, which lead to aberrant chromosome segregation in both HGPS and normal cells. These observations further implicate progerin/LAΔ50 in the normal aging process, suggesting that the same molecular mechanisms responsible for the mitotic defects in HGPS may also act at a low level in normal cells at higher passage. Taken together with results of previous studies, these data add increasing confidence to the long-held assumption that the study of genetic forms of premature aging can shed important light on the normal process of aging.
Materials and Methods
Cell Culture.
HeLa cells were cultured in DMEM (Invitrogen/GIBCO, Carlsbad, CA) supplemented with 10% FBS at 37°C. Primary human dermal fibroblasts were cultured in MEM (Invitrogen/GIBCO) supplemented with 15% FBS (Invitrogen) and 2 mM l-glutamine. The primary fibroblast cell lines used in our studies were: AG01972 (HGPS), AG06299 (normal), AG03258 (normal), and AG03257 (normal) ordered from Coriell Cell Repositories (Camden, NJ); and HGADFN167 (HGPS), HGADFN003 (HGPS), HGADFN168 (normal), and HGADFN090 (normal) from the Progeria Research Foundation (Peabody, MA). For consistency, all results in this article correspond to fibroblasts from HGADFN167 (HGPS) and HGADFN168 (normal) unless otherwise indicated.
Plasmids and Cell Transfection.
The pEGFP-myc-LA construct (referred to here as GFP-LA), the LAΔ150 construct (referred to here as GFP-progerin/LAΔ50), GFP-progerin/LAΔ50-SSIM, and GFP-LA-SSIM were described in ref. 9. HeLa cells were plated at ≈50,000 cells per chamber in two-chamber slides (Nunc, Rochester, NY). After 24 h, these cells were transiently transfected with 0.5 μg of each construct by using FuGENE 6 (Roche, Indianapolis, IN). After 48 h, these cells were either directly visualized under the microscope or fixed for further immunofluorescence studies.
GFP Localization and Immunofluorescence Study.
HeLa cells and primary fibroblasts grown on chamber slides (Nunc) were fixed either with 4% formaldehyde/PBS for 20 min at room temperature followed by a 5-min treatment with 0.5% Triton X-100/PBS or with methanol/acetone (1:1) at −20°C as described (21). The fixed cells were rinsed with PBS and blocked with 10% horse serum and 4% BSA in PBS for 30 min. Cells were then incubated for 1 h with the primary antibodies diluted in blocking solution. These antibodies included a rabbit antibody against progerin/LAΔ50 kindly provided by K. Djabali (Columbia University), a rabbit anti-emerin (Abcam, Cambridge, MA), a mouse anti-LA/lamin C (Chemicon, Temecula, CA), and a mouse anti-α-tubulin (Abcam). The secondary antibodies were Alexa 488- or 594-conjugated donkey anti-rabbit or donkey anti-mouse IgG antibodies (Molecular Probes, Carlsbad, CA). All samples were also counterstained with DAPI (Vector Laboratories, Burlingame, CA). Cells were observed with a LSM510 confocal microscope (Zeiss, Thornwood, NY) or an Axioplan fluorescence microscope (Zeiss).
Microscopy of FRAP and FLIP.
HeLa cells were plated and transfected on Lab-Tek cover glass bottom chambers (Nalge, Rochester, NY) and analyzed 48 h after transfection. FRAP and FLIP experiments were performed on an inverted confocal microscope (LSM 510; Zeiss) using the 488-nm laser. In FRAP experiments, cells were scanned four times, followed by a single bleach of a small region of interest (ROI) at full laser power for 200 ms. Single section images were then collected at 0.4-s intervals for up to 1 min. In FLIP experiments, selected areas (11 × 11 pixels) were repetitively bleached at intervals of 0.4 s with each bleaching of 200 ms at full laser power. After each bleaching round, the loss of fluorescence intensity was measured in the bleached area and the whole cytoplasm. To determine the relative fluorescence intensity of the ROIs, the fluorescence intensity in the region at each time point was normalized as described (24).
FTI Treatment.
HeLa cells were treated with one daily dose of 2.0 μM selective lonafarnib (SCH66336; Schering–Plough, Kenilworth, NJ) for 2 days, at 0 and 24 h after transfection, and analyzed at 48 h after transfection.
Supplementary Material
Acknowledgments
We thank the Schering–Plough Corporation for providing the drug lonafarnib/SCH66336, Dr. Paul Leo for support of FLIP and FRAP experiments, Dr. Stacie Anderson for support with FACS analysis, Dr. Robert Goldman for informative discussion, and Dr. Samir Kelada for helpful comments. This research was supported by the Intramural Research Program of the National Human Genome Research Institute, National Institutes of Health.
Abbreviations
- HGPS
Hutchinson–Gilford progeria syndrome
- LA
lamin A
- FTI
farnesyl transferase inhibitor
- NE
nuclear envelope
- FLIP
fluorescence loss in photobleaching
- FRAP
fluorescence recovery after photobleaching.
Footnotes
The authors declare no conflict of interest.
This article contains supporting information online at www.pnas.org/cgi/content/full/0611640104/DC1.
References
- 1.Gruenbaum Y, Margalit A, Goldman RD, Shumaker DK, Wilson KL. Nat Rev Mol Cell Biol. 2005;6:21–31. doi: 10.1038/nrm1550. [DOI] [PubMed] [Google Scholar]
- 2.Goldman RD, Gruenbaum Y, Moir RD, Shumaker DK, Spann TP. Genes Dev. 2002;16:533–547. doi: 10.1101/gad.960502. [DOI] [PubMed] [Google Scholar]
- 3.Sinensky M, Fantle K, Trujillo M, McLain T, Kupfer A, Dalton M. J Cell Sci. 1994;107:61–67. doi: 10.1242/jcs.107.1.61. [DOI] [PubMed] [Google Scholar]
- 4.Capell B, Collins F. Nat Rev Genet. 2006;7:940–952. doi: 10.1038/nrg1906. [DOI] [PubMed] [Google Scholar]
- 5.DeBusk FL. J Pediatr. 1972;80:697–724. doi: 10.1016/s0022-3476(72)80229-4. [DOI] [PubMed] [Google Scholar]
- 6.Baker PB, Baba N, Boesel CP. Arch Pathol Lab Med. 1981;105:384–386. [PubMed] [Google Scholar]
- 7.Eriksson M, Brown WT, Gordon LB, Glynn MW, Singer J, Scott L, Erdos MR, Robbins CM, Moses TY, Berglund P, et al. Nature. 2003;423:293–298. doi: 10.1038/nature01629. [DOI] [PMC free article] [PubMed] [Google Scholar]
- 8.De Sandre-Giovannoli A, Bernard R, Cau P, Navarro C, Amiel J, Boccaccio I, Lyonnet S, Stewart CL, Munnich A, Le Merrer M, et al. Science. 2003;300:2055. doi: 10.1126/science.1084125. [DOI] [PubMed] [Google Scholar]
- 9.Capell BC, Erdos MR, Madigan JP, Fiordalisi JJ, Varga R, Conneely KN, Gordon LB, Der CJ, Cox AD, Collins FS. Proc Natl Acad Sci USA. 2005;102:12879–12884. doi: 10.1073/pnas.0506001102. [DOI] [PMC free article] [PubMed] [Google Scholar]
- 10.Young SG, Fong LG, Michaelis S. J Lipid Res. 2005;46:2531–2558. doi: 10.1194/jlr.R500011-JLR200. [DOI] [PubMed] [Google Scholar]
- 11.Goldman RD, Shumaker DK, Erdos MR, Eriksson M, Goldman AE, Gordon LB, Gruenbaum Y, Khuon S, Mendez M, Varga R, et al. Proc Natl Acad Sci USA. 2004;101:8963–8968. doi: 10.1073/pnas.0402943101. [DOI] [PMC free article] [PubMed] [Google Scholar]
- 12.Ly DH, Lockhart DJ, Lerner RA, Schultz PG. Science. 2000;287:2486–2492. doi: 10.1126/science.287.5462.2486. [DOI] [PubMed] [Google Scholar]
- 13.Csoka AB, English SB, Simkevich CP, Ginzinger DG, Butte AJ, Schatten GP, Rothman FG, Sedivy JM. Aging Cell. 2004;3:235–243. doi: 10.1111/j.1474-9728.2004.00105.x. [DOI] [PubMed] [Google Scholar]
- 14.Yang SH, Bergo MO, Toth JI, Qiao X, Hu Y, Sandoval S, Meta M, Bendale P, Gelb MH, Young SG, et al. Proc Natl Acad Sci USA. 2005;102:10291–10296. doi: 10.1073/pnas.0504641102. [DOI] [PMC free article] [PubMed] [Google Scholar]
- 15.Scaffidi P, Misteli T. Science. 2006;311:1059–1063. doi: 10.1126/science.1127168. [DOI] [PMC free article] [PubMed] [Google Scholar]
- 16.Lourim D, Krohne G. Trends Cell Biol. 1994;4:314–318. doi: 10.1016/0962-8924(94)90228-3. [DOI] [PubMed] [Google Scholar]
- 17.Collas P. Trends Cell Biol. 2000;10:5–8. doi: 10.1016/s0962-8924(99)01697-9. [DOI] [PubMed] [Google Scholar]
- 18.Liu J, Rolef Ben-Shahar T, Riemer D, Treinin M, Spann P, Weber K, Fire A, Gruenbaum Y. Mol Biol Cell. 2000;11:3937–3947. doi: 10.1091/mbc.11.11.3937. [DOI] [PMC free article] [PubMed] [Google Scholar]
- 19.Gerace L, Blobel G. Cell. 1980;19:277–287. doi: 10.1016/0092-8674(80)90409-2. [DOI] [PubMed] [Google Scholar]
- 20.Broers JL, Machiels BM, van Eys GJ, Kuijpers HJ, Manders EM, van Driel R, Ramaekers FC. J Cell Sci. 1999;112:3463–3475. doi: 10.1242/jcs.112.20.3463. [DOI] [PubMed] [Google Scholar]
- 21.McClintock D, Gordon LB, Djabali K. Proc Natl Acad Sci USA. 2006;103:2154–2159. doi: 10.1073/pnas.0511133103. [DOI] [PMC free article] [PubMed] [Google Scholar]
- 22.Columbaro M, Capanni C, Mattioli E, Novelli G, Parnaik VK, Squarzoni S, Maraldi NM, Lattanzi G. Cell Mol Life Sci. 2005;62:2669–2678. doi: 10.1007/s00018-005-5318-6. [DOI] [PMC free article] [PubMed] [Google Scholar]
- 23.Chi H, Ishibashi Y, Shima A, Mihara I, Otsuka F. J Invest Dermatol. 1990;95:154–157. doi: 10.1111/1523-1747.ep12477921. [DOI] [PubMed] [Google Scholar]
- 24.Vong Q, Cao K, Li H, Iglesias P, Zheng Y. Science. 2005;310:1499–1504. doi: 10.1126/science.1120160. [DOI] [PubMed] [Google Scholar]
Associated Data
This section collects any data citations, data availability statements, or supplementary materials included in this article.


