

Abstract
Capillary electrophoresis in 770 nanometer inner diameter capillaries coupled to electrochemical detection with an etched electrode matching an etched capillary (etched electrochemical detection) has been used with ultrasmall sampling to inject subcellular samples from intact single mammalian cells. Separations of cytoplasmic samples taken from rat pheochromocytoma cells have been achieved. As little as 8% of the total volume of a single cell has been sampled and analyzed. Dopamine has been identified and quantified in these PC12 cells using this technique. The average cytoplasmic level of dopamine in rat pheochromocytoma cells has been determined to be 240 ± 60 μM. The use of electrophoresis in 770 nanometer inner diameter capillaries with electrochemical detection to monitor cytoplasmic neurotransmitters at the single cell level can provide information about complex cellular functions such as neurotransmitter storage and synthesis.
Keywords: Capillary electrophoresis, Electrochemical detection, Single cell analysis, Rat pheochromocytoma cells, Cytoplasm
1. Introduction
Knowledge of cellular dynamics at the single cell level is essential to understanding complex processes such as cell communication, chemical storage, and response to external stimuli. Whole cell analysis has provided valuable information about the content and behavior of single cells. Extensive studies of whole invertebrate as well as mammalian cells have been performed using capillary electrophoresis (CE) and have been extensively reviewed [1 – 3]. Pushing beyond a single cell, subcellular analysis builds on the information provided by whole cell studies by imparting spatial and temporal information regarding cellular contents [4].
Several sampling methods have been developed to probe subcellular compartments in both invertebrate and mammalian cells with CE. Single vesicles from invertebrate cells have been analyzed using optical trapping and CE coupled to laser-induced fluorescence (LIF) detection [5]. Li et al. have applied a laser pulse sampling technique to analyze the tip of a PC12 (rat phenochromocytoma) cell [6]. Furthermore, individual mitochondria prepared from mammalian cells have been identified with LIF detection as they elute from a CE capillary [7, 8]. Subcellular fractions containing nuclei, organelles, and cytosolic components prepared from mammalian cells have been examined using CE with LIF detection [9].
In addition to the aforementioned studies of subcellular components, subcellular analysis of cell cytoplasm can provide insight into complex cellular processes. Neurotransmitter synthesis, metabolism, storage, and release are directly affected by cytoplasmic neurotransmitter levels [10]. The levels of neurotransmitters present in cell cytoplasm have implications for drug addiction and various neurodegenerative diseases such as Parkinson3s disease [10]. Therefore, it is imperative to develop analytical tools capable of monitoring cytoplasmic concentrations of these neurotransmitters at the single cell level.
Direct sampling and analysis of the cytoplasm of an intact invertebrate cell has previously been achieved [11 – 13]. CE in a 5-μm inner diameter (i.d.) capillary was used to directly sample less than 1% of the total volume of single pond snail neurons. However, subcellular CE investigations of mammalian cells, which are approximately four orders of magnitude smaller in volume than invertebrate cells (500 fL for a mammalian cell versus 4 nL for an invertebrate cell), have been prohibited by the volume constraints of the technique [1, 11]. Recently, CE in nanometer i.d. capillaries was investigated [14]. The extremely low volume capacity of these capillaries has allowed femtoliter (fL) injections of samples and is highly amenable to single cell analysis. Additionally, improvements in end-column amperometric detection for nanometer i.d. capillaries was recently reported [14].
In this paper, the use of CE in 770 nanometer i.d. capillaries coupled to enhanced etched EC detection is investigated as a nondestructive method for the injection of subcellular samples from intact single mammalian cells. Separations of cytoplasmic samples taken from individual PC12 have been achieved. As little as 8% of the total volume of a mammalian cell has been sampled and subsequently analyzed using this specialized technique. A neurotransmitter known to be present in PC12 cells, DA (dopamine), has been identified and quantified in these samples. Noting that the PC12 cell line we use does not appear to contain norepinephrine [15], the average cytoplasmic level of DA in three sampled cells has been tentatively determined to be 240 ± 60 μM.
2. Experimental
2.1. Chemicals
Dopamine (DA), catechol (CAT), 3,4-dihydroxyphenyl-acetic acid (DOPAC), N-trishydroxymethyl]methyl-2-aminoethanesulfonic acid (TES), N-[2-hydroxyethyl]piper-azine-N-[2-ethanesulfonic acid], and d-(+)-glucose were from Sigma (St. Louis, Missouri). A 48% aqueous solution of hydrofluoric acid was from Aldrich (Milwaukee, Wisconsin). All chemicals were used as received. The separation buffer employed was 50 mM TES containing 2% 1-propanol adjusted to pH 7.2 with sodium hydroxide. All standards were prepared as 100 mM stock solutions in 0.1 M perchloric acid and were diluted to the desired concentrations with separation buffer. Physiological saline was prepared as previously described and adjusted to pH 7.7 with sodium hydroxide [16].
2.2. Cell Culture
PC12 cells were purchased from American Type Culture Collection (Manassas, VA) and maintained as previously described [17]. Briefly, the cells were grown on 35 mm culture dishes coated with mouse collagen IV (Becton Dickinson, Bedford, MA) in RPMI-1640 medium (Gibco BRL, Grand Island, NY) supplemented with horse serum (VWR, Pittsburgh, PA), fetal bovine serum (VWR, Pittsburgh, PA) and penicillin-streptomycin (Sigma, St. Louis, MO). The cells were kept in a 7% CO2 atmosphere at 37 °C. The cells were subcultured approximately every 7 to 9 days and then used for experiments within 7 days of subculturing. Prior to performing experiments, the cell medium in the culture dishes was removed and replaced with physiological saline.
2.3. Instrumentation
A CE system with end-column amperometric detection was utilized. This system has been previously described [18, 19]. Briefly, 90 to 95 cm of fused-silica capillary with an outer diameter of 150 μm and i.d. of 770 ± 40 nm (Polymicro Technologies, Phoenix, Arizona) served as the separation column. The i.d. of the capillaries was confirmed using scanning electron microscopy and is reported as the average and standard deviation of four measurements. Amperometric detection was performed using a two-electrode configuration. A 5-μm diameter carbon fiber (Amoco Performance Products, Greenville, SouthCarolina) was employed as a working electrode. The carbon fiber microelectrode was positioned inside the end of the capillary with a micromanipulator. EC detection was performed at 0.7 mV (vs. a Ag/AgCl reference electrode). The detection system was enclosed in a copper-mesh Faraday cage to minimize external noise. Injections were performed electrokinetically and injection volumes were calculated based on electroosmotic flow measured with a neutral marker, CAT (catechol).
2.4. Procedures
2.4.1. Capillary Filling
The ultrasmall capillaries were filled with the use of a liquid chromatography pump (Scientific Systems, State College, Pennsylvania). This procedure has been previously described [20]. The capillaries were filled with a mixture of methanol and doubly distilled water at pressures of 4000 to 5000 psi.
2.4.2. Microinjector Fabrication
A microinjector was fabricated at the injection end of the capillary similar to a previous report [11]. Approximately 1 cm of the polyimide coating was removed from the capillary to expose the fused-silica. The exposed portion of the capillary was placed in hydrofluoric acid. After 10 min, the capillary was removed from the hydrofluoric acid approximately 2 mm such that approximately 8 mm remained in the etching solution. Exposure to hydrofluoric acid continued for an additional 35 min. When etching was complete, the capillary was placed in a sodium bicarbonate solution to neutralize the acid and then washed with water. Using a scalpel, the tip of the etched portion of the capillary was trimmed to maintain the 770 nanometer i.d. After trimming, the exposed portion of the capillary was placed back into the hydrofluoric acid for an additional 1 to 10 min to create a tapered microinjector with a tip outer diameter of 2.5 μm. To increase the stability of the microinjector, a 5-cm piece of 0.75 mm i.d. glass capillary (Sutter Instruments Company, Novato, California) was used as a holder. The capillary was threaded through the glass capillary and then glued in place so that only the microinjector protruded from the holder.
2.4.3. End-Column Detection
Approximately 2 mm of the polyimide coating was removed from the detection end of the capillary again exposing the fused-silica. The exposed portion of the capillary was placed in hydrofluoric acid for 5 minutes in order to enlarge the i.d. and accommodate the positioning of the carbon fiber microelectrode. After etching was complete, the exposed portion of the capillary was placed in a sodium bicarbonate solution to neutralize the acid and then washed with water.
2.4.4. Microelectrode Fabrication
The 5 μm carbon fiber electrodes employed in these experiments were modified by etching in an acetylene flame. The electrode was positioned in the flame at a 45° angle for 1 to 2 s and then quickly removed, resulting in a conical tip as shown in Figure 1. The conical tip allows for better alignment between the capillary bore and the electrode thus resulting in a minimization of dead volume at the detector and an improvement in peak efficiency, coulometric efficiency, and detection limits [14].
Fig. 1.
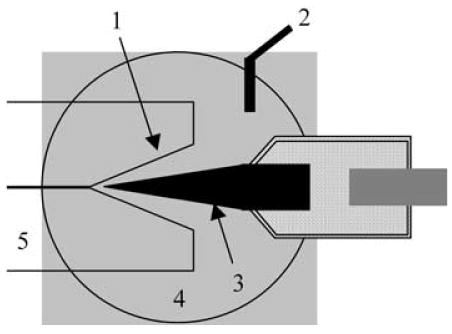
Schematic of etched end-column amperometric detector. 1) capillary i.d. etched to 13 μm; 2) Ag/AgCl reference electrode; 3) carbon fiber microelectrode flame-etched to 2.5 μm; 4) buffer reservoir; 5) separation capillary.
2.4.5. Cell Cytoplasm Injections
Injections of samples taken from PC12 cells were performed with the aid of electroporation [21, 22]. A platinum wire was used as a counter electrode and placed in contact with the physiological saline in the cell culture dish. With the use of a microscope and a micromanipulator (World Precision Instruments, Sarosota, Florida), the microinjector fabricated at the end of the ultrasmall capillary was positioned against the cell with enough force to cause a slight indentation in the cell membrane. A voltage of either 2 or 3 kV was applied between the CE capillary and the electrode in the culture dish for between 2 and 6 s. This applied voltage eases the penetration of the cell membrane with the microinjector and causes the electrokinetic injection of a subcellular sample. All injections were performed on a Benchtop Vibration Isolation System (Newport, Irvine, California).
3. Results and Discussion
3.1. Enhanced End-Column Amperometric Detection for Nanometer i.d. Capillaries
To achieve analysis of subpicoliter samples from small mammalian cells, etched end-column amperometric detection was utilized. This detection scheme involved modification of the traditional capillary etching procedures employed for end-column detection, using the method previously reported by Woods et al. [14]. To facilitate the enhanced detection necessary for small volume analysis, the 770 nm i.d. capillary was etched in hydrofluoric acid to create a 13-μm opening at the capillary tip, with a depth of approximately 250 to 290 μm. A 5-μm carbon fiber electrode was flame-etched to create a 2.5-μm diameter conical tip with an electroactive length of 200 to 400 μm. The etching of both the capillary and the microelectrode enabled enhanced alignment of the detector, as illustrated in Figure 1. Placement of the microelectrode close to the unetched portion of the capillary greatly limits the dead volume of the detector [14].
3.2. Improvements in Detection Parameters
The improved alignment between the etched capillary and the flame-etched electrode greatly enhanced peak efficiency, coulometric efficiency, and the limits of detection for standards DA and CAT. Table 1 displays the results of each of these analyses performed in 770 nm i.d. capillaries with an etched 13-μm capillary opening. The values represent the average and standard deviation of three separations performed employing this detection scheme. Minimizing the dead volume of the detector by improving alignment facilitated a decrease in band broadening, thus peak efficiency increased. Moreover, the average coulometric efficiency for DA, although not extremely high, represents a significant improvement in sensitivity when compared to the traditional end-column detection design and implies an improvement in microelectrode-capillary alignment to reduce dead volume [14]. Zeptomole detection limits were attained for both standards, demonstrating the ability of the enhanced detection scheme to elucidate DA, as well as neutral analytes that may be present in a mammalian cell.
Table 1.
Detection of dopamine and catechol using etched end-column electrochemical detection. Separations were performed in 770 nm i.d. capillaries with a 13-μm etch at the detection end. All values are the average of three separations on three different capillaries using three unique electrodes ± the standard deviation.
| Dopamine | Catechol | |
|---|---|---|
| Peak Efficiency | 60 000 ± 50 000 | 80000 ± 20000 |
| Coulometric Efficiency | 70 ± 10% | 40 ± 20% |
| Detection limit [zmol] | 400 ± 100 | 410 ± 80 |
3.3. Sampling from a Mammalian Cell
Preliminary experiments have been carried out using PC12 cells. These cells serve as a model for catecholamine-containing nerve cells because they contain DA and possess the same mechanisms for the storage, transport and release of catecholamines [23]. In addition, PC12 cells are well-characterized and easy to maintain in culture [23]. A preliminary injection from an intact 10-μm diameter PC12 cell has been achieved (Figure 2a). The injection volume for this separation was 510 fL based on the mobility of catechol. This volume corresponds to roughly 97% of the total cell volume. All cells were observed microscopically prior to, and immediately following each injection and appeared deflated after the injection was performed. Several peaks are observed in the electropherogram including one eluting at 12.2 min. An injection of a standard DA and CAT solution has been performed on the same capillary where DA eluted at 12.0 min (Figure 2b). Combined with the knowledge that these cells contain DA and peak shifting is common for biological samples, the peak at 12.2 min in the separation of the subcellular sample has been tentatively identified as DA. The small variation in the migration time of DA is most likely the result of cellular material adsorbing to the capillary wall thus changing electroosmotic flow. To further confirm that DA is being sampled from the interior of the cell, a sample of the physiological saline from the cell culture dish has been injected (Figure 2c). A peak with a migration time comparable to that of DA is not observed; therefore it is believed subcellular cytoplasmic injection has been achieved.
Fig. 2.
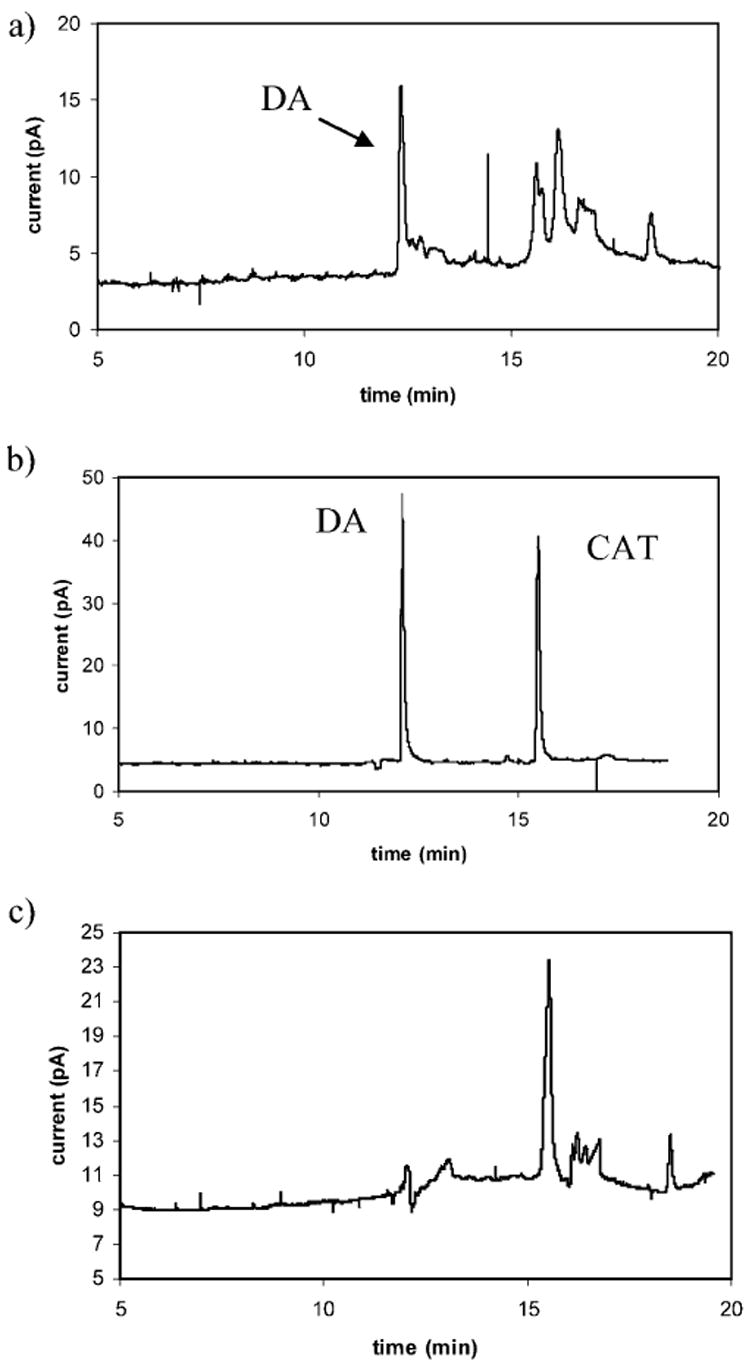
Comparison of the electropherograms obtained using a) 510-fL sample injected from 10-μm diameter PC12 cell, b) 500 μM solution of DA and CAT, and c) sample of physiological saline injected from the cell culture dish. A large neutral peak is almost always observed due to the presence of physiological saline. Subcellular sample and physiological saline injections: 6-s at 3 kV. Standard solution injection: 10-s at 10 kV. All separations were performed using a 25-kV separation potential and 50 mM TES (pH 7.2) separation buffer with 2% 1-propanol.
3.4. Determination of DA in the Cytoplasmic Compartment
The analysis discussed above represents a separation of almost the entire contents of a cell. The low volume capabilities of nanometer i.d. capillaries employed in CE allows for injection of a portion of the cell cytoplasm. Coupled to enhanced etched EC (electrochemical) detection, this technique provides the sensitivity necessary to monitor analytes in ultrasmall samples. Figure 3a shows an injection from an intact 10-μm diameter PC12 cell. The injection volume for this separation is 38 fL, corresponding to roughly 37% of the total cell volume. Several peaks are observed in the electropherogram including one eluting at 11.8 min. A standard injection of a DA and CAT solution has been performed on the same capillary and DA eluted at 11.5 min (Figure 3b). Thus, it is reasonable to assume that the peak at 11.8 min in the separation of the subcellular sample is the result of cellular DA.
Fig. 3.
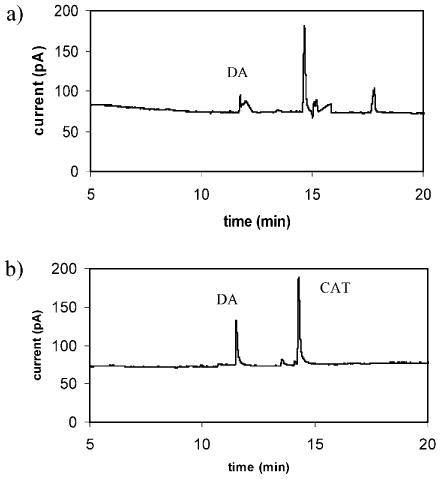
Electropherograms comparing a) 38-fL sample injected from a 10-μm diameter PC12 cell and b) 1 mM standard solution of DA and CAT. A 5-s injection at 3 kV was employed for both samples. Separation conditions as in Figure 2.
Using the separation of the standard DA and CAT solution as well as the relationship between peak area and amount of analyte, the concentration of DA in a single cytoplasmic sample is calculated to be 267 μM. Cytoplasmic analysis has been performed on two additional PC12 cells where the injection volume is calculated to be less than 40% of the total cell volume. The total cell volumes, percentages of that volume injected, and DA concentrations are given in Table 2.
Table 2.
Determination of DA in subcellular samples taken from PC12 cells. Separations were performed using a 770 nm i.d. capillary, injection voltages ranging from 2 to 3 kV, injection times ranging from 2 to 5 s, a 25-kV separation potential and a 50 mM TES (pH 7.2) separation buffer with 2% 1-propanol. Cell volumes were crudely estimated using the cell radius and modeling the cell as a sphere. The DA concentrations were calculated using a separation of a standard DA and CAT solution performed on the same capillary and the linear relationship between peak area and amount of analyte.
| Cell volume (pL) | % of cell volume injected | Concentration of DA in cytoplasmic sample (μM) |
|---|---|---|
| 0.52 | 27 | 328 |
| 1.02 | 8 | 119 |
| 1.02 | 37 | 267 |
The mean concentration and standard error of DA in these cytoplasmic samples is 240 ± 60 μM. The DA concentration determined with this direct sampling method is higher than what has been reported using other techniques that examine the concentrations in free cytoplasm. The concentration of catecholamines in PC12 cell cytoplasm has been estimated to range from 0.5 to 1.0 μM by measuring the activity of enzymes involved in the metabolism of catechol-amines in extracts of these cells [24]. In a recent study, intracellular patch electrochemistry estimated the concentration of catecholamines in PC12 cell cytoplasm to be in the range from 5 to 50 μM [10].
The discrepancy between the mean DA concentration reported here and those determined using alternate techniques is evidence that we are sampling dense core vesicles in addition to free cytoplasm. A number of vesicles may be electrokinetically injected with the cytoplasm and subsequently lysed within the capillary. The DA detected would thus be the sum of the free cytoplasmic DA and the DA contained in these vesicles. If the concentration of catechol-amine in the PC12 cell free cytoplasm is in the range of 5 to 50 μM, as reported from intracellular patch electrochemistry [10], then 190 μM to 235 μM of the 240 μM total DA detected in these experiments is contributed from injected vesicles. The average total electrokinetic injection volume is 200 fL, which corresponds to 37.8 to 46.8 attomoles of DA in the vesicle pool sampled.
The mean PC12 cell vesicle radius is 79 ± 0.5 nm and the average catecholamine concentration in these vesicles is 148 ± 7 mM [25]. Thus, the mole contribution from a single vesicle is 0.31 attomoles. Dividing the total moles of DA contributed by vesicles by the number of moles in a single vesicle, the number of vesicles injected can be approximated to be in the range of 120 to 150 vesicles. This number of vesicles represents 12% to 15% of the total vesicles in a PC12 cell, assuming 1000 dense core vesicles [26]. This percentage is smaller than the average total injection volume of approximately 24%. The difference can be explained because vesicles are not homogeneously distributed throughout the cell and therefore may not be homogeneously sampled. Additionally, some vesicles are more difficult to inject as they adhere to the cytoskeleton of the cell. Thus, it is realistic to presume and average of 120 to150 vesicles are being injected together with the free cytoplasm using the electrokinetic sampling method. Future work will involve the application of techniques to definitively quantify DA in the two compartments sampled.
4. Conclusions
CE in 770 nanometer i.d. capillaries coupled to enhanced etched EC detection has been utilized as a non-destructive method for the injection of subcellular samples from intact single mammalian cells. Separations of cytoplasmic samples taken from PC12 cells have been achieved, and as little as 8% of the total volume of a mammalian cell has been sampled and analyzed using this technique. DA has been identified and quantified in these cell samples and the average cytoplasmic level has been determined to be 240 ± 60 μM under the conditions employed.
CE in ultrasmall capillaries should lead to many new and exciting investigations in single cell analysis. Knowledge of neurotransmitter levels in the cytoplasm of individual cells will provide insight into neurotransmitter storage and synthesis and could be used to develop and enhance models of neurotransmitter transport across cell and vesicle membranes. In addition, this powerful sampling technique could be used for investigation of the effects of drug treatment on neurotransmitter storage, transport, and release at the single cell and cytoplasmic level.
Acknowledgments
This work was supported by the National Science Foundation and the National Institute of Health.
References
- 1.Chen GY, Ewing AG. Crit Rev Neurobiol. 1997;11:59. doi: 10.1615/critrevneurobiol.v11.i1.40. [DOI] [PubMed] [Google Scholar]
- 2.Jankowski JA, Tracht S, Sweedler JV. Trends Anal Chem. 1995;14:170. [Google Scholar]
- 3.Yeung ES. J Chromatogr A. 1999;830:243. doi: 10.1016/s0021-9673(98)00920-0. [DOI] [PubMed] [Google Scholar]
- 4.Stuart JN, Sweedler JV. Anal Bioanal Chem. 2003;375:28. doi: 10.1007/s00216-002-1609-z. [DOI] [PubMed] [Google Scholar]
- 5.Chiu DT, Lillard SJ, Scheller RH, Zare RN, Rodriguez-Cruz SE, Williams ER, Orwar O, Sandberg M, Lundqvist JA. Science. 1998;279:1190. doi: 10.1126/science.279.5354.1190. [DOI] [PubMed] [Google Scholar]
- 6.Li H, Sims CE, Wu HY, Allbritton NL. Anal Chem. 2001;73:4625. doi: 10.1021/ac0105235. [DOI] [PubMed] [Google Scholar]
- 7.Strack A, Duffy CF, Malvey M, Arriaga EA. Anal Biochem. 2001;294:141. doi: 10.1006/abio.2001.5148. [DOI] [PubMed] [Google Scholar]
- 8.Duffy CF, Fuller KM, Malvey MW, O3Kennedy R, Arriaga EA. Anal Chem. 2002;74:171. doi: 10.1021/ac010939i. [DOI] [PubMed] [Google Scholar]
- 9.Anderson AB, Ciriacks CM, Fuller KM, Arriaga EA. Anal Chem. 2003;75:8. doi: 10.1021/ac020426r. [DOI] [PubMed] [Google Scholar]
- 10.Mosharov EV, Gong LW, Khanna B, Sulzer D, Lindau M. J Neurosci. 2003;23:5835. doi: 10.1523/JNEUROSCI.23-13-05835.2003. [DOI] [PMC free article] [PubMed] [Google Scholar]
- 11.Olefirowicz TM, Ewing AG. Anal Chem. 1990;62:1872. doi: 10.1021/ac00216a026. [DOI] [PubMed] [Google Scholar]
- 12.Olefirowicz TM, Ewing AG. J Neurosci Methods. 1990;34:11. doi: 10.1016/0165-0270(90)90036-f. [DOI] [PubMed] [Google Scholar]
- 13.Olefirowicz TM, Ewing AG. Chimia. 1991;45:106. [Google Scholar]
- 14.Woods LA, Ewing A. ChemPhysChem. 2003;4:207. doi: 10.1002/cphc.200390032. [DOI] [PubMed] [Google Scholar]
- 15.Kozminski KD, Gutman DA, Davila V, Sulzer D, Ewing AG. Anal Chem. 1998;70:3123. doi: 10.1021/ac980129f. [DOI] [PubMed] [Google Scholar]
- 16.Colliver TL, Pyott SJ, Achalabun M, Ewing AG. J Neurosci. 2000;20:5276. doi: 10.1523/JNEUROSCI.20-14-05276.2000. [DOI] [PMC free article] [PubMed] [Google Scholar]
- 17.Kozminski KD, Gutman DA, Davila V, Sulzer D, Ewing AG. Anal Chem. 1998;70:3123. doi: 10.1021/ac980129f. [DOI] [PubMed] [Google Scholar]
- 18.Huang Z, Ewing Sloss. Anal Chem. 1991;62:189. doi: 10.1021/ac00002a020. [DOI] [PubMed] [Google Scholar]
- 19.Sloss E. Anal Chem. 1993;65:577. [Google Scholar]
- 20.Woods LA, Roddy TP, Paxon TL, Ewing AG. Anal Chem. 2001;73:3687. doi: 10.1021/ac010053e. [DOI] [PubMed] [Google Scholar]
- 21.Ryttsen F, Farre C, Brennan C, Weber SG, Nolkrantz K, Jardemark K, Chiu DT, Orwar O. Biophys J. 2000;79:1993. doi: 10.1016/S0006-3495(00)76447-2. [DOI] [PMC free article] [PubMed] [Google Scholar]
- 22.Nolkrantz K, Farre C, Brederlau A, Karlsson RI, Brennan C, Eriksson PS, Weber SG, Sandberg M, Orwar O. Anal Chem. 2001;73:4469. doi: 10.1021/ac010403x. [DOI] [PubMed] [Google Scholar]
- 23.Clark RA, Ewing AG. Mol Neurobio. 1997;15:1. doi: 10.1007/BF02740612. [DOI] [PubMed] [Google Scholar]
- 24.Perlman RLSBE. Biochem Biophys Acta. 1982;719:334. doi: 10.1016/0304-4165(82)90107-6. [DOI] [PubMed] [Google Scholar]
- 25.Anderson BB, Zerby SE, Ewing AG. J Neurosci Methods. 1999;88:163. doi: 10.1016/s0165-0270(99)00023-0. [DOI] [PubMed] [Google Scholar]
- 26.Kasai H, Takagi H, Ninomiya Y, Kishimoto T, Ito K, Yoshida A, Yoshioka T, Miyashita Y. J Physio London. 1996;494:53. doi: 10.1113/jphysiol.1996.sp021475. [DOI] [PMC free article] [PubMed] [Google Scholar]