Abstract
During and after measles virus (MV) infection humans are highly susceptible to opportunistic infections because of a marked immunosuppressive effect of the virus. The mechanisms by which the virus induces this phenomenon is not well understood. In particular, detailed information is missing on the targets of suppression in relation to antigen-specific T and B cell responses. Because such studies require animal experiments, we used the cotton rat model, in which the MV causes a respiratory tract infection. Primary as well as secondary T cell responses were impaired in vivo and ex vivo by MV infection. The proliferation of T cells was greatly reduced, but their effector functions, such as cytolysis or cytokine secretion, were not. In contrast, primary and secondary B cell responses in vivo as measured by the frequency of antigen-specific plasma cells in an enzyme-linked immunospot (ELISPOT) assay were not altered by MV infection. Only the secretion of immunoglobulins was reduced slightly in animals primarily infected with MV after 2 weeks. These data demonstrate that MV-induced immunosuppression acts primarily on the T cell responses in vivo.
Measles virus (MV) infection leads to acute measles with fever and rash in seronegative individuals. For weeks to months after the acute disease, children are highly susceptible to opportunistic infections as a result of MV-induced immune suppression (for review, see ref. 1). In contrast to HIV infection, where the depletion of infected CD4 T cells and the subsequent lack of help for CD8 T cells during the late phase of the disease are known to be the main mechanisms of immune suppression, it is not well understood to what extent the immune response is impaired during MV infection. Ex vivo, proliferation of peripheral blood lymphocytes from humans and accidentally infected monkeys in response to both T cell and B cell mitogens is reduced (for review, see ref. 1). In vitro, a plethora of B and T cell functions have been demonstrated to be impaired by MV infection including proliferation and secretion of cytokines and immunoglobulins (for review, see ref. 2). However, it is not known how far tissue culture experiments reflect the in vivo situation.
To address the question of whether in vivo both T and B cell responses are suppressed by MV we have used the cotton rat model (Sigmodon hispidus) because such studies are difficult to carry out in patients. Cotton rats (outbred and inbred animals) are the only rodents susceptible to MV infection of the respiratory tract (3, 4), and this infection is accompanied by an inhibition of B and T cell responses ex vivo after mitogen stimulation. In this paper, with the cotton rat model we demonstrate that in vivo primary and secondary antigen-specific T cell responses are severely suppressed during MV infection whereas B cells are only slightly affected.
Methods
Infection and Immunization of Animals.
Four- to eight-week-old inbred cotton rats (strain cotton N/Ico; Iffa Credo) of both sexes were used. Animals were infected with 2–4 × 10⁶ plaque-forming units (pfu) of MV Edmonston strain intranasally. For immunizations, 107 mouse spleen cells [mixed leukocyte reaction (MLR)], 2 × 10⁶ pfu of vaccinia virus MVA strain (5), 100 or 1,000 μg of 2,4-dinitrophenyl-conjugated keyhole limpet hemocyanin (KLH-DNP), or 1 ml of normal horse serum (NHS) containing equine immunoglobulins was given i.p.
Proliferation Assays.
Cotton rat spleen cells (5 × 10⁵ per well of a 96-well plate) were stimulated in triplicate with 5 × 10⁵ mitomycin C-treated mouse spleen cells, 15 μg/ml KLH (Calbiochem), 5% NHS (GIBCO), or 2.5 μg/ml Con A (Sigma). B cell stimulation was done by incubation with a cross-reactive rabbit anti-rat-Ig serum for an hour followed by the addition of a donkey anti-rabbit-Ig (Dianova, Hamburg, Germany) serum and 10 μg/ml Salmonella typhosa lipopolysaccharide (Sigma). Cultures were labeled with [3H]thymidine after 2 days for 16–20 h and harvested as described (4).
Stimulation of Cytotoxic T Cells and Lysis Assay.
For MLR, 1.5 × 10⁷ spleen cells from cotton rats were stimulated with 1.5 × 10⁷ mitomycin C-inactivated mouse (C3H strain) spleen cells in an upright, 50-ml flask containing 20 ml of RPMI medium 1640/10% FCS and 2 × 10⁻⁵ M 2-mercaptoethanol. Five days after in vitro stimulation, T cells were counted and cytotoxic activity was assessed by a standard chromium (Na51CrO4; DuPont) release assay. L929 (mouse fibroblast) cells and primary cotton rat fibroblasts were used as target cells. Natural killer cell activity in cotton rats was monitored by lysis of YAC1 cells (data not shown) and never exceeded background levels of lysis.
For vaccinia virus-specific (strain MVA) (5) cytotoxic T cells, 1.5 × 10⁷ spleen cells from immune animals were stimulated with mitomycin C-inactivated MVA-infected [multiplicity of infection (moi) of 1 for 1 h] spleen cells from naive animals as stimulator cells. Two days later, 5% IL-2-containing supernatant from Con A-stimulated rat spleen cells was added. Five days after in vitro stimulation, cells were counted and tested against MVA-infected and noninfected cotton rat macrophages (moi of 4 for 6 h). To obtain macrophages, cotton rats were inoculated with 5 × 10⁶ colony-forming units of Listeria monocytogenes (strain EGD) i.p. Three days later, macrophages with a purity of about 90% (as shown by adherence) were obtained by peritoneal lavage.
Cytokine Assays.
Cytokines were measured with bioassays (6). Supernatants of 5 × 10⁷ spleen cells in 5 ml of RPMI medium 1640/10% FCS were stimulated with 15 μg/ml KLH and harvested after 24 [IL-2 and tumor necrosis factor (TNF)] to 48 h (IFN-γ) and tested for cytokine secretion. IL-2 was measured by growth of the CTLL-2 CL 3 cell line. Its growth depends on supplementation with mouse, rat, or cotton rat IL-2. TNF was measured by the induction of cell death of L929 cells after incubation with actinomycin D (Sigma). IFN-γ activity was measured as the ability to protect autologous fibroblasts against infection with vesicular stomatitis virus (serotype Indiana).
Sensitization Assay.
For sensitization, the right ear of an animal was painted with 40 μl of PBS/1% 2,4-dinitrofluorobenzene (DNFB; Sigma) on 3 consecutive days (7). On day 4, the draining lymph nodes were removed and lymphocytes were plated in triplicate in a 96-well plate at 5 × 10⁵ cells per well with 0.5 μCi of [3H]thymidine (Amersham; 1 μCi = 37 kBq) for 18 h to measure proliferation.
ELISA and Enzyme-Linked Immunospot (ELISPOT) Assays.
ELISPOT assays and ELISAs were performed according to standard procedures. For the ELISA, 15 μg/ml KLH-DNP in 0.05 M Tris buffer (pH 9.6) was used overnight to coat a plate, which was blocked with PBS/10% FCS or BSA, and incubated with cotton rat serum for 1 h at room temperature. After washing, the plate was incubated overnight at 4°C with a horseradish peroxidase-coupled antiserum specific for rat IgM and IgG (cross-reactive with cotton rat immunoglobulins; Dianova) and subsequently was developed with dinitrophenyl phosphate in diethanolamine buffer.
To detect B cells, 25-well plates (Bibby Sterilin, Stone, Staffordshire, U.K.) were coated with an antiserum specific for rat immunoglobulins or KLH-DNP overnight. After blocking, 4-fold dilutions of spleen cells were plated, incubated for 20 h at 37°C, and subsequently removed by washing. Bound cotton rat antibody was detected by incubation with the aforementioned cross-reactive antiserum (4 h 4°C) and developed by a 5-bromo-4-chloro-3-indolyl phosphate solution buffered with 2-amino-2-methyl-1-propanol.
Results
Influence of MV Infection on Primary and Secondary Responses in a MLR.
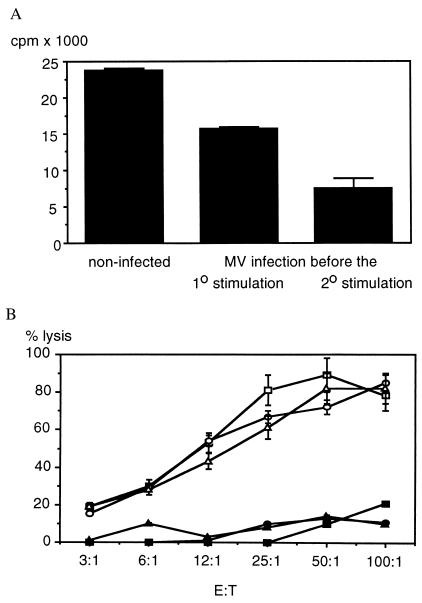
To test the influence of MV on the primary (1o) MLR, mouse spleen cells were inoculated on day 0 into cotton rats, and the secondary (2o) stimulation was done ex vivo on day 28 with mitomycin C-inactivated mouse spleen cells (MLR). Ex vivo, MV-induced inhibition of proliferation is most pronounced in cotton rats 4 days after infection (4). Therefore, animals were infected with MV on days −4 and 24 to inhibit the primary or secondary response, respectively. After 5 days of in vitro stimulation the number of living cells (determined by trypan blue exclusion) was counted in cultures from infected vs. noninfected animals and was found to be reduced by half in cultures of infected animals (see Fig. 1 legend). Similarly, MLR of cotton rat spleen cells was reduced on day 5 in cultures from infected compared with noninfected animals (Fig. 1A).
Figure 1.
Inhibition of MLR proliferation but not of cytotoxic activity against mouse fibroblasts by MV infection. For primary stimulation, cotton rats were injected i.p. with mouse spleen cells (C3H strain), and 4 weeks later their spleen cells were stimulated in vitro by cocultivation with mitomycin C-treated mouse spleen cells (MLR). The number of living cells was determined by trypan blue exclusion on day 5 of culture. From 3 × 10⁷ spleen cells per original culture in controls, 2.7 ± 0.8 × 10⁷ cells were recovered; in animals infected with MV before the primary stimulation, 1.4 ± 0.1 × 10⁷ cells were recovered; and from animals infected before the secondary stimulation, 1.3 ± 0.2 × 10⁷ cells were recovered (average of five animals per group ± SD). In addition, [3H]thymidine incorporation was measured in cpm ± SD (A, representative of four experiments) and the lytic activity of T cells in was measured in percentage of lysis ± SD (B). Cytotoxic T cells from noninfected animals (squares) and animals infected before the primary (circles) or secondary (triangles) stimulation were tested against mouse (L929 cells, open symbols) and cotton rat fibroblasts (solid symbols). YAC 1 cells that were lysed by cotton rat natural killer cells (data not shown) were never lysed above background. No consistent difference between cultures from infected and noninfected animals was detected in five separate experiments.
To test whether, in addition to proliferation, cytotoxic effector functions of T cells also were affected by MV infection, a chromium release assay was performed on day 5 after stimulation. At the same effector-to-target ratio, T cells from infected and noninfected animals lysed mouse fibroblasts (L929 cells) equally well (Fig. 1B). This indicates that proliferation, but not the effector function of cytotoxic T cells, is impaired.
Influence of MV Infection on the Cytotoxic T Cell Response Against Vaccinia Virus.
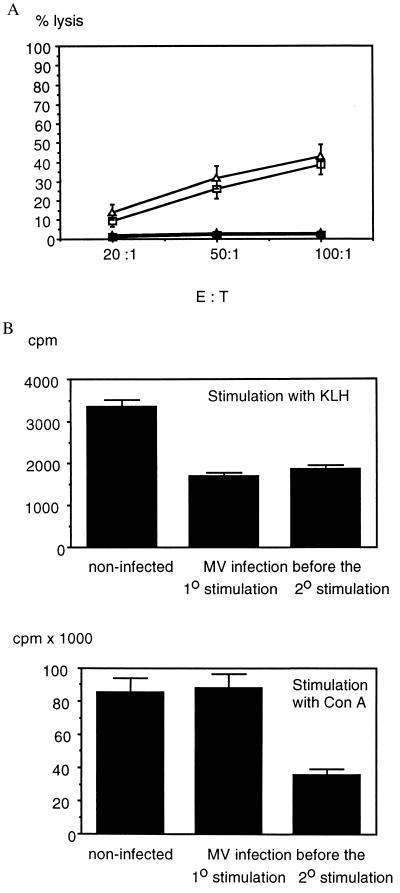
To investigate the influence of MV infection on the cytotoxic T cell response in a homologous system, the vaccinia virus (MVA)-specific cytotoxic T cell response was investigated in cotton rats immunized with vaccinia virus. As shown in Fig. 2A, the secondary ex vivo stimulation resulted in reduced T cell growth from spleen cells of MV-infected animals in comparison with noninfected animals. However, at the same target-to-effector ratio, T cells from MV-infected and noninfected animals lysed vaccinia virus-infected cotton rat macrophages equally well (Fig. 2A).
Figure 2.
Effect of MV infection on vaccinia virus-specific cytotoxic T cells and proliferation and cytokine secretion of KLH-specific T cells. (A) For primary stimulation, cotton rats were injected with 2 × 10⁶ pfu of vaccinia virus (MVA strain), and 3 weeks later their spleen cells were stimulated in vitro by cocultivation with mitomycin C-treated, MVA-infected mouse spleen cells. On day 5 after in vitro stimulation, per 1.5 × 10⁷ cells, 7.5 ± 0.3 × 10⁶ cells were recovered from the original culture from noninfected animals and 3.6 ± 0.2 × 10⁶ cells were recovered from animals infected with MV before the secondary stimulation (average of two and three animals per group ± SD). Pooled T cells from two noninfected (squares) and three MV-infected animals (triangles) were used at the same effector-to-target ratio on vaccinia virus-infected (open symbols) and noninfected (solid symbols) cotton rat macrophages (percent lysis ± SD). (B) For primary stimulation, cotton rats were injected with KLH, and 4 weeks later their spleen cells were stimulated in vitro with KLH (Upper) to test the antigen-specific T cell response (cpm ± SD). In addition, Con A-stimulated antigen-unspecific proliferation (Lower, in cpm ± SD) was tested as an indicator of immune suppression at the time of assay. Groups of noninfected animals or animals infected with MV before the primary or the secondary stimulation were tested. Data are the average of two animals per group and were similar in four experiments. The difference in suppression of KLH- and Con A-stimulated proliferation of spleen cells from animals infected with MV before the primary stimulation indicates a suppression of memory T cells.
Influence of MV Infection on Primary and Secondary T Cell Responses Against Protein Antigens.
To test the influence of MV infection on the T helper cell function in more detail, MV-infected and noninfected cotton rats were immunized with protein antigens [equine Ig (eIg) and KLH]. The primary as well as secondary proliferative response to eIg (not shown) and KLH was reduced after MV infection (Fig. 2B). Animals that had been infected 4 days before the 2o stimulation still harbor MV in their lung tissue, and mitogen-driven as well as antigen-specific responses were reduced. In contrast, animals that had been infected before the 1o stimulation had overcome the infection at the time of analysis (4 weeks later), and mitogen-driven responses were not reduced (Fig. 2B). Still, the antigen-specific response was impaired. This indicates that MV-induced immune suppression acts temporarily and that an impaired generation of T cells results in a reduced memory response. To test whether MV also impaired the effector function of T helper cells, we tested the secretion of cytokines (Table 1). KLH-specific T cells did not secrete TNF. In contrast, KLH-specific T cells from infected as well as noninfected animals secreted IL-2. Although the amount of IL-2 secretion was higher in noninfected animals, the difference statistically was not significant. T cells from all groups of animals secreted low amounts of IFN-γ. These data indicate that the proliferation inhibition of T helper cells does not interfere with cytokine secretion.
Table 1.
Effect of MV infection on cytokine secretion of KLH-specific T cells
| Cytokine | Control | MV infection before 1° stimulation (day 0) and analysis on day 28 | MV infection before 2° stimulation on day 28 |
|---|---|---|---|
| IL-2 | 3,681 ± 4,794 cpm | 2,054 ± 1,661 cpm | 2,635 ± 2,507 cpm |
| IFN-γ | + | + | + |
| TNF | − | − | − |
For primary (1°) stimulation, cotton rats were injected with KLH, and 4 weeks later their spleen cells were stimulated in vitro with KLH (see also Fig. 2B). After 24 h, supernatants were harvested to assay for the presence of IL-2 and TNF, and after 48 h, supernatant was harvested to assay for the presence of IFN-γ. With biological assay systems, the amount of cytokine produced by KLH-stimulated spleen cells from noninfected animals, and animals infected with MV before the primary or before the secondary (2°) stimulation were compared (7–11 animals per group). The proliferation (cpm ± SD) of the IL-2-dependent CTLL clone 3 cells was used as an assay system for IL-2. IFN-γ was tested as protection of primary cotton rat fibroblasts against infection with vesicular stomatis virus (serotype Indiana). +, Protection at a 2- to 4-fold dilution of T cell supernatants. TNF was assayed as killing of mouse fibroblast cell line L929. Although no killing was observed here, cotton rat T cells with different antigenic specificities secrete TNF measurable in this assay (data not shown).
Inhibition of T Cell Responses in Vivo in a Skin-Sensitization Assay.
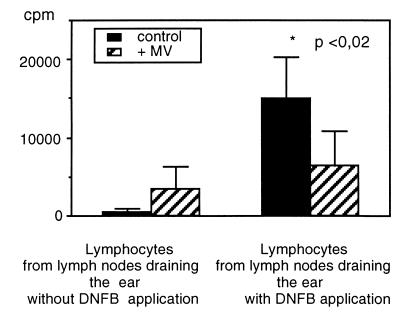
Ex vivo, T cell proliferation was severely reduced by MV infection. To test whether the same was true for the in vivo situation, we used the local lymph node assay (7) after sensitization with DNFB. The ear of infected or mock-infected animals was painted with DNFB on three consecutive days to induce DNFB-specific T cells. On day 4, lymphocytes from the draining lymph nodes [Lnn. mandibulares et parotidei (8)] from both ears were counted and their activation and proliferative capacity was measured by [3H]thymidine incorporation overnight. Although the number of lymphocytes in the draining lymph nodes from the right ear of infected animals was similar to that in mock-infected animals, the proliferation was reduced severely (Fig. 3). This result demonstrates that MV-induced immune suppression observed in ex vivo experiments is relevant for T cell responses in vivo, too.
Figure 3.
Inhibition of DNFB specific T cell proliferation by MV infection. To induce the generation of DNFB-specific T cells, one ear of cotton rats was painted with 40 μl of a 1% DNFB solution on 3 consecutive days. Mock-infected and cotton rats infected 3 days before sensitization were used. On day 4, the draining lymph nodes from both ears were sampled and single cell suspensions were produced. Triplicates of 5 × 10⁵ lymphocytes per well in a 96-well plate were labeled with 0.5 μCi of [3H]thymidine per well and harvested 20 h later to measure proliferation. The data are given as an average of four animals per group.
No Influence of MV Infection on T Cell—B Cell Collaboration and B Cell Responses.
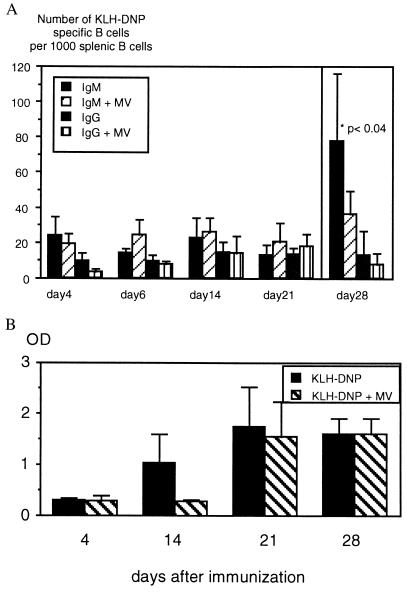
The T cell antigen KLH coupled to DNP groups has been used to investigate T and B cell collaboration as KLH-specific T cells provide B cell help. To test whether the reduced T helper response to KLH leads to a reduced B cell response, animals were infected with MV and, 4 days later, given KLH-DNP (100 μg) i.p. The number of B cells secreting IgM and IgG specific for KLH-DNP was estimated by using an ELISPOT assay from day 4 to day 21. As shown in Fig. 4A, there is no difference in the number of KLH-DNP-specific B cells from infected vs. noninfected animals. After inoculation of a higher dose of KLH-DNP (1,000 μg), the difference in IgM- but not IgG-secreting cells reached marginal statistical significance (P < 0.04, day 28). Simultaneous to the ELISPOT assays, titers of IgG antibodies specific for KLH-DNP in the serum were measured by ELISA. Titers of IgG rose from day 4 to day 28 in infected and noninfected animals. The only significant difference between titers from infected and noninfected animals was seen on day 14 (Fig. 4B). Production of antibodies was lower in sera from infected animals on day 14, but levels similar to noninfected animals were reached on day 21. It therefore seems that the production of antibody was delayed although the numbers of plasma cells did not differ significantly. The secondary B cell response was never affected by MV infection (data not shown).
Figure 4.
Slight influence of MV infection on the KLH-DNP-specific B cell response. (A) Spleen cells from animals (infected 4 days previously or noninfected) immunized with 100 μg of KLH-DNP were analyzed for the numbers of B cells secreting IgM and IgG specific for KLH-DNP from days 4, 14, and 21 (four animals per group) by ELISPOT. The number of B cells per spleen was estimated with a cross-reactive serum (rabbit anti-rat immunoglobulins) and the number of cells secreting KLH-DNP-specific antibodies were expressed per 1,000 B cells in the spleen. There was no difference in the number of B cells secreting IgM and IgG specific for KLH-DNP between infected and control animals. Animals immunized with 1 mg of KLH-DNP were tested on day 28 (nine animals per group). The high dose of antigen led to an increase in IgM- but not IgG-secreting B cells, and the difference between infected and noninfected animals was weakly significant (P > 0.04). (B) Sera taken from the same animals on days 4, 14, 21, and 28 were tested at a 1:200 dilution in an ELISA assay for KLH-DNP-specific IgG and expressed as OD ± SD. The only difference between infected and noninfected animals was seen on day 14 (P < 0.006).
Ex Vivo B Cell Proliferation Is Impaired by MV.
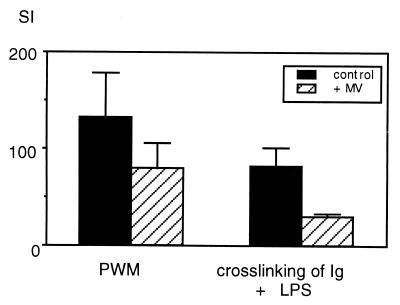
We have published previously that infection with MV leads to reduced ex vivo stimulation of spleen cells with lipopolysaccharides (LPS) (4). In vivo, however, we found nearly no effect of MV infection on the B cell response. LPS stimulates cotton rat cells poorly, whereas stimulation by crosslinking of membrane-bound immunoglobulins results in good B cell proliferation. However, independent of the mode of stimulation of B cell growth, the ex vivo response of B cells always was reduced from infected compared with noninfected animals (Fig. 5).
Figure 5.
Inhibition of mitogen-stimulated B cell proliferation ex vivo by MV infection. Spleen cells from infected animals 4 days after infection and noninfected animals were stimulated either with pokeweed mitogen (PWM) (stimulating T and B cell growth) or a cross-link by antiserum reacting with cotton rat immunoglobulins and 10 μg/ml S. typhosa lipopolysaccharide (LPS) (stimulating B cells only). After stimulation with PWM, proliferation ranged from 50,000 to 80,000 cpm, and after B cell-specific stimulation, proliferation ranged from 13,000 to 20,000 cpm. Proliferation with medium alone was 100–1,000 cpm. The stimulation index was calculated as cpm stimulation/cpm medium and expressed as an average of four animals per group.
Discussion
Immune suppression resulting from MV infection and the subsequent susceptibility to secondary infections is a well established clinical phenomenon (for review, see ref. 1). To explain the underlying mechanism, tissue culture experiments have been performed investigating the inhibition of proliferation of either infected peripheral blood lymphocytes (PBL) (9–11) or PBL after contact with MV-infected cells or inactivated MV (12, 13). In these systems, the inhibitory effect on proliferation of both B and T cells correlates well with a cell cycle arrest in the G0/G1 phase. Also ex vivo, PBL from MV-infected monkeys and humans show inhibited T and B cell responses after mitogen stimulation (1, 14). In addition, MV infection reduces the spontaneous secretion of immunoglobulins by human B cells in a severe combined immunodeficiency–hu model (15).
Because cotton rats are fully immunocompetent and MV replicates in their respiratory tract, we used this animal model to investigate the immunosuppressive effect of MV on B and T cells in vivo. In cotton rats, T cell responses are impaired in vivo and ex vivo whereas B cell proliferation was reduced only ex vivo. The difference in suppression of the B and T cell response measured in vivo and ex vivo might be due to a difference in activation of these cells. Ex vivo, both cell populations were driven to proliferate for 3 days by mitogen. In vivo, the generation of antigen-specific T cell responses also occurs within a few days in a so-called “clonal burst” (16), and immune suppression will result in a reduced expansion and subsequently lower numbers of memory T cells. In contrast, B cells grow in vivo more slowly over weeks and, therefore, might be less susceptible. For activation, B cells need antigen in conjunction with T cell help. Because suppression of T cell responses is not complete and cytokine secretion is not impaired during MV infection, it seems likely that B cells are provided with all signals necessary to develop into antigen-specific cells. In contrast, T cells might be affected not only by the above-mentioned cell cycle arrest, but also by a defect in antigen presentation. It has been shown that (at least in tissue culture) B cells (17), macrophages (18, 19), and dendritic cells (20, 21) either infected with MV or after contact with the virus demonstrate abnormal cytokine secretion and/or antigen-processing capacities.
The observation that in vivo the primary and secondary T cell responses are strongly inhibited whereas B cell responses remain relatively unaffected correlates well with clinical data. The reactivation of tuberculosis, herpes, and adenovirus infections as well as the temporary disappearance of the tuberculin reaction can be explained by suppression of the T cell response (1). Our data indicate that suppression of the T cell response by MV infection is a quantitative rather than a qualitative effect. This correlates with evidence that the number of T cells seems to be an important factor in overcoming infections. In an experimental model it has been shown that the reduction of the cytotoxic T cell response by 50% against murine cytomegalovirus renders resistant mice susceptible (22), and in HIV infection, T cell loss results in AIDS and susceptibility toward opportunistic infections.
Abbreviations
- MV
measles virus
- pfu
plaque-forming units
- MLR
mixed leukocyte reaction
- KLH-DNP
2,4-dinitrophenyl-conjugated keyhole limpet hemocyanin
- TNF
tumor necrosis factor
- ELISPOT
enzyme-linked immunospot
- DNFB
2,4-dinitrofluorobenzene
Footnotes
Article published online before print: Proc. Natl. Acad. Sci. USA, 10.1073/pnas.060012097.
Article and publication date are at www.pnas.org/cgi/doi/10.1073/pnas.060012097
References
- 1.Griffin D E. In: Measles Virus. Billeter M, ter Meulen V, editors. Berlin: Springer; 1995. pp. 117–134. [Google Scholar]
- 2.Borrow P, Oldstone M B A. In: Measles Virus. Billeter M, ter Meulen V, editors. Berlin: Springer; 1995. pp. 85–100. [Google Scholar]
- 3.Wyde P R, Ambrosi M W, Voss T G, Meyer H L, Gilbert B F. Proc Soc Exp Biol Med. 1992;201:80–87. doi: 10.3181/00379727-201-43483. [DOI] [PubMed] [Google Scholar]
- 4.Niewiesk S, Eisenhuth I, Fooks A, Clegg J C S, Schnorr J-J, Schneider-Schaulies S, ter Meulen V. J Virol. 1997;71:7214–7219. doi: 10.1128/jvi.71.10.7214-7219.1997. [DOI] [PMC free article] [PubMed] [Google Scholar]
- 5.Sutter G, Moss B. Proc Natl Acad Sci USA. 1992;22:10847–10851. doi: 10.1073/pnas.89.22.10847. [DOI] [PMC free article] [PubMed] [Google Scholar]
- 6.Lewis J A. In: Cytokines. Balkwill F R, editor. Oxford: Oxford Univ. Press; 1991. pp. 109–120. [Google Scholar]
- 7.Kimber I, Dearman R J, Scholes E W, Basketter D A. Toxicology. 1994;93:13–31. doi: 10.1016/0300-483x(94)90193-7. [DOI] [PubMed] [Google Scholar]
- 8.Wenk P. Z Versuchstierk. 1964;4:80–97. [Google Scholar]
- 9.McChesney M B, Kehrl J H, Valsamakis A, Fauci A S, Oldstone M B A. J Virol. 1987;61:3441–3447. doi: 10.1128/jvi.61.11.3441-3447.1987. [DOI] [PMC free article] [PubMed] [Google Scholar]
- 10.McChesney M B, Altmann A, Oldstone M B A. J Virol. 1988;140:1269–1273. [PubMed] [Google Scholar]
- 11.Yanagi Y, Cubitt B, Oldstone M B A. Virology. 1992;187:280–289. doi: 10.1016/0042-6822(92)90316-h. [DOI] [PubMed] [Google Scholar]
- 12.Schlender J, Schnorr J J, Cattomen T, Cattaneo R, Billeter M A, ter Meulen V, Schneider-Schaulies S. Proc Natl Acad Sci USA. 1996;93:13194–13199. doi: 10.1073/pnas.93.23.13194. [DOI] [PMC free article] [PubMed] [Google Scholar]
- 13.Schnorr J-J, Seufert M, Schlender J, Borst J, Johnson I C D, ter Meulen V, Schneider-Schaulies S. J Gen Virol. 1997;78:3217–3226. doi: 10.1099/0022-1317-78-12-3217. [DOI] [PubMed] [Google Scholar]
- 14.van Binnendijk R S, van der Hejden R W J, Osterhaus A D M E. In: Measles Virus. Billeter M A, ter Meulen V, editors. Berlin: Springer; 1995. pp. 135–148. [Google Scholar]
- 15.Tishon A, Manchester M, Scheiflinger F, Oldstone M B A. Nat Med. 1996;2:1250–1254. doi: 10.1038/nm1196-1250. [DOI] [PubMed] [Google Scholar]
- 16.Hou S, Hyland L, Ryan K W, Portner A, Doherty P C. Nature (London) 1996;369:652–654. doi: 10.1038/369652a0. [DOI] [PubMed] [Google Scholar]
- 17.Fujinami R S, Sun X, Howell J M, Jenkin J C, Burns J B. J Virol. 1998;72:9421–9427. doi: 10.1128/jvi.72.12.9421-9427.1998. [DOI] [PMC free article] [PubMed] [Google Scholar]
- 18.Leopardi R, Ilonen J, Mattila L, Salmi A. Cell Immunol. 1993;147:388–396. doi: 10.1006/cimm.1993.1078. [DOI] [PubMed] [Google Scholar]
- 19.Karp C L, Wysocka M, Wahl L M, Ahearn J M, Cuomo P J, Sherry B, Trinchieri G, Griffin D E. Science. 1996;273:228–231. doi: 10.1126/science.273.5272.228. [DOI] [PubMed] [Google Scholar]
- 20.Schnorr J J, Xanthakos S, Keikavoussi P, Kampgen E, ter Meulen V, Schneider-Schaulies S. Proc Natl Acad Sci USA. 1997;94:5326–5331. doi: 10.1073/pnas.94.10.5326. [DOI] [PMC free article] [PubMed] [Google Scholar]
- 21.Fugier-Vivier I, Servet-Delphrat C, Rivallier P, Rissoan M C, Liu Y J, Rabourdin-Combe C. J Exp Med. 1997;186:813–823. doi: 10.1084/jem.186.6.813. [DOI] [PMC free article] [PubMed] [Google Scholar]
- 22.Del Val M, Schlicht H-J, Ruppert T, Reddehase M J, Koszinowski U H. Cell. 1991;66:1145–1153. doi: 10.1016/0092-8674(91)90037-y. [DOI] [PubMed] [Google Scholar]


