
FIGURE 1.
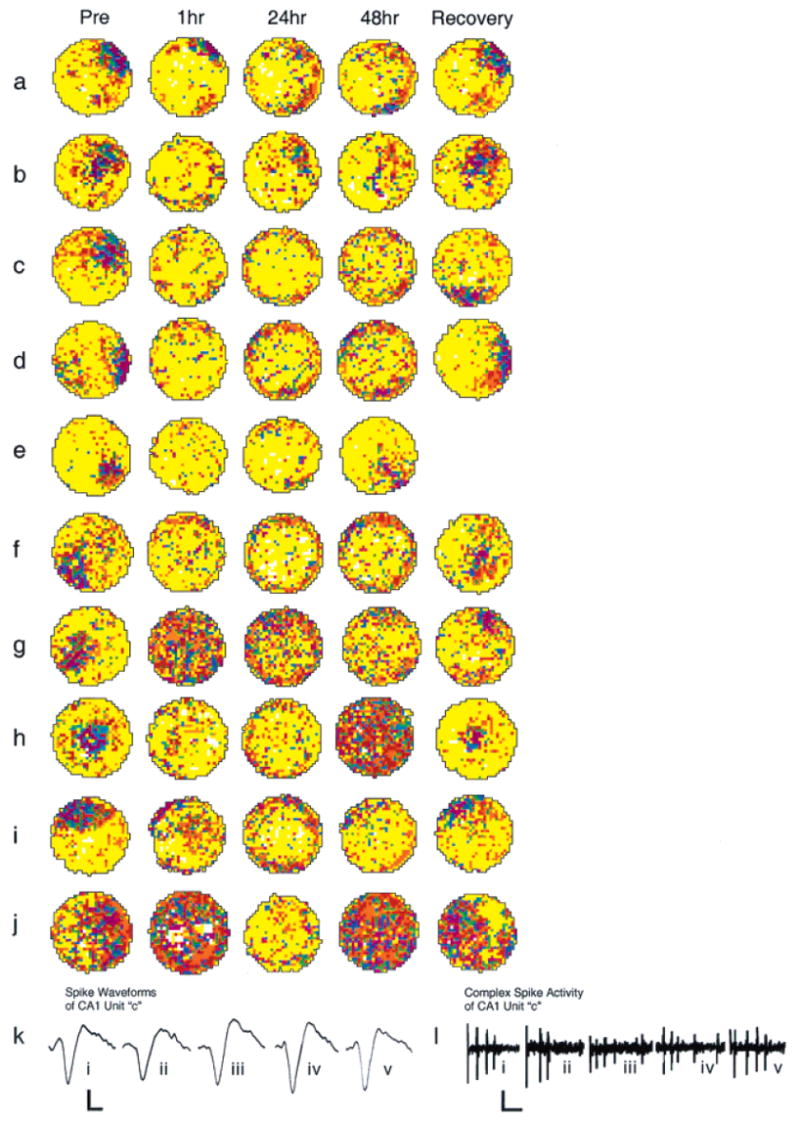
Vestibular inactivation disrupts location-specific firing in hippocampal place cells: examples of firing fields of all 10 cells recorded, before and after inactivation of the vestibular apparatus. a–j: For each map, increasing rates of discharge are coded from yellow, orange, red, green, blue, and purple, with yellow pixels depicting locations visited where no spikes were fired. Pixels that were never visited during the recording session are coded white. Each map was autoscaled such that the number of pixels in the next higher firing rate category was equal to 0.8 times the number of pixels in the lower firing rate category (Muller et al., 1987). For each example, Pre depicts activity recorded during the baseline session; postinjection activity is depicted in the remaining plots under the headings 1 hr, 24 hr, 48 hr, and Recovery. In each case, Recovery represents that activity acquired during the recording session at which vestibular function was judged as restored. Respective recovery time points for each cell were as follows: a, 60 h; b, 72 h; c, 60 h; d, 72 h; e, 48 h; f, 72 h; g, 60 h; h, 96 h; i, 72 h; and j, 72 h. k: Unit waveform traces acquired during recording the cell depicted in c, at each of the time points before and after vestibular inactivation (i–v: Pre; Post 1 hr; 24 hr; 48 hr; and Recovery). The calibration scale represents 50 μV/200 μs. l: Representative spike trace records depicting complex spike activity of the cell depicted in c, acquired at each of the time points before and after vestibular inactivation (i–v: Pre; Post 1 hr; 24 hr; 48 hr; and Recovery). Calibration scale represents 50 μV/10 ms.