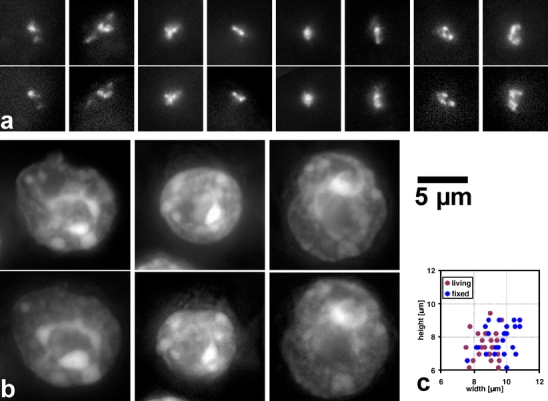
Fig. 5.

Comparison of nuclei from living cells and after fixation with BF 3.7. Living PALZ39E cells were recorded with a widefield microscope, fixed on the microscope stage, and recorded again. Projections of consecutive optical sections are shown. Scale bar is valid for all micrographs. a GFP signals from the transgene array in living cells (top row) and fixed cells (bottom row). Projections from fixed GFP signals were rotated to match those from living cells as closely as possible. The time interval between recording of the GFP signal in living cells and the start of fixation was between approximately 1 min for the two leftmost signals and 5 min for the rightmost signal. Some differences in the distribution of substructures can be observed, in particular for the rightmost signal. However, in general, the morphology is very well maintained. b Nuclei stained with Hoechst 33342 in living cells (top) and after fixation (bottom). While overall shape and chromatin distribution is well maintained, some intensely stained regions have changed their position relative to each other, although only approximately 5 min have passed between recording and start of fixation. This is most obvious in the leftmost nucleus. c Shape of nuclei. As in Fig. 2, each dot represents one nucleus, either before or after fixation. The same 26 nuclei were measured. A slight shift to larger values can be observed for fixed nuclei
