Abstract
Electron impact excitation rates in Cl III, recently determined with the R-matrix code, are used to calculate electron temperature (Te) and density (Ne) emission line ratios involving both the nebular (5517.7, 5537.9 Å) and auroral (8433.9, 8480.9, 8500.0 Å) transitions. A comparison of these results with observational data for a sample of planetary nebulae, obtained with the Hamilton Echelle Spectrograph on the 3-m Shane Telescope, reveals that the R1 = I(5518 Å)/I(5538 Å) intensity ratio provides estimates of Ne in excellent agreement with the values derived from other line ratios in the echelle spectra. This agreement indicates that R1 is a reliable density diagnostic for planetary nebulae, and it also provides observational support for the accuracy of the atomic data adopted in the line ratio calculations. However the [Cl iii] 8433.9 Å line is found to be frequently blended with a weak telluric emission feature, although in those instances when the [Cl iii] intensity may be reliably measured, it provides accurate determinations of Te when ratioed against the sum of the 5518 and 5538 Å line fluxes. Similarly, the 8500.0 Å line, previously believed to be free of contamination by the Earth's atmosphere, is also shown to be generally blended with a weak telluric emission feature. The [Cl iii] transition at 8480.9 Å is found to be blended with the He i 8480.7 Å line, except in planetary nebulae that show a relatively weak He i spectrum, where it also provides reliable estimates of Te when ratioed against the nebular lines. Finally, the diagnostic potential of the near-UV [Cl iii] lines at 3344 and 3354 Å is briefly discussed.
It was recognized in the 1940s that forbidden emission line ratios from nebular plasmas would provide a means for estimating electron densities (Ne) and temperatures (Te) in the emitting layers. A difficulty has been to obtain Ne and Te for the same ion, as different ions may be located in strata of differing parameters. For example, the intensity ratio of the auroral/nebular lines of [O iii] have long been used to derive Te for nebular plasmas, while the ratio of nebular lines of [O ii] (3729 Å/3726 Å) and [S ii] (6717 Å/6730 Å) have provided densities. Thus we obtain Te in the O2+ zone and Ne in the O+ or S+ zone. To get Ne in the O2+ zone from [O iii] lines we would need not only the usual optical region transitions, but also fine-structure infrared lines, which require observations from above the Earth's atmosphere.
The lines of [O ii], [Ne iv], [S ii], and [Ar iv] all arise from p3 configurations and fall in the optical or near-UV part of the spectrum. By comparing the auroral or transauroral type transitions with those of nebular type (for example, the 4068 Å transauroral with the 6717, 6730 Å nebular transitions of [S ii]), we can derive both Te and Ne in the layers responsible for the emission. Accurate calculations for all relevant transitions have now been obtained for these ions (1–4).
Another ion of this group is Cl2+, for which Ramsbottom et al. (5) have very recently calculated electron impact excitation rates by using the R-matrix method as adapted for the Opacity Project (6, 7). In this paper, we use the Ramsbottom et al. (5) results to derive emission line ratios applicable to planetary nebulae, and we compare these with high spectral resolution optical observations. Specifically, we assess the usefulness of [Cl iii] line ratios as temperature and density diagnostics for planetary nebulae.
Atomic Data and Theoretical Line Ratios
The model ion for Cl iii consisted of the three LS states within the 3s23p3 ground configuration, namely 4S, 2D, and 2P, making a total of five levels when the fine-structure splitting is included. Energies of all these levels were taken from Kelly (8). Test calculations including the higher-lying 3s3p4 terms were found to have a negligible effect on the 3s23p3 level populations at the electron temperatures and densities typical of planetary nebulae, and hence these states were not included in the analysis.
Electron impact excitation rates for transitions in Cl iii were obtained from Ramsbottom et al. (5), whereas for Einstein A-coefficients the calculations of Mendoza and Zeippen (9) were adopted. Our previous work on the isoelectronic ions S ii (3) and Ar iv (4) has shown that excitation by protons is unimportant under nebular conditions, and hence this process has not been included in the present analysis.
Using the atomic data discussed above in conjunction with the statistical equilibrium code of Dufton (10), we derived relative Cl iii level populations and hence emission line strengths for a range of electron temperatures (Te = 5,000–20,000 K) and densities (Ne = 101.5 to 105.5 cm−3). Details of the procedures involved and approximations made may be found in Dufton (10) and Dufton et al. (11). Given errors of typically ±10% in both the adopted electron excitation rates and A-values, we estimate that our derived theoretical line ratios should be accurate to ±15%.
The [Cl iii] nebular emission line ratio
 |
 |
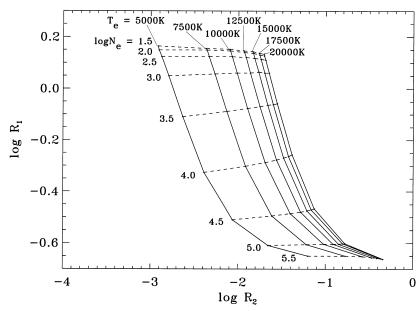
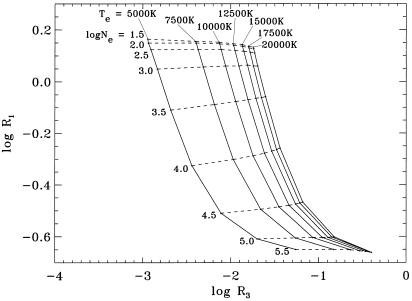
is a well known density diagnostic for planetary nebulae (12). However, Czyzak et al. (13) have pointed out that ratios in P-like ions involving both the nebular lines and the auroral 3s23p3 2D–3s23p3 2P transitions should allow both Te and Ne to be derived, and illustrated this by plotting theoretical results for [S ii]. In Figs. 1 and 2 we therefore plot R1 against the auroral/nebular line ratios
 |
 |
and
 |
 |
respectively, for a grid of (Te, log Ne) values. Clearly, measurements of R1 and R2, or R1 and R3, should in principle allow the simultaneous determination of Te and Ne for the [Cl iii] emitting region of the nebula. We note that the theoretical ratios
 |
 |
and
 |
 |
have the same temperature and density dependence as R2 and R3, respectively, because of common upper levels, but with
 |
and
 |
Figure 1.
Plot of the theoretical [Cl iii] nebular emission line ratio R1 = I(3s23p3 4S–3s23p3 2D5/2)/I(3s23p3 4S–3s23p3 2D3/2) = I(5518 Å)/I(5538 Å) against the auroral/nebular ratio R2 = I(3s23p3 2D3/2–3s23p3 2P3/2)/I(3s23p3 4S–3s23p3 2D3/2,5/2) = I(8434 Å)/I(5518 + 5538 Å), where I is in energy units, for a range of electron temperatures (Te = 5,000–20,000 K in steps of 2,500 K) and logarithmic electron densities (log Ne = 1.5–5.5 in steps of 0.5 dex; Ne in cm−3). Points of constant Te are connected by solid lines, whereas those of constant Ne are joined by dashed lines.
Figure 2.
Same as Fig. 1, except for R1 against R3 = I(3s23p3 2D3/2–3s23p3 2P1/2)/I(3s23p3 4S–3s23p3 2D3/2,5/2) = I(8500 Å)/I(5518 + 5538 Å).
Observational Data
Observational data were obtained with the Hamilton Echelle Spectrograph (HES) at the coudé focus of the 3-m Shane Telescope at the Lick Observatory during several observing runs between 1987 and 1994. The echelle grating, which is ruled with 316 grooves per cm to achieve the best possible match with an 800 × 800 TI charge-coupled device detector, permits coverage of the wavelength range 3,600–10,300 Å. Each order contains only a small portion of spectrum, and these are separated with the aid of a pair of low-dispersion prisms, which serve as cross dispersers. The data we have used here were secured in the context of a spectral survey of several planetaries of high surface brightness. For nebular observations, a slit width of 640 μm (1.16 arcsec) and a slit length of 4 arcsec were adopted, giving a spectral resolution of ∼0.2 Å (full width at half maximum). These choices were imposed by constraints on spectral purity (for slit width) and overlapping orders, especially in the red (for slit length). The total area accepted by the slit is generally much smaller than the whole nebular image. In addition to the usual exposures on laboratory arcs and appropriate comparison stars, one also needs a diffuse continuous source to allow for pixel-to-pixel sensitivity variations. Our basic observing and reduction procedures are described in Keyes et al. (14) and Hyung (15).
In Table 1 we list the planetary nebulae considered in the present analysis, their date of observation, and the measured intensities (I) of the [Cl iii] 5518, 5538, 8434, 8481, and 8500 Å lines [on the scale I(Hβ) = 100]. The 3s23p3 D5/2–3s23p3 2P1/2 line, predicted to lie at a wavelength of 8548.0 Å (16), is too weak to be detected in our data. However we note that Péquignot and Baluteau (17) have very marginally identified the line in the wing of the strong H i 8545.4 Å feature, in the spectrum of NGC 7027.
Table 1.
Summary of [Cl iii] observations
| Object | Observation date | I(5518 Å) | I(5538 Å) | I(8434 Å) | I(8481 Å) | I(8500 Å) | C* |
|---|---|---|---|---|---|---|---|
| NGC 2440 | Nov. 18, 1989 | 5.40−1 | 6.21−1 | — | — | 9.00−2 | 0.53 |
| NGC 6537 | June 15, 1992 | 3.85−1 | 9.16−1 | 1.91−2 | — | — | 1.80 |
| NGC 6572 | Aug. 5, 1990 | 1.58−1 | 3.75−1 | 1.50−2 | 1.70−2 | 2.10−2 | 0.40 |
| NGC 6572 | Sept. 1, 1991 | 1.70−1 | 3.97−1 | 2.10−2 | 2.40−2 | 3.10−2 | 0.40 |
| NGC 6741 | Sept. 30, 1991 | 6.32−1 | 1.02+0 | 3.80−2 | 6.40−2 | — | 1.10 |
| NGC 6884 | Aug. 30, 1994 | 2.73−1 | 4.99−1 | 4.50−2 | — | — | 1.10 |
| NGC 7009 | July 27, 1988 | 2.97−1 | 4.08−1 | 2.90−2 | 2.50−2 | — | 0.08 |
| NGC 7027 | Sept. 4, 1987 | 1.67−1 | 6.37−1 | 8.60−2 | 7.10−2 | 8.60−2 | 1.37 |
| NGC 7662 | Aug. 28, 1988 | 2.70−1 | 3.35−1 | — | 5.70−2 | — | 0.10 |
| IC 2165 | Nov. 17, 1989 | 3.30−1 | 3.70−1 | — | 3.00−2 | 4.00−2 | 0.68 |
| IC 4997 | Aug. 3, 1990 | 4.60−2 | 1.20−1 | 1.50−2 | 2.00−2 | 1.70−2 | 0.80 |
| IC 4997 | Aug. 30, 1991 | 6.10−2 | 1.31−1 | 1.30−2 | 3.30−2 | 2.80−2 | 0.80 |
| Hubble 12 | Aug. 6, 1990 | 5.00−2 | 1.35−1 | 6.00−2 | 6.20−2 | 6.40−2 | 1.35 |
Line intensities I (in energy units), corrected for interstellar extinction, are given relative to I(Hβ) = 100. A ± B implies A × 10±B.
Interstellar extinction coefficient C = 1.47E(B − V) = log[Ii(Hβ)/Io(Hβ)], where Ii(Hβ) and Io(Hβ) are the intrinsic and observed Hβ line intensities, respectively.
The [Cl iii] line intensities in Table 1 have been corrected for interstellar extinction, using the extinction curve of Seaton (18) in conjunction with the interstellar extinction coefficient C = 1.47E(B − V) = log[Ii(Hβ)/Io(Hβ)], where Ii(Hβ) and Io(Hβ) are the intrinsic and observed Hβ line intensities, respectively. Values of C, listed in Table 1, have been taken from the references given as footnotes to Table 3, or derived from a comparison of observed hydrogen recombination line flux ratios with calculations (19).
Table 3.
Derived [Cl iii] electron temperatures and densities
| Object | (Te, log
Ne)
|
(Te, log Ne)other | Ref.* | ||
|---|---|---|---|---|---|
| (R1, R2) | (R1, R3) | (R1, R4) | |||
| NGC 2440 | — | I, 3.4 | — | 11,750, 3.7 | 22 |
| NGC 6537 | 7,500, 4.2 | — | — | 9,200, 4.3 | 24 |
| NGC 6572† | 10,000, 4.2 | 14,000, 4.3 | 11,000, 4.2 | 11,000, 4.2 | 25 |
| NGC 6572‡ | 12,500, 4.2 | I, 4.2 | 14,000, 4.2 | 11,000, 4.2 | 25 |
| NGC 6741 | 12,000, 3.8 | — | I, 3.8 | 11,750, 3.7 | 26 |
| NGC 6884 | I 3.9 | — | — | 11,750, 4.1 | 21 |
| NGC 7009 | I, 3.6 | — | I, 3.6 | 11,500, 3.6 | 27 |
| NGC 7027 | 12,500, 4.9 | 13,500, 4.9 | 11,000, 4.9 | 14,000, 4.8 | 14 |
| NGC 7662 | — | — | I, 3.5 | 12,000, 3.7 | 28 |
| IC 2165 | — | I, 3.4 | I, 3.4 | 9,750, 3.6 | 15 |
| IC 4997† | I, 4.3 | I, 4.3 | I, 4.3 | 10,000, 4.2 | 29 |
| IC 4997‡ | I, 4.1 | I, 4.1 | I, 4.1 | 10,000, 4.2 | 29 |
| Hubble 12 | I, 4.3 | I, 4.3 | I, 4.3 | 12,500, 4.4 | 30 |
Te values are in K, Ne values are in cm−3. I indicates that Te was indeterminate due to the observed R2, R3, or R4 line ratio lying outside the range of values given in Fig. 1 or 2. In these instances, log Ne was deduced from R1 by adopting Te = 10,000 K.
*References for sources of (Te, log Ne)other.
†Observations taken in 1990.
‡Observations taken in 1991.
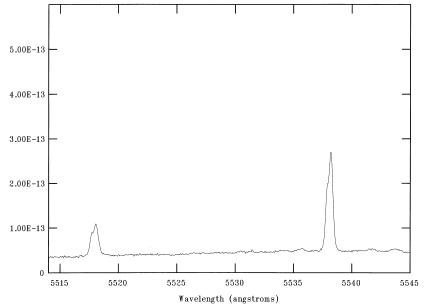
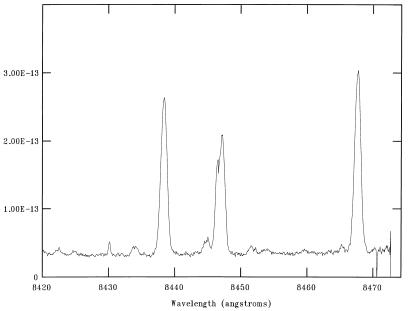
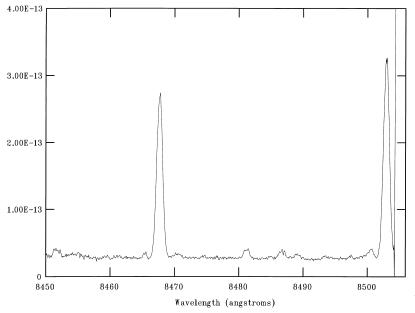
The resultant values of R1, R2, R3, and R4 are given in Table 2. We estimate that the uncertainties in the line intensities should be approximately ±10% for I ≥ 1.0, ±15% for 0.5 ≤ I < 1.0, and ±20% for I < 0.5. Hence the line ratios should be accurate to typically ±20–25%. To illustrate the quality of the observational data, in Figs. 3, 4, and 5 we plot the HES spectrum of NGC 6572 in the 5514–5545 Å, 8420–8475 Å, and 8450–8505 Å wavelength regions, respectively.
Table 2.
[CI III] emission line ratios
| Object | R1I(5518 Å)I(5538 Å) | R2 I(8434 Å) I(5518 + 5538 Å) | R3 I(8500 Å) I(5518 + 5538 Å) | R4 I(8481 Å) I(5518 + 5538 Å) |
|---|---|---|---|---|
| NGC 2440 | 8.70−1 | — | 7.75−2 | — |
| NGC 6537 | 4.20−1 | 1.47−2 | — | — |
| NGC 6572* | 4.21−1 | 2.81−2 | 3.94−2 | 3.19−2 |
| NGC 6572† | 4.28−1 | 3.70−2 | 5.47−2 | 4.23−2 |
| NGC 6741 | 6.20−1 | 2.30−2 | — | 3.87−2 |
| NGC 6884 | 5.47−1 | 5.83−2 | — | — |
| NGC 7009 | 7.28−1 | 4.11−2 | — | 3.55−2 |
| NGC 7027 | 2.62−1 | 1.07−1 | 1.07−1 | 8.83−2 |
| NGC 7662 | 8.06−1 | — | — | 9.42−2 |
| IC 2165 | 8.92−1 | — | 5.71−2 | 4.29−2 |
| IC 4997* | 3.83−1 | 9.04−2 | 1.02−1 | 1.20−1 |
| IC 4997† | 4.66−1 | 6.77−2 | 1.46−1 | 1.72−1 |
| Hubble 12 | 3.70−1 | 3.24−1 | 3.46−1 | 3.35−1 |
A−B implies A × 10−B.
*Observations taken in 1990.
†Observations taken in 1991.
Figure 3.
Plot of the Hamilton echelle spectrum of the planetary nebula NGC 6572, obtained on Sept. 1, 1991, in the wavelength interval 5514–5545 Å, showing the [Cl iii] 5517.7 and 5537.9 Å lines, where the flux is in units of erg⋅cm−2⋅sec−1⋅Å−1. We note that the structure in the [Cl iii] emission lines is due to shell expansion within the nebula. Radial velocity and interstellar extinction corrections (C = 0.4) have not been applied to this spectral scan.
Figure 4.
Plot of the Hamilton echelle spectrum of the planetary nebula NGC 6572, obtained on Sept. 1, 1991, in the wavelength interval 8420–8475 Å, showing the [Cl iii] 8433.9 Å line, where the flux is in units of erg⋅cm−2⋅sec−1⋅Å−1. Also shown are emission lines due to H i at 8438.0 Å, Si i at 8444.5 Å, O i at 8446.5 Å, S i at 8451.6 Å, and H i at 8467.3 Å. We note that the structure in the emission lines is due to shell expansion within the nebula. Radial velocity and interstellar extinction corrections (C = 0.4) have not been applied to this spectral scan.
Figure 5.
Plot of the Hamilton echelle spectrum of the planetary nebula NGC 6572, obtained on Sept. 1, 1991, in the wavelength interval 8450–8505 Å, showing the [Cl iii] 8480.9 and 8500.0 Å lines, where the flux is in units of erg⋅cm−2⋅sec−1⋅Å−1. Also shown are the 8467.3 and 8502.5 Å emission lines of H i. We note that the structure in the emission lines is due to shell expansion within the nebula. Radial velocity and interstellar extinction corrections (C = 0.4) have not been applied to this spectral scan.
Results and Discussion
In Table 3 we summarize the electron temperatures and logarithmic electron densities derived from the observed (R1, R2), (R1, R3), and (R1, R4) line pairs in conjunction with Figs. 1 and 2. As is clear from these figures, R1 is sensitive primarily to changes in Ne, whereas the other ratios depend strongly on both temperature and density. Hence in those instances where the observed R2, R3, or R4 ratios lie outside the range of values given in Figs. 1 and 2 (so that the simultaneous determination of Te and log Ne is not possible), we have still been able to measure log Ne from R1, by adopting Te = 10,000 K. We note that varying the adopted temperature from 5,000 K to 20,000 K (i.e., the full range in Fig. 1 or 2) will change the value of log Ne derived from R1 only by at most ±0.1 dex.
Also listed in Table 3 are the plasma parameters, denoted (Te, log Ne)other, determined from other line ratios in the planetary nebulae that have similar ionization potentials and hence similar spatial distributions to [Cl iii], such as I(3729 Å)/I(3726 Å) and I(7320 Å)/I(3726 + 3729 Å) in [O ii]. These Te and Ne estimates have been deduced from diagnostic diagrams constructed with the same HES data as those used for the [Cl iii] observations. Hence the values of (Te, log Ne)other should apply to the region of the planetary nebula for which the [Cl iii] observations were obtained, so that the [Cl iii] results should be directly comparable to these. Plasma parameters from the literature, on the other hand, often refer to the whole nebular image. The sources of the diagnostic diagrams used to derive (Te, log Ne)other are listed in the last column of Table 3.
For all of the planetary nebulae in Table 3, the derived electron densities are in very good agreement with those deduced from other line ratios in the HES observations, with discrepancies that average only 0.1 dex. This agreement indicates that R1 is a reliable density diagnostic for planetary nebulae, and also provides support for the accuracy of the atomic physics data adopted in the calculations of the ratio.
However, values of Te could be measured for only a number of objects in Table 3, with (as noted above) the temperature being indeterminate in several instances because the observed R2, R3, or R4 ratio lies outside the range of theoretical values given in Fig. 1 or 2. These discrepancies are most probably due to blending of the observational data. In the case of the 8433.9 Å line in the R2 ratio, we note that this transition is sometimes blended with a weak telluric emission feature (20). However, reliable estimates of the 8434 Å line intensity can be made if the effect of the telluric feature is minimized by, for example, observing at low air mass and away from twilight. From Table 3, we see that reliable measurements of R1 are available for a few planetary nebulae, which give temperatures in good agreement with those determined from other diagnostics, with discrepancies that average only 1,200 K.
The 8480.9 Å line in the R4 ratio is blended with the 8480.7 Å transition of He i (21). As a result, the [Cl iii] line can be reliably measured only when the He i spectrum is relatively weak, which is the case for NGC 6572 and NGC 7027. For these objects, the temperatures indicated by the R4 ratios are similar to those determined from other diagnostics.
Most of the observed values of R3, which contains the 8500.0 Å line, are much larger than those predicted from Fig. 2. For example, the plasma parameters (Te, log Ne)other = (12,500, 4.4) for Hubble 12 in Table 3 imply a theoretical R3 = 0.040 from Fig. 2, yet the observed ratio is R3 = 0.346. Blending would appear to be the obvious reason for this discrepancy, but the [Cl iii] 8500.0 Å line is always well resolved from the nearby H i 8502.5 Å feature in the HES spectra, as shown in Fig. 5. However, there is a very weak telluric emission line at 8500.0 Å (20), which is probably the source of the blend. Support for this explanation is provided by the fact that the R3 ratios in Table 3 for NGC 6572 and NGC 7027 give Te estimates in good agreement with those determined from other diagnostics, indicating that the [Cl iii] 8500 Å line intensity must be reliably measured in these objects. As noted previously, the 8434 Å line in NGC 6572 and NGC 7027 is uncontaminated by telluric blending, implying that the 8500 Å transition should be similarly unaffected, which is observed to be the case. The 8500 Å line was previously believed to be uncontaminated by the Earth's atmosphere (22). However measurements of this feature must be treated with caution in the future and, as with the 8434 Å transition, should be used as a diagnostic only if free from telluric blending. This will be the case for space-based observations from, for example, the Space Telescope Imaging Spectrograph, and the [Cl iii] lines in such data may therefore be used with confidence to determine plasma parameters.
Finally, we note that the [Cl iii] emission line ratios
 |
 |
and
R7 = I(3s23p3 4S–3s23p3 2P1/2)/I(3s23p3 4S–3s23p3 2D3/2,5/2) = I(3354.4 Å)/I(5517.7 + 5537.9 Å)
have the same temperature and density dependence as R2 and R3, respectively, because of common upper levels, but with
 |
and
 |
Hence the observed (R1, R6) or (R1, R7) line pairs could be used in conjunction with Figs. 1 and 2 to determine Te and log Ne, as noted by Czyzak et al. (13). Unfortunately, the 3344 and 3354 Å lines of [Cl iii] lie in a relatively unexplored region of the nebular spectrum, at least at high spectral resolution, because of the difficulty of observing in the near-UV. However, with the increasing blue sensitivity being achieved by charge-coupled devices, it is hoped that high-resolution spectra of these lines will be routinely available in the future. The near-UV features will not have the problem with telluric blends experienced by the longer-wavelength transitions, and hence should provide reliable temperature and density estimates. We stress, however, that they must be observed at high spectral resolution as, for example, the [Cl iii] 3344 Å line is blended with [Ne v] 3345 Å at low dispersion (23).
Acknowledgments
C.A.R. is grateful to the Particle Physics and Astronomy Research Council for financial support; F.L.C. holds a research studentship from the Department of Education for Northern Ireland. This research was supported by National Science Foundation Grants AST 90–14133, AST 93–13991, and AST 94–16985, and Space Telescope Science Institute Grant AR-06372.01–95A, to the University of California, Los Angeles. We also gratefully acknowledge the support provided by North Atlantic Treaty Organization travel grant CRG.930722, and Star 98–2-500–00 to the Korea Astronomy Observatory/BohyunSan Optical Astronomy Observatory sponsored by the Korean Ministry of Science and Technology.
Abbreviation
- HES
Hamilton Echelle Spectrograph
Footnotes
Article published online before print: Proc. Natl. Acad. Sci. USA, 10.1073/pnas.070590597.
Article and publication date are at www.pnas.org/cgi/doi/10.1073/pnas.070590597
References
- 1.Keenan F P, Aller L H, Bell K L, Crawford F L, Feibelman W A, Hyung S, McKenna F C, McLaughlin B M. Mon Not R Astron Soc. 1999;304:27–34. [Google Scholar]
- 2.Keenan F P, Aller L H, Bell K L, Espey B, Feibelman W A, Hyung S, McKenna F C, Ramsbottom C A. Mon Not R Astron Soc. 1998;295:683–690. [Google Scholar]
- 3.Keenan F P, Aller L H, Bell K L, Hyung S, McKenna F C, Ramsbottom C A. Mon Not R Astron Soc. 1996;281:1073–1080. [Google Scholar]
- 4.Keenan F P, McKenna F C, Bell K L, Ramsbottom C A, Wickstead A W, Aller L H, Hyung S. Astrophys J. 1997;487:457–462. [Google Scholar]
- 5.Ramsbottom C A, Bell K L, Keenan F P. Mon Not R Astron Soc. 1999;307:669–676. [Google Scholar]
- 6.Seaton M J. J Phys B. 1987;20:6363–6378. [Google Scholar]
- 7.Berrington K A, Burke P G, Butler K, Seaton M J, Storey P J, Taylor K T, Yu Y. J Phys B. 1987;20:6379–6397. [Google Scholar]
- 8.Kelly R L. J Phys Chem Ref Data. 1987;16:1371–1678. [Google Scholar]
- 9.Mendoza C, Zeippen C J. Mon Not R Astron Soc. 1982;198:127–139. [Google Scholar]
- 10.Dufton P L. Comput Phys Commun. 1977;13:25–38. [Google Scholar]
- 11.Dufton P L, Berrington K A, Burke P G, Kingston A E. Astron Astrophys. 1978;62:111–120. [Google Scholar]
- 12.Stanghellini L, Kaler J B. Astrophys J. 1989;343:811–827. [Google Scholar]
- 13.Czyzak S J, Keyes C D, Aller L H. Astrophys J Suppl. 1986;61:159–175. [Google Scholar]
- 14.Keyes C D, Aller L H, Feibelman W A. Publ Astron Soc Pacific. 1990;102:59–76. [Google Scholar]
- 15.Hyung S. Astrophys J Suppl. 1994;90:119–148. [Google Scholar]
- 16.Kaufman V, Sugar J. J Phys Chem Ref Data. 1986;15:321–426. [Google Scholar]
- 17.Péquignot D, Baluteau J-P. Astron Astrophys. 1988;206:298–315. [Google Scholar]
- 18.Seaton M J. Mon Not R Astron Soc. 1979;187:73P–76P. [Google Scholar]
- 19.Hummer D G, Storey P J. Mon Not R Astron Soc. 1987;224:801–820. [Google Scholar]
- 20.Osterbrock D E, Fulbright J P, Martel A R, Keane M J, Trager S C, Basri G. Publ Astron Soc Pacific. 1996;108:277–308. [Google Scholar]
- 21.Hyung S, Aller L H, Feibelman W A. Astrophys J Suppl. 1997;108:503–513. [Google Scholar]
- 22.Hyung S, Aller L H. Publ Astron Soc Pacific. 1998;110:466–479. [Google Scholar]
- 23.Aller L H, Czyzak S J. Astrophys J Suppl. 1983;51:211–248. [Google Scholar]
- 24.Aller L H, Hyung S, Feibelman W A. Proc Nat Acad Sci USA. 1999;96:5366–5371. doi: 10.1073/pnas.96.10.5366. [DOI] [PMC free article] [PubMed] [Google Scholar]
- 25.Hyung S, Aller L H, Feibelman W A. Mon Not R Astron Soc. 1994;269:975–997. [Google Scholar]
- 26.Hyung S, Aller L H. Mon Not R Astron Soc. 1997;292:71–85. [Google Scholar]
- 27.Hyung S, Aller L H. Mon Not R Astron Soc. 1995;273:973–991. [Google Scholar]
- 28.Hyung S, Aller L H. Astrophys J. 1997;491:242–253. [Google Scholar]
- 29.Hyung S, Aller L H, Feibelman W A. Astrophys J Suppl. 1994;93:465–483. [Google Scholar]
- 30.Hyung S, Aller L H. Mon Not R Astron Soc. 1996;278:551–564. [Google Scholar]


