Abstract
Whether electromagnetic precursors to earthquakes (EQs) exist is an important question not only for EQ prediction but also for understanding the physical processes of EQ generation. Slow transient geoelectric potential changes have been observed before several recent EQs in Japan. In most cases, they appeared 1–19 days before the EQs, and their duration and intensity were several minutes to 1 h and 1–2 mV/100 m. The changes appeared before five of all six EQs with magnitude ≥ 5 that occurred within 20 km of our stations during the observation period. Changes were also detected at greater epicentral distances (up to 75 km) before two other EQs, including one EQ of magnitude 4.7, which was preceded by a signal simultaneously recorded at three widely separated stations. These geoelectric potential changes have been distinguished through the following criteria from a multitude of other changes, which were noise of various origins. (i) The selected changes were proportional in amplitude to the length of the recording station's short (≈100 m) dipoles and were simultaneously detected also on long (1–10 km) dipoles when the latter were in operation. (ii) No such changes occurred during the observation period that were not followed by EQs. Although the EQ precursory nature of these geoelectric potential changes is admittedly unproven, it seems that the present results warrant continued serious research into the occurrence, generation, and transmission of these signals and their possible causal relationship to EQs.
Short-term earthquake (EQ) prediction is one of the most challenging targets in Earth science today. Despite substantial pessimism, research on electromagnetic phenomena is increasing (see, for example, ref. 1). Since 1987, we have been engaged in the basic study of electromagnetic phenomena that are possibly associated with EQs, including testing of the controversial VAN method (2–5). The VAN method is based on the premise that large EQs are preceded by observable anomalous changes in geoelectric potential called seismic electric signals (SESs). The essentials of the VAN method are (i) noise rejection, (ii) existence of SES-sensitive sites, and (iii) selectivity, i.e., SES-sensitive sites being sensitive only to specific focal area(s). Often, a station may be sensitive to focal areas in one direction but not in others. The so-called ΔV/L test is to determine whether a potential difference change is compatible with uniform field change (in the scale of short dipole network) to eliminate the noise from local origins. Noises from more distant origins are eliminated with long dipoles. In Japan, where industrial and electric train noise is much higher than in Greece, noise rejection is a more serious task.
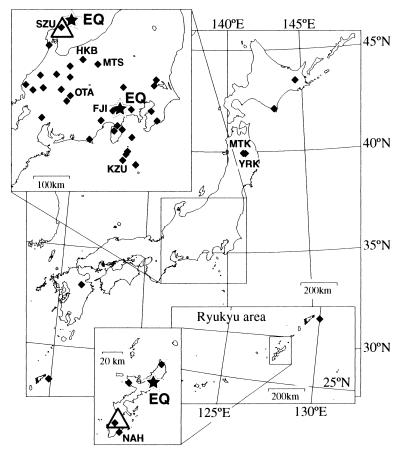
Our study has taken place in two stages. In stage 1 (1987–1995), only long dipole (L = 1–10 km, where L is dipole length) networks were used (6–8). In stage 2 (1996-), short (L = ≈100 m) dipoles have been added. There are now 40 stations in operation, constituting the world's densest network for the purpose (Fig. 1). The data are telemetered daily through public telephone lines to the central Recording Laboratory at Tokai University. The sampling rate is normally once in 10 s.
Figure 1.
Distribution of stage 2 geoelectric potential monitoring stations (filled diamonds). Stage 1 stations mentioned in this paper (NAH and SZU) are also shown by open triangles. Some EQs (stars) and related stations are depicted in insets as needed.
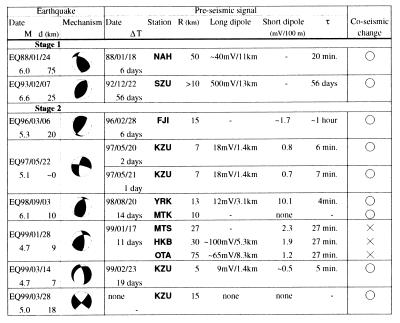
We have recorded several changes in geoelectric potential difference that may have been precursory to EQs (Table 1). Brief descriptions are given below. Coseismic changes were observed in most cases (9). EQs are identified as EQxx/yy/zz, showing their year (xx), month (yy), and day (zz).
Table 1.
EQ and possible signal pairs
M and d stand for the Japan Meteorological Agency magnitude and focal depth. R, τ, and ΔT are the epicentral distance to concerned station, duration, and lead time of the electric changes. ΔT is defined as the time difference between the onset of change and EQ. EQ source mechanisms are from refs. 10–12 and The National Research Institute of Earth Science and Disaster Prevention (http://argent.geo.bosai.go.jp/freesia/).
Observed Changes
Stage 1: Magnitude (M)6.0 EQ88/01/24.
A multipeaked preseismic change was recorded on multiple channels of the Naha (NAH) long dipole network 6 days before this EQ at about 50 km northeast of the network (Fig. 1). The change occurred at four electrodes that are separated by distances of 10–20 km, covering the southern Okinawa Island, indicating that the change was regional and highly unlikely man-made noise. The Island has no electric railways. During the observation period (87/09/25–91/07/01), there were no other M ≥ 5 EQ in the Okinawa region nor any similar electric change at the NAH network (7).
M6.6 off Noto Peninsula EQ93/02/07.
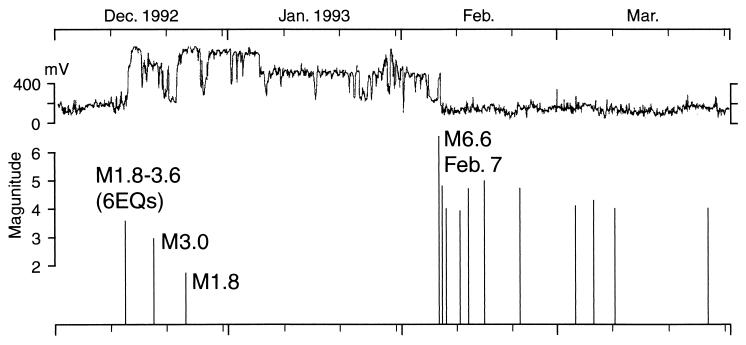
A strong change lasting for 56 days, until the EQ occurrence at less than 10-km epicentral distance, was recorded on the Suzu (SZU) long dipole network (Figs. 1 and 2; ref. 8). It started almost simultaneously with M3.6 and smaller EQs that in hindsight were determined to be foreshocks. The change occurred on only one of five electrodes of the network. The particular electrode, however, was on the tip of Noto Peninsula, closest to the epicenter. Subsequently, it has been found that the tip of the peninsula is effectively insulated electrically from the inland area: noises recorded commonly at inland electrodes are not detected at the tip. This situation may explain why the change was not observed at other electrodes. The change was strong and long unlike ordinary VAN′s SESs and similar to their gradual variation of electric field that occurs only before M ≥ 6 EQs (2, 3). Ishido and Pritchett (13) proposed that the change was due to the electrokinetic effect associated with dilatancy-induced water boiling in the focal zone.
Figure 2.
Hourly mean value records of a SZU long dipole and EQ occurrences (92/12/01–93/03/31; ref. 8).
Stage 2: M5.3 EQ96/03/06.
Kita Fuji (FJI) station (Fig. 1) was noisy mainly because of electric trains. When there are two dipoles with widely different orientations, east-west and north-south components of electric field change can be calculated to give the so-called particle motion diagram type plot of time change. Often, such a diagram reveals notable polarization of dominant noise. In such a case, by rotating the axis of projection to the direction perpendicular to that of polarization, effects of noise can be much reduced (9). By using this technique, a 1-h multipeaked anomalous change, satisfying the ΔV/L test, was detected on 96/02/28, 6 days before the M5.3 EQ96/03/06 at 15-km epicentral distance. The change took place from 01:45 to 02:45 local time when man-made noise was at the minimal level. Several M ≥ 4 EQs occurred within 50 km of FJI station during the observation period (95/12/27–98/10/16), but EQ96/03/06 was the only M ≥ 5 EQ, and other smaller EQs were not preceded by recognizable electric signals. On the other hand, later in the observation period, there were two electric changes with 2- to 3-min duration, satisfying the ΔV/L test, that were not followed by EQs. The source of these changes is unknown.
M5.1 EQ97/05/22.
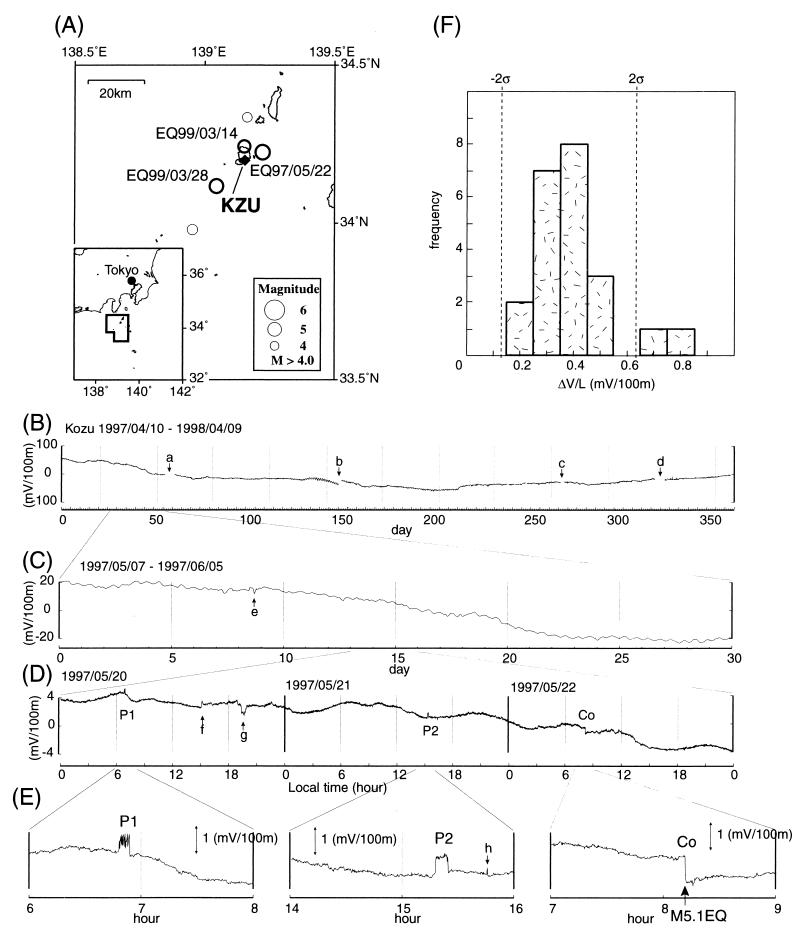
This EQ occurred ≈7 km east of Kozu-shima Island, about 170 km south of Tokyo, where KZU station had been in operation with three long and five short dipoles (14). The island is electrically quiet as shown in Fig. 3 B–E. This EQ was one of the two M ≥ 5 EQs that occurred in the area during the observation period: 97/04/10–99/05/31 (Fig. 3A). On 97/05/20 and 97/05/21, 1 and 2 days before the EQ, there were clear electric changes (Fig. 3 D and E) on both long and short dipoles, satisfying the ΔV/L test. Fig. 3E shows the coseismic signal also (9, 15). During the same period, 19 smaller changes equally satisfying the above conditions were observed. It was, however, not practical to correlate them with the equally numerous small EQs (see caption of Fig. 3A). As seen in Fig. 3F, the two changes mentioned above were the only two having intensity of 0.8 and 0.7 mV/100 m that exceeds 2σ of the recognized changes.
Figure 3.
(A) Seismicity (M > 4.0) around Kozu-shima Island (97/04/10–99/05/31) and KZU station. Although not shown in the map, there were 24 M ≥ 3.5 EQs in the region. (B) A 1-year record at one of the short dipoles at KZU station, showing the long-term stability of measurement. The hourly mean value is shown. a, b, c, and d indicate interruptions of recording. (C) A 1-month record. The hourly mean value is shown. Semidiurnal change represents the tidal effect. e indicates a change induced by geomagnetic variation. (D and E) Shown are 3-day and 2-h records of 10 s mean values, showing the preseismic changes P1 and P2, as well as the coseismic changes (Co). f, g, and h indicate changes induced by geomagnetic variations. (F) Frequency histogram of recognized anomalous changes during the observation period.
The second M ≥ 5 EQ, M5.0 EQ99/03/28, at R ≈ 15 km to the southwest of the island (Fig. 3A), did not show any change. Shortly before this EQ, there was an M4.7 EQ99/03/14 with a closer epicenter. This EQ with foreshock and aftershock activity (15) was preceded by a recognizable, but not so outstanding (0.3 mV/100 m), change on 99/02/23. Because the locality and source mechanism of EQs may affect the appearance of preseismic signals (2, 3, 16), these observations may be worth further study.
M6.1 EQ98/09/03.
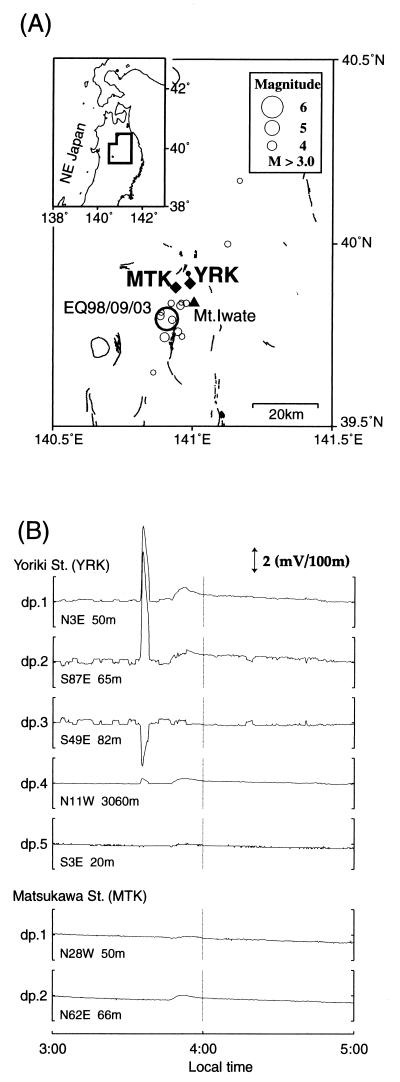
The Mt. Iwate network (Fig. 4A) was set up in June 1998 to monitor the increasing symptoms of volcanic activity of Mt. Iwate. Two sites, Yoriki (YRK) and Matsukawa (MTK), were occupied by short dipoles in perpendicular orientations. YRK had an additional long dipole. EQ98/09/03 occurred at R ≈ 13 km from YRK and R ≈ 10 km from MTK; 2 weeks before the EQ, in the early morning when the noise was low (03:35 local time), YRK short and long dipoles detected a remarkable change (Fig. 4B). Information from local possible noise sources, such as power and telephone companies and factories, indicated no special operation at that time. The change is the only change, and EQ98/09/03 is the only M ≥ 5 EQ in the area of Fig. 4A up to the present, making this time correlation highly noncoincidental.
Figure 4.
(A) Seismicity of Tohoku region (98/06/28–99/05/31) and Mt. Iwate stations YRK and MTK. (B) Preseismic change recorded at YRK on 98/08/20. dp, dipole.
The intensity of the change (ΔV/L) on the long (L = 3.06 km) dipole was much smaller than that on the short dipoles, even considering the high angles of the long dipole direction (N11°W) to the gradient of the field change (N58°E) as inferred from the short dipoles. In fact, the short dipole (L = 20 m) at the far end of the long dipole did not show any change. Moreover, at MTK, no change occurred (Fig. 4B). These observations indicate an extremely heterogeneous underground hydroelectrical struc-ture of the area. The area is at the foot of an active volcano, and geothermal power plants are operating at MTK (22 MW) and Kakkonda (80 MW) at a few kilometers northwest of the epicenter.
M4.7 EQ99/01/28.
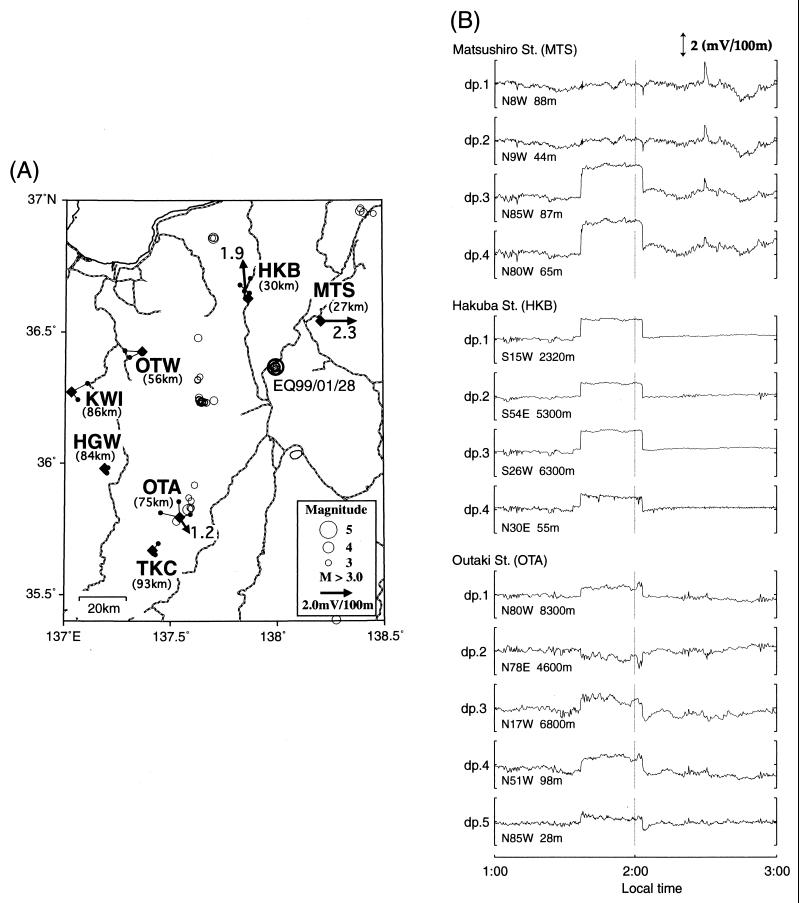
At 01:30 local time on 99/01/17, three widely separated stations, Matushiro (MTS), Hakuba (HKB), and Ohtaki (OTA) in Nagano Prefecture, Central Japan, revealed a simultaneous change lasting for 27 min (Fig. 5 A and B). Electric train noise is often observed at these stations but never simultaneously at three stations. After 11 days, a swarm of activity of more than 20 M ≥ 2 shocks, with the main shock M4.7 EQ99/01/28, occurred in the middle of the triangular area formed by the three stations (Fig. 5A). It may be argued that if a M4.7 EQ generates an observable precursor, signals should be much more common. However, as far as this area is concerned during our observation period, as can be seen in Fig. 5A, EQ99/01/28 was the only M ≥ 4 EQ in the whole area covered by the map. Excluding the six events associated with the aforementioned swarm activity, there were 37 M ≥ 3 EQs, and several of them occurred within 20 km of OTA; however, even the largest of them was M = 3.8. None of them were preceded by observable electric changes.
Figure 5.
(A) Distribution of stations and seismicity (98/10/01–99/05/31) in central Japan. MTS, HKB, and OTA recorded the change on 99/01/17, whereas other stations did not. The arrow and the number attached to each station are the change vector and epicentral distance. (B) The change simultaneously observed at the three stations on 99/01/17. dp, dipole.
This event was unique in several aspects. (i) Simultaneous change was observed at three widely separated stations for the first time. (ii) Epicentral distances to stations are larger than most other cases, the largest being 75 km (OTA). (iii) The signal was not detected at other stations, such as OTW, KWI, HGW, and TKC with similar epicentral distances. If the observed change was the SES of EQ99/01/28, the case is a possible example of the VAN′s selectivity situation (2–4). Even if the change was not SES, these observations testify to the selective transmission of electric disturbance in the region and hence the high heterogeneity of the underground electrical structure. In fact, Kawai (KWI) station, for instance, is completely free from train noise, whereas all other stations in the region are not.
It must be added, however, that the situation at each station was not ideal. (i) At MTS, the signal satisfied the ΔV/L = constant criterion (Fig. 5B), but the station had no long dipoles. (ii) At both HKB and OTA, there was only one short dipole at each end of the long dipoles; thus, the ΔV/L test could not be applied. Moreover, at HKB, ΔV/L for short dipoles varied greatly (3.6 ≈ 150 mV/100 m). Noise level, including the response to magnetotelluric disturbances, of short dipoles showing the extremely large ΔV/L was also two orders of magnitude higher than others. The reason for this striking phenomenon is unknown. Despite all of these conditions, the simultaneity of the signal at three stations seems to preclude any chancy coincidence.
Discussion and Conclusion
We have observed slow geoelectric potential changes, with varied characteristics, before several EQs in Japan. Actually, the changes were observed for all, except one (EQ99/03/28), of the cases where M ≥ 5 EQs occurred within 20 km of operating stations during our observation period. In two other cases (EQ88/01/24 and EQ99/01/28), the epicentral distance was greater. In the case of M4.7 EQ99/01/28, the signal appeared simultaneously at three distant stations. The lead time was 1–19 days in most cases, and longer (56 days) for the largest M6.6 EQ93/02/07. The long duration signal in the latter case seems to resemble the gradual variation of electric field of the VAN observation (4). Source mechanisms of the EQs (Table 1) were varied and showed no clear correlation with preseismic electric changes.
The certitude of their precursory nature is variable. In fact, unlike the cases of undeniable coseismic change (9), there is no absolute certainty by definition, although the time correlation of the changes with EQs is promising. In our earlier cases (stage 1), there were no multiple short dipoles; thus, nearby local noise was not excluded sufficiently. Sometimes, only one electrode of the long dipole networks showed a change. However, because the spatial extent of known SES-sensitive sites in Greece is only a few kilometers × ≈10 km (17), the criterion that all dipoles should show simultaneous change may not necessarily apply to our long dipole stations with 10-km scale. Even in stage 2, dipole configuration was not ideal in most cases. It seems, however, that the observation of distinctive geoelectric potential changes before EQs is increasing with progress in our signal/noise discrimination capability. Although it is still premature to conclude that these changes are precursory in nature, our results are suggestive.
Acknowledgments
The present research was conducted as a part of the Comprehensive Frontier Earthquake Research Programs funded by the Science and Technology Agency, Japan.
Abbreviations
- EQ
earthquake
- SES
seismic electric signal
- M
magnitude
References
- 1.Hayakawa M, editor. Atmospheric and Ionospheric Electromagnetic Phenomena Associated with Earthquakes. Tokyo: Terra Sci. Publ.; 1999. [Google Scholar]
- 2.Varotsos P, Alexopoulos K. Tectonophysics. 1984;110:73–98. [Google Scholar]
- 3.Varotsos P, Alexopoulos K. Tectonophysics. 1984;110:99–125. [Google Scholar]
- 4.Varotsos P, Lazaridou M, Eftaxias K, Alexopoulos K, Makris J, Kopanas J. In: A Critical Review of VAN. Lighthill J, editor. Singapore: World Scientific; 1996. pp. 29–76. [Google Scholar]
- 5.Lighthill J, editor. A Critical Review of VAN. Singapore: World Scientific; 1996. [Google Scholar]
- 6.Kinoshita M, Uyeshima M, Uyeda S. Bull Earthquake Res Inst Univ Tokyo. 1989;64:255–311. [Google Scholar]
- 7.Takahashi I, Nagao T, Uyeda S. Bull Inst Oceanic Res Dev Tokai Univ. 1999;20:31–40. [Google Scholar]
- 8.Nagao T, Uyeda S, Asai Y, Kono Y. In: A Critical Review of VAN. Lighthill J, editor. Singapore: World Scientific; 1996. pp. 292–300. [Google Scholar]
- 9.Nagao, T., Orihara, Y., Yamaguchi, T., Takahashi, I., Hattori, K., Noda, Y., Sayanagi, K. & Uyeda, S. (2000) Geophys. Res. Lett., in press.
- 10.Dziewonski A M, Ekstrom G, Woodhouse J H, Zwart G. Phys Earth Planet Inter. 1989;54:22–32. [Google Scholar]
- 11.Dziewonski A M, Ekstrom G, Woodhouse J H, Zwart G. Phys Earth Planet Inter. 1994;82:9–17. [Google Scholar]
- 12.Dziewonski A M, Ekstrom G, Woodhouse J H, Zwart G. Phys Earth Planet Inter. 1997;102:1–9. [Google Scholar]
- 13.Ishido T, Pritchett J W. J Geophys Res. 1999;104:15247–15259. [Google Scholar]
- 14.Orihara Y, Yamaguchi T, Nagao T, Uyeda S. Bull Inst Oceanic Res Dev Tokai Univ. 1999;20:17–30. [Google Scholar]
- 15.Orihara Y, Noda Y, Yamaguchi T, Takahashi I, Nagao T, Uyeda S. Bull Inst Oceanic Res Dev Tokai Univ. 2000;21:23–41. [Google Scholar]
- 16.Uyeda S, Al-Damegh K S, Dologlou E, Nagao T. Tectonophysics. 1999;304:41–55. [Google Scholar]
- 17.Varotsos P, Eftaxias K, Lazaridou M, Bogris N, Makris J. Acta Geophys Pol. 1998;46:55–57. [Google Scholar]


