

Abstract
objective
Health planners and policy makers are increasingly asking for a feasible method to identify vulnerable persons with the greatest health needs. We conducted a systematic review of the association between a single item assessing general self-rated health (GSRH) and mortality.
Data Sources
Systematic MEDLINE and EMBASE database searches for studies published from January 1966 to September 2003.
Review Methods
Two investigators independently searched English language prospective, community-based cohort studies that reported (1) all-cause mortality, (2) a question assessing GSRH; and (3) an adjusted relative risk or equivalent. The investigators searched the citations to determine inclusion eligibility and abstracted data by following a standarized protocol. Of the 163 relevant studies identified, 22 cohorts met the inclusion criteria. Using a random effects model, compared with persons reporting “excellent” health status, the relative risk (95% confidence interval) for all-cause mortality was 1.23 [1.09, 1.39], 1.44 [1.21, 1.71], and 1.92 [1.64, 2.25] for those reporting “good,”“fair,” and “poor” health status, respectively. This relationship was robust in sensitivity analyses, limited to studies that adjusted for co-morbid illness, functional status, cognitive status, and depression, and across subgroups defined by gender and country of origin.
Conclusions
Persons with “poor” self-rated health had a 2-fold higher mortality risk compared with persons with “excellent” self-rated health. Subjects' responses to a simple, single-item GSRH question maintained a strong association with mortality even after adjustment for key covariates such as functional status, depression, and co-morbidity.
Keywords: meta-analysis, mortality, risk assessment, self-rated health, quality of life
Several community-based cohort studies have reported a relationship between responses to a question assessing general health (e.g., “In general, how would you rate your health”? with response options of “excellent, very good, good, fair, or poor”) and mortality. In these studies, persons reporting “fair” or “poor” health had a higher risk for mortality.1–10 Other studies have failed to identify such a relationship, particularly after controlling for multiple covariates.7,11–14 The majority of studies looking for an association have been reported primarily in the social science literature, and, thus, the potential utility of a simple formula including a single general self-rated health (GSRH) question as a screening tool to identify groups at risk is not widely recognized by clinicians.15
We performed a review of the literature and quantitative analysis to expand the understanding of the value of single-item GSRH questions in predicting mortality. We examined prospective community-based cohort studies to assess the adjusted relationship between single-item measures of GSRH and mortality, and evaluated the robustness of the relationship in important subgroups and in sensitivity analyses.
METHODS
Search Strategy
We performed a literature search of the MEDLINE and EMBASE databases (from January 1966 to September 2003) using the Medical Subject Headings and text words of health status, quality of life, mortality, death, dying, survival and keywords such as self-rated health, self-reported health, SF-1, general health status, and perceived health. We restricted the search to studies published in English-language journals and conducted in human subjects. We also performed a manual search based upon reference lists from published original studies and relevant review articles.
We identified 93 published studies from MEDLINE and EMBASE searches. An additional 70 studies from the reference lists of the originally identified articles, for a total of 163 studies, were identified. Two investigators (K.D. and N.B.) independently reviewed the contents of these manuscripts to determine whether they met the criteria for inclusion. When discrepancies occurred between investigators in determining inclusion or exclusion, other investigators (K.R. and P.M.) conducted an additional evaluation of the study and discrepancies were resolved in conference.
Inclusion Criteria
To be included in our meta-analysis, a study had to meet the following criteria: (1) it had to be a prospective cohort study design; (2) participants had to have recruited from the community (i.e., noninstitutionalized and nonclinic populations); (3) adjusted analyses had to be performed and reported; (4) the relative risk or its equivalent (i.e., hazard ratio, odds ratio) and corresponding variance measure (e.g., standard error) had to be reported; (5) GSRH had to be determined by a single question; (6) exact wording and response categories for the GSRH question had to be reported; (7) response categories had to be clearly specified; (8) all-cause mortality had to be reported as an outcome measure and (9) death had to be confirmed via an official database or death certificate; (10) the reference category was not created from collapsing 2 or more response categories (e.g., combining “excellent” and “good”) for studies reporting multiple response categories; and (11) the response categories had to be similar enough to those of other studies to be pooled together.
Out of the 163 identified articles, 142 did not meet 1 or more of the inclusion criteria. The most common reason for exclusion was the absence of all-cause mortality as an outcome measure (n=36). Additional reasons for exclusion included the following: GSRH was either not determined from a single question or the question wording and response options were not available (n=33); the cohorts were not community based (n=18); no relative risk or equivalent was reported (n=17); the study design was not a prospective cohort (n=4), or adjusted analyses were not reported (n=2); and the reference category was created from collapsing 2 or more response categories (n=10); or the response categories were too dissimilar to be pooled (n=3). An additional 19 articles were excluded because they represented repeated analyses of cohort studies already included. When 2 publications based on the same cohort were identified, the abstractors independently reviewed the articles and selected the one with the largest number of participants, the greatest number of events, and the longest follow-up. When any information relevant to inclusion was unclear or missing from the publication text, authors were contacted on up to 3 separate occasions via e-mail. Authors from 17 publications were contacted to clarify information, and responses from 10 were received. Ultimately, 2 of the articles7,16 remained eligible for inclusion based upon the authors' responses. The remaining studies were excluded because they did not meet inclusion criteria even after the information was clarified.
This exclusion process resulted in a total of 20 articles included for abstraction. One of these articles reported results on 2 separate cohorts and they were analyzed as 2 independent studies.17 One study, which presented the results as both a dichotomous and categorical variable,9 was included in both sets of analyses. The final number of distinct, eligible cohorts for this analysis was 22. Of these, 8 reported responses to the GSRH question in 2 categories (e.g., “excellent/very good/good” GSRH vs “fair/poor” GSRH) and 14 in multiple response categories (e.g., “excellent” vs “good,”“fair,” or “poor” health).
Data Extraction
All data were independently abstracted in duplicate. We used a standardized protocol and abstraction form that recorded the following information: first author's name, study title, publication year, study country, name of cohort, total and cause-specific mortality (if stated), method used to assess self-rated health (e.g., in-person interview), exact wording of the GSRH question, response options, the response category used as a reference, characteristics of cohort participants (e.g., age, sex, race), number of participants enrolled in the cohort and included the final data analysis, and the maximum duration of follow-up. We abstracted relative risks and their confidence intervals (CIs) or standard errors, overall and for a priori–defined subgroups. We also abstracted the confounding factors controlled for in the original articles and grouped them into 9 categories including: age, sex, socioeconomic status, health behaviors, social support, co-morbid illness, functional status, depression, and cognitive function. Definitions for these categories are provided in Appendix A.
Data Synthesis
We separately pooled the results from studies that presented GSRH responses as a dichotomous variable6–8,16,18–20 from the results of studies reporting GSRH responses as a categorical variable such as “excellent,”“very good,”“good,”“fair,” and “poor”.
We used relative risks and 95% CIs as the measure of association between GSRH response and all-cause mortality. To stabilize the variances and to normalize the distributions, the relative risks from individual studies for each response level of GSRH and the corresponding standard errors were transformed to their natural logarithms. When necessary, standard errors were derived from the CIs provided in each original study.
We used the highest GSRH option (e.g., “excellent”) as the reference category. For studies that reported worse self-rated health as the reference category (e.g., “poor” as the reference), we inverted the relative risk and calculated the standard errors using Taylor Series approximation methods. For studies that only reported stratified results (e.g., for males and females, separately), we weighted the strata by the inverse of their variance and then combined them to obtain an overall log-relative risk and standard error.
We tested for heterogeneity using fixed effects and the DerSimonian and Laird random-effects model to calculate the pooled relative risk by level of GSRH response.21 Both models yielded similar findings, and so we present only the results from the random-effects model. We performed a weighted meta-regression analysis with no intercept term to examine trends between progressively worse self-rated health and increasing risk of death using the “pool-first” method proposed by Greenland and Longnecker.22 The potential for publication bias was first examined by constructing a funnel plot of the inverse of the standard error versus the effect size on a logarithmic scale, and statistically assessing asymmetry.23
To assess the robustness of the relationship between GSRH and mortality, we performed subgroup and sensitivity analyses on studies reporting GSRH responses in multiple categories. We conducted a priori subgroup analyses by gender, comparative GSRH question wording (e.g., “Compared to others your age, how would you rate your health?”) versus noncomparative question wording (e.g., “In general, how would you rate your health?”), country of origin (United States vs non-United States), and studies with a maximum duration of follow-up greater than or less than 5 years. Additional sensitivity analyses were performed limited to studies that adjusted for depression, functional status, cognitive function, co-morbidity, and socioeconomic status. All analyses were conducted using STATA statistical software (version 7.0, College Station, Tex).
RESULTS
Baseline Characteristics
The characteristics of 8 studies that reported GSRH responses as a dichotomous variable are presented in Table 1. The number of participants in these studies ranged from 463 in Ginsberg et al.20 to 701,547 in McGee et al.8 Two of the studies consisted exclusively of males,18,19 1 entirely of females,9 and the rest included both genders.6–8,16,20 Three of the 8 studies were conducted in the United States8,9,16 with the remaining 5 outside of the United States.6,7,18–20 Four studies reported a comparative wording GSRH question.7,9,16,20 Prior to collapsing GSRH response categories for presentation in the original manuscripts, the number of categories ranged from 2 to 5. The follow-up period ranged from 47 to 25.1 years19 with 1 study not reporting the duration of follow-up16 and 6 studies with follow-up of greater than 5 years.6,8,9,18–20
Table 1.
Characteristics of Studies That Reported GSRH Response Options Collapsed into 2 Categories
| Source | Cohort* | Question Wording | Response Categories | Duration of Follow-up† | Number of Deaths | Covariates‡ |
|---|---|---|---|---|---|---|
| Grand et al.7 | 645 (45% male) aged 60 yHaute-Garonne region, France | If you compare your health to other persons' health of the same age whom you know? | Same/better# Worse | 4 y | 111 | Age |
| Thomas et al.16 | 1,855 (N/A) aged 65–98 yUnited States | Compared to other people your age, would you say that your health is? | Excellent/goodFair/poor | Not reported | Not reported | Co-morbid illness,∥ functional status, depression |
| Sundquist and Johansson,6 SALLS | 39,156 (49% male) aged 25–74 ySweden | How would you describe your general health? | GoodBad/anywhere between | 14 y | 4,362 | Age, SES, social support |
| Engstrom et al.19 | 632 (100% male) aged 55 y§ Malmo, Sweden | What do you think of your overall health at the present? | GoodAverage/poor | 25.1 y | 327 | Age, health behaviors, co-morbid illness |
| Ginsberg et al.20 | 463 (52% male) aged 69.9 y§ Western Jerusalem, Israel | In comparison to other persons of your age, would you define your health as being? | Verygood/good/averageBad | 6 y | 99 | Age, sex, SES, health behaviors, social support, co-morbid illness, functional status, depression, cognitive function |
| Greiner et al.9 Nun Study¶ | 630 (100% female) aged 75–102 yUnited States | Compared to other sisters your age, would you say your health is? | Excellent/very good/goodFair/poor | 6.5 y | 232 | Age, functional status |
| McGee et al.8 NHIS | 701,547 (46% male) aged>18 yUnited States | Would you say in general your health is? | Excellent/very good/goodFair/poor | 9 y | 37,449 | Age, SES, health care utilization |
| Månsson and Råstam,18 | 5,800 (100% male) aged 16–64 yMalmo, Sweden | Do you feel perfectly healthy? | PerfectNot perfect | 11 y | 351 | Sex, health care utilization, co-morbid illness |
Number of individuals in the analysis (% male, N/A if not available), age range, study location.
Represents the maximum duration of follow-up.
Represents covariates entered into the adjusted analyses.
Average age.
Co-morbid illness–chronic disease as defined in Appendix A.
Study data reported with the GSRH question considered as both dichotomous and categorical. This study is presented and included in the dichotomous and categorical tables.
Underlined response option(s) represent(s) reference categories when calculating relative risks or equivalent.
SES, socioeconomic status; NHIS, National Health Interview Survey; SALLS, Swedish Annual Level of Living Survey; GSRH, General Self-Rated Health.
The 14 studies that reported the GSRH question at multiple response levels are presented in Table 2. The number of study participants ranged from 6309 to 6,523.15 Only 1 study consisted entirely of females9 and the rest included both females and males.3,12,15,17,24–31 Five of the studies were conducted in the United States,9,15,25,26,28 6 in European countries,17,24,27,30,31 2 in Australia,12,29 and 1 in Canada.3 Two studies assessed GSRH using comparative wording3,9 and the number of response options offered for the GSRH questions ranged from 3 to 5. The duration of follow-up ranged from 15 months30 to 21 years,15 with 10 studies having greater than 5 years of follow-up.3,9,12,15,17,24–31 All studies adjusted for age and at least one other covariate.
Table 2.
Characteristics of Studies Presenting GSRH at Multiple Response Levels
| Source | Cohort* | Question Wording | Response Categories | Duration of Follow-up† | Number of Deaths | Covariates‡ |
|---|---|---|---|---|---|---|
| Mossey and Shapiro,3 Manitoba LSA | 2,857 (50% male) aged≥60 yMB, Canada | For your age, would you say, in general, your health is … | Excellent** Good Fair Poor/bad | 7 y | 592 | Age, sex, SES |
| Idler and Kasl,28 EPESE | 2,812 (41% male) aged≥65 yNew Haven, Conn | How would you rate your health at the present time? | ExcellentGood Fair Poor/bad | 1,460 d | 624 | Age, health behaviors, social support, co-morbid illness,∥ functional status, depression |
| Ruigomez et al.31 HISB | 989 (39% male) aged≥65 ySpain | How would you rate your overall health? | Very goodGood Fair Poor/very poor | 5 y | 224 | Age, sex, SES, health behaviors |
| McCallum et al.12 Aging and Family Project Survey | 811 (N/A) aged≥60 yAustralia | Would you say your overall health is …? | ExcellentGood Fair Poor | 7 y | 231 | Age, race, SES, social support, co-morbid illness, functional status, depression, proxy interview |
| Hays et al.26 EPESE | 3,971 (35% male) aged 65–101 yUnited States | Overall, how would you rate your health? | ExcellentGood Fair Poor | 5 y | 854 | Age, race, SES, health behaviors, health care utilization, social support, co-morbid illness, functional status, depression, cognitive function |
| Bernard et al.25 NSSCA | 3,476 (N/A) aged 65 yUnited States | How would you rate your health at the present time? | ExcellentVery good Fair Poor | 2.5 y | 725 | Age, sex, race, SES, social support, co-morbid illness, functional status |
| Jylha et al.17§ ELSA—Florence | 864 (54% male) aged 60 to 89 yFlorence, Italy | How would you evaluate your present health? | Very goodFairly good Average Fairly poor Poor | 7 y | 395 | Age, SES, health care utilization, co-morbid illness, functional status |
| Jylha et al.17 ELSA—Tampere | 1,059 (50% male) aged 60 to 89 y Tampere, Finland | How would you evaluate your present health? | Very goodFairly good Average Fairly poor Poor | 7 y | 454 | Age, SES, health care utilization, co-morbid illness, functional status |
| Bath,24 NLSAA | 995 (39% male) aged≥65 y Nottingham, UK | How would you rate your present health? | ExcellentGood Average Fair Poor | 12 y | 667 | Age, sex, health behaviors, health care utilization, co-morbid illness |
| Greiner et al.9¶ Nun Study | 630 (100% female) aged 75–102 yUnited States | Compared to sisters your age, would you say your health is? | Excellent** Very good Good Fair Poor | 6.5 y | 232 | Age, functional status |
| Helmer et al.27 PAQUID | 3,660 (42% male) aged 65–101 yFrance | How would you rate your health status presently? | Very good** Good Fair Bad/very bad | 5 y | 769 | Age, SES, health behaviors, health care utilization, social support, co-morbid illness, functional status, depression, cognitive function |
| Korten et al.29 | 897 (51% male) aged≥70 yAustralia | Would you say your overall health nowadays is … | Excellent** Good Fair Poor | 3.6 y# | 172 | Age, sex, co-morbid illness, functional status, depression, cognitive function |
| Idler et al.15 NHANES I | 6,523 (47% male) aged 25–74 yUnited States | Would you say your health in general is? | Excellent** Very good Good Fair Poor | 21 y | 1,919 | Age, health behaviors, co-morbid illness |
| Nybo et al.30 Danish 1905 Cohort Study | 1,806 (27% male) aged 90 yDenmark | How do you consider your health in general? | Excellent** Good Acceptable Poor/very poor | 15 mo | 579 | SES, health behaviors, social support, co-morbid illness, functional status, cognitive function |
Number of individuals in the analysis (% male, N/A if not available), age range, study location.
Represents the maximum duration of follow-up.
Represents covariates entered into the adjusted analyses.
Study analyzed data from separate cohorts and was treated as 2 cohorts.
Co-morbid illness—chronic disease as defined in Appendix A.
Study data reported with the GSRH question considered as both dichotomous and categorical. This study is presented and included in the dichotomous and categorical tables.
Average follow-up period.
Underlined response option represents reference categories when calculating relative risks or equivalent.
SES, socioeconomic status; NLSAA, Nottingham Longitudinal Study and Aging and Activity; NSSCA, National Survey of Self Care and Aging; EPESE, Established Populations for Epidemiologic Studies of the Elderly; PAQUID, Personnes Agées QUID, NHANES I, First National Health and Nutrition Examination Survey; ELSA, European Longitudinal Study on Aging; LSA, Longitudinal Study on Aging; HISB, Health Interview Study of Barcelona; GSRH, General Self-Rated Health.
Risk Estimates
Figure 1 presents the relative risk estimate and 95% CI of mortality associated with worse GSRH from each study, and an overall pooled estimate, for the 8 studies reporting GSRH question responses in 2 categories. In all but 1 of the 8 studies,20 a statistically significant association was present between worse GSRH and a higher relative risk of mortality. The aggregate odds ratio of mortality for individuals with “worse” versus “better” GSRH ratings was 1.99 [1.64, 2.42].
FIGURE 1.
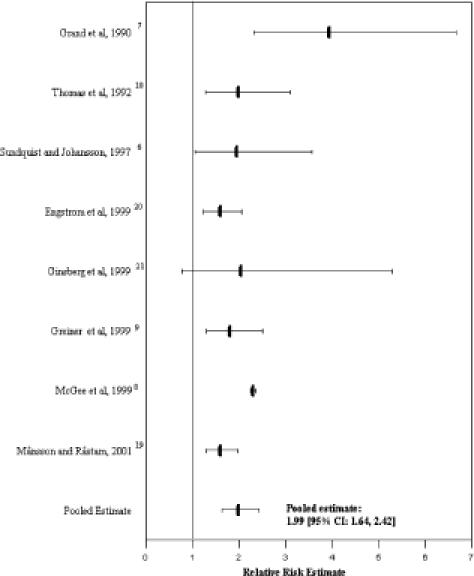
Relative risk estimate of mortality associated with general self-rated health in studies collapsing response options into 2 categories. *Bars represent the relative risk estimate reported for these studies and the lines represent the 95% confidence interval. The reference category was the highest (e.g., excellent) self-rated health category offered to the respondent.
In Figure 2, the relative risk estimates for studies reporting GSRH responses in multiple categories and the associated pooled mortality relative risk estimate are displayed. For these studies, a graded relationship was observed with a higher relative risk of all-cause mortality with incrementally worse GSRH. In the pooled analysis, compared with persons reporting “excellent” health status, the odds ratio [95% CI] of mortality was 1.23 [1.09, 1.39], 1.44 [1.21, 1.72], and 1.92 [1.64, 2.25] for individuals reporting “good,”“fair,” and “poor” health, respectively.
FIGURE 2.
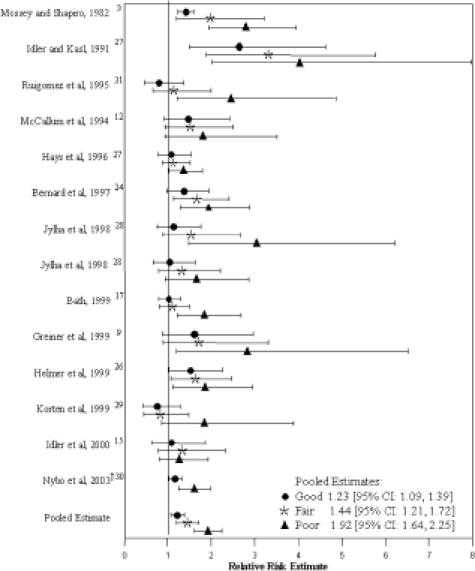
Adjusted relative risk estimate of mortality associated with general self-rated health in studies reporting multiple response levels. Symbols represent the relative risk estimate reported for these studies and the lines represent the 95% confidence interval. The reference category was the highest (e.g., excellent) self-rated health category offered to the respondent.
Subgroup Analyses
There was a graded association between GSRH and mortality present after stratification by gender,9,12,15,26–31 question wording,3,9,12,15,17,24–31 country of origin,3,9,12,15,17,24–31 and duration of follow-up3,9,12,15,17,24–31 (Table 3; each P trend <.05). The association between GSRH and mortality was similar for males and females, for studies conducted in the United States and elsewhere, and for studies with greater than and for those with less than 5 years maximum duration. However, the relative risk of mortality associated with worse GSRH was greater for GSRH questions that were phrased using comparative wording3,9 versus those using noncomparative wording.3,9,12,15,17,24–31 Differences in the association between GSRH and mortality across subgroups were not statistically significant (P value for interaction >.10).
Table 3.
Overall and Subgroup Relative Risk (95% CI) of Mortality Associated with Responses to a GSRH Question*
| Number of Studies | GSRH Response | Test for Trend P Value | |||
|---|---|---|---|---|---|
| Good | Fair | Poor | |||
| RR (95% CI) | RR (95% CI) | RR (95% CI) | |||
| Overall3,9,12,12,15,17,24–31 | 14 | 1.23 (1.09 to 1.39) | 1.44 (1.21 to 1.72) | 1.92 (1.64 to 2.25) | <.001 |
| Gender‡ | |||||
| Men12,12,15,26–31 | 8 | 1.21 (0.94 to 1.56) | 1.47 (1.07 to 2.01) | 1.87 (1.54 to 2.29) | <.001 |
| Women9,12,15,26–31 | 9 | 1.27 (0.99 to 1.62) | 1.44 (1.06 to 1.97) | 1.64 (1.26 to 2.14) | .042 |
| Question wording | |||||
| Noncomparative12, 15,17,24–31 | 12 | 1.18 (1.03 to 1.35) | 1.39 (1.15 to 1.68) | 1.77 (1.53 to 2.04) | <.001 |
| Comparative3,9 | 2 | 1.42 (1.26 to 1.60) | 1.87 (1.26 to 2.77) | 2.77 (2.00 to 3.85) | <.001 |
| Country of origin | |||||
| United States9,15,25,26,28 | 5 | 1.45 (1.07 to 1.94) | 1.68 (1.16 to 2.42) | 1.97 (1.37 to 2.83) | <.001 |
| Non-United States3,12,17,24,27,29,12,17,24,27,29–31, | 9 | 1.17 (1.02 to 1.35) | 1.34 (1.11 to 1.60) | 1.93 (1.64 to 2.27) | <.001 |
| Duration of follow-up | |||||
| ≤5 y25–31 | 7 | 1.22 (0.98 to 1.52) | 1.45 (1.05 to 2.00) | 1.80 (1.45 to 2.23) | <.001 |
| >5 y3,9,12,15,17,24,9,12,15,17,24 | 7 | 1.26 (1.10 to 1.45) | 1.40 (1.16 to 1.68) | 2.13 (1.75 to 2.59) | <.001 |
For studies presenting GSRH at multiple response levels.
P value >.10 for interaction across all subgroups.
Limited to studies reporting stratified results or that included 100% men or 100% women.
GSRH, General Self-Rated Health; RR, relative risk; CI, confidence interval. Relative risk estimates are compared to the highest (e.g., excellent) self-rated health category offered to the respondent.
Sensitivity Analyses
We performed sensitivity analyses as presented in Table 4. There was a graded association of higher relative risk estimates associated with incrementally worse GSRH in 14 studies, after dropping 1 outlier study.28 This association was robust in studies that adjusted for depression,12,25–30 functional status,9,12,17,25–30 cognitive function,26,27,29,30 co-morbidity,3,12,15,17,24–30,32 and socioeconomic status.3,12,17,25–27,30,31
Table 4.
Overall Relative Risk (95% CI) of Mortality Associated with Responses to a GSRH Question According to Different Exclusion Criteria*
| Category | Number of Studies | GSRH Response | Test for Trend P Value | ||
|---|---|---|---|---|---|
| Good | Fair | Poor | |||
| RR (95% CI) | RR (95% CI) | RR (95% CI) | |||
| Overall3, 9,12,15,17,24–31 | 14 | 1.23 (1.09 to 1.39) | 1.44 (1.21 to 1.72) | 1.92 (1.64 to 2.25) | <.001 |
| All studies except outliers†3,9,12,15,17,24–27,29–31 | 13 | 1.20 (1.08 to 1.34) | 1.34 (1.18 to 1.53) | 1.83 (1.59 to 2.11) | <.001 |
| Adjusted for co-morbidity3,12,15,17,24, 12,15,17,24–30 | 11 | 1.20 (1.05 to 1.38) | 1.42 (1.16 to 1.74) | 1.74 (1.51 to 2.02) | <.001 |
| Adjusted for depression12,25–30 | 5 | 1.35 (0.94 to 1.92) | 1.48 (1.01 to 2.19) | 1.87 (1.31 to 2.67) | <.001 |
| Adjusted for functional status9,12,17,25–30 | 10 | 1.21 (1.03 to 1.41) | 1.41 (1.12 to 1.77) | 1.80 (1.50 to 2.16) | <.001 |
| Adjusted for socioeconomic status3,12,17,25–27,30,31 | 9 | 1.25 (1.13 to 1.39) | 1.42 (1.22 to 1.65) | 1.86 (1.54 to 2.25) | <.001 |
| Adjusted for cognitive function 26,27,29,30 | 4 | 1.54 (1.30 to 1.81) | 1.19 (0.86 to 1.66) | 1.44 (0.95 to 1.38) | <.001 |
For studies presenting GSRH at multiple response levels.
Idler et al., 1991 was excluded for this analysis.
GSRH, General Self-Rated Health; RR, relative risk CI, confidence interval. Relative risk estimates are compared to the highest (e.g., excellent) self-rated health category offered to the respondent.
We found no evidence of publication bias with visual inspection and statistical evaluation of the funnel plot.
DISCUSSION
In this meta-analysis, we found a statistically significant relationship between worse GSRH and an increased risk of death. Study participants' responses to a simple, single-item GSRH question maintained a strong association with mortality even after adjustment for key covariates such as functional status, depression, and co-morbidity. Additionally, this relationship persisted in studies with a long duration of follow-up, for men and women, and irrespective of country origin.
Previous narrative reviews by Idler and Benyamini1, Thomas et al.,16 and Kawada2 presented the study results of GSRH and mortality with the majority of studies demonstrating a significant association. Despite the value of these previous reviews, neither involved a systematic or quantitative review of previously published reports. The meta-analytic techniques employed allowed us not only to estimate an overall relative risk of mortality for individuals with “poor” health, but also to assess the relative risk in subgroups and address the robustness of this relationship after adjustment for variables known to influence self-rated health and mortality.
In this study, we were able to assess whether a single-item GSRH question adds incremental value to the objective health measures currently collected and identified on surveys and in clinical practice. We found the association between GSRH and mortality was reduced among studies that adjusted for co-morbid illness, particularly among the subgroup of persons reporting “poor” health. This is not surprising as individuals with worse health are more likely to have multiple co-morbid conditions and when rating their health consider these existing medical problems. However, in a sensitivity analysis limited to studies that adjusted for co-morbid illness, a graded relationship was present with persons reporting “poor” health having a 1.74 [1.51, 2.02] times higher risk of dying than their counterparts reporting “excellent” health. Additionally, a significant, graded relationship of higher relative risks of mortality at worse GSRH persisted even when excluding studies that did not control for important domains known to influence self-rated health including depression, cognitive function, functional status, and socioeconomic status. This confirms prior evaluations of the relationship between GSRH and mortality that indicate the GSRH represents a broader dimension of health than these domains.33,34
Some of the more widely used tools from prior research in this area have focused on geriatric populations and have demonstrated predictive validity. A prediction tool developed by the ACOVE project was designed to identify elders at risk of death in the ensuing year.35 In the current meta-analysis, we have demonstrated that an array of prediction models that include GSRH employed in community-based studies also predicts subsequent mortality. We included studies in our analysis that evaluated the relationship in all adults, irrespective of age. Based upon the results of this meta-analysis, the GSRH measure demonstrates strong predictive properties in both geriatric and nongeriatric populations.
The observed association between GSRH and mortality may occur because GSRH serves as a proxy for the array of important covariates known to predict health and resource needs.14,36–38 GSRH may also function as a dynamic evaluation reflecting judgments about trajectory of health, rather than just the current level of health.39 It has also been postulated that GSRH influences subsequent health behaviors40 that affect health status, such as lifestyle modifications, or that it reflects an individual's personal knowledge of existing or future events that may attenuate decline in health.15,34 Importantly, GSRH appears to provide summative information about the various domains of health, as viewed by the individual responding to the question. Additionally, GSRH measures seem to capture some aspects of health that cannot easily be measured, as indicated by the persistent relationship between GSRH and mortality, even when multiple, important domains of health are controlled for in multivariate analyses.20,26
This meta-analysis provides additional evidence supporting the value of incorporating a single-item measure of self-rated health into risk assessment tools. The single-item GSRH measure takes seconds to collect and can be captured routinely and with a low burden of collection. Such a question could easily be collected from large populations and is readily interpretable, requiring no special scoring. In concert with other important predictors of health outcomes such as age, it would provide a straightforward, patient-centered, and inexpensive method to identify persons at increased risk of mortality. In the clinical environment, this information could be useful risk-stratifying individuals and triaging those with worse self-rated health to more intensive evaluations and care management programs.
The current manuscript was not designed to assess the ability of GSRH used in isolation as a risk prediction tool. Further research will aid in understanding the relative contribution and potential drawbacks of single-item measures of general health to risk prediction in the clinic setting. For example, to be useful in risk assessment, tools need strong performance characteristics, particularly for discriminating between persons at risk and not at risk.41 In a previous study, we evaluated the performance characteristics of GSRH in a clinic-based veteran population compared with the Physical Component Score (PCS) of the Short Form 36 and to a validated co-morbidity score.42 We also assessed the relative contribution of GSRH to age alone as a risk prediction tool, and to the co-morbidity score. The discriminatory ability, as measured by the area under the receiver operator curve (AUC/c-statistic), was 0.74, comparable with the performance of the PCS in our study (AUC/c-statistic 0.73) and significantly better than age alone (AUC/c-statistic 0.65).43 By comparison, the widely used VES-13, which includes GSRH, age, plus 11-items measuring functional status, has a reported AUC/c-statistic of 0.78.35
One of the possible practical limitations of using self-rated health measures as risk prediction is the potential for patients to report poorer health than they actually may experience in order to become eligible for more healthcare resources. Alternatively, providers may encourage their patients to report worse health to skew the profile of their patient population for future risk adjustment. Such problems exist for all tools employed in risk prediction and adjustment, whether these tools use self-reported health measures or administrative data.41
There are potential limitations to our study. First, exclusion of non-English language articles may have missed eligible studies, although language limitation does not always introduce bias into systematic reviews.44 Second, the quality of our study is dependent upon the quality of the original publications included in our analysis. However, we used strict criteria to enhance the quality of the studies included in our meta-analysis. Third, all systematic reviews are subject to publication bias from the general lack of reporting on negative associations. However, we did not detect publication bias. Fourth, there was variability in the number and definition of covariates controlled for across studies. To address this issue, we used strict inclusion criteria for the studies and performed sensitivity analyses. The consistency of the point estimate for mortality prediction in the sensitivity and subgroup analyses supports the concept that the relationship between GSRH and subsequent mortality is robust.
In summary, worse GSRH maintains a strong association with an increased risk of mortality even after accounting for key covariates such as co-morbidity. Although many issues related to the optimization of using a single-item GSRH need to be resolved, it appears to be a powerful adjunct that may help identify at-risk individuals and illuminate underlying illnesses that may go otherwise undetected during routine evaluations. We envision the current study as the first step towards familiarizing clinicians and health planners with the concept of assessing GSRH. Further work is needed to determine if assessing patients' GSRH in routine clinical settings can be used to improve care through the identification of groups at risk for increased mortality and other important health outcomes. Nonetheless, given the ease of use and low burden of using a single-item GSRH, the routine collection of these data may offer a beneficial tool in health care planning.
Acknowledgments
Dr. DeSalvo is a Robert Wood Johnson Foundation Generalist Faculty Physician Program Scholar.
She is supported by a grant from the NIH #K12HD 43,451 whose funding was used to support this project.
Supplementary Material
The following supplementary material is available for this article online at www.blackwell-synergy.com
Description of Variable Groupings.
References
- 1.Idler EL, Benyamini Y. Self-rated health and mortality: a review of twenty-seven community studies. J Health Soc Behav. 1997;38:21–37. [PubMed] [Google Scholar]
- 2.Kawada T. Self-rated health and life prognosis. Arch Med Res. 2003;34:343–7. doi: 10.1016/S0188-4409(03)00052-3. [DOI] [PubMed] [Google Scholar]
- 3.Mossey JM, Shapiro E. Self-rated health: a predictor of mortality among the elderly. Am J Public Health. 1982;72:800–8. doi: 10.2105/ajph.72.8.800. [DOI] [PMC free article] [PubMed] [Google Scholar]
- 4.Burstrom B, Fredlund P. Self rated health: is it as good a predictor of subsequent mortality among adults in lower as well as in higher social classes? J Epidemiol Community Health. 2001;55:836–40. doi: 10.1136/jech.55.11.836. [DOI] [PMC free article] [PubMed] [Google Scholar]
- 5.Yu ES, Kean YM, Slymen DJ, et al. Self-perceived health and 5-year mortality risks among the elderly in Shanghai, China. Am J Epidemiol. 1998;147:880–9. doi: 10.1093/oxfordjournals.aje.a009542. [see comment] [DOI] [PubMed] [Google Scholar]
- 6.Sundquist J, Johansson SE. Self reported poor health and low educational level predictors for mortality: a population based follow up study of 39,156 people in Sweden. J Epidemiol Community Health. 1997;51:35–40. doi: 10.1136/jech.51.1.35. [DOI] [PMC free article] [PubMed] [Google Scholar]
- 7.Grand A, Grosclaude P, Bocquet H, et al. Disability, psychosocial factors and mortality among the elderly in a rural French population. J Clin Epidemiol. 1990;43:773–82. doi: 10.1016/0895-4356(90)90237-j. [DOI] [PubMed] [Google Scholar]
- 8.McGee DL, Liao Y, Cao G, et al. Self-reported health status and mortality in a multiethnic US cohort. Am J Epidemiol. 1999;149:41–6. doi: 10.1093/oxfordjournals.aje.a009725. [DOI] [PubMed] [Google Scholar]
- 9.Greiner PA, Snowdon DA, Greiner LH. Self-rated function, self-rated health, and postmortem evidence of brain infarcts: findings from the Nun Study. J Gerontol. 1999;54:S219–22. doi: 10.1093/geronb/54b.4.s219. [DOI] [PubMed] [Google Scholar]
- 10.Appels A, Bosma H, Grabauskas V, et al. Self-rated health and mortality in a Lithuanian and a Dutch population. Soc Sci Med. 1996;42:681–9. doi: 10.1016/0277-9536(95)00195-6. [DOI] [PubMed] [Google Scholar]
- 11.Tsuji I, Minami Y, Keyl PM, et al. The predictive power of self-rated health, activities of daily living, and ambulatory activity for cause-specific mortality among the elderly: a three-year follow-up in urban Japan. J Am Geriatr Soc. 1994;42:153–6. doi: 10.1111/j.1532-5415.1994.tb04944.x. [DOI] [PubMed] [Google Scholar]
- 12.McCallum J, Shadbolt B, Wang D. Self-rated health and survival: a 7-year follow-up study of Australian elderly. Am J Public Health. 1994;84:1100–5. doi: 10.2105/ajph.84.7.1100. [DOI] [PMC free article] [PubMed] [Google Scholar]
- 13.Heidrich J, Liese AD, Lowel H, et al. Self-rated health and its relation to all-cause and cardiovascular mortality in southern Germany. Results from the MONICA Augsburg cohort study 1984–1995. Ann Epidemiol. 2002;12:338–45. doi: 10.1016/s1047-2797(01)00300-3. [DOI] [PubMed] [Google Scholar]
- 14.Kaplan GA, Goldberg DE, Everson SA, et al. Perceived health status and morbidity and mortality: evidence from the Kuopio ischaemic heart disease risk factor study. Int J Epidemiol. 1996;25:259–65. doi: 10.1093/ije/25.2.259. [DOI] [PubMed] [Google Scholar]
- 15.Idler EL, Russell LB, Davis D. Survival, functional limitations, and self-rated health in the NHANES I Epidemiologic Follow-up Study, 1992. First National Health and Nutrition Examination Survey. Am J Epidemiol. 2000;152:874–83. doi: 10.1093/aje/152.9.874. [DOI] [PubMed] [Google Scholar]
- 16.Thomas C, Kelman HR, Kennedy GJ, et al. Depressive symptoms and mortality in elderly persons. J Gerontol. 1992;47:S80–7. doi: 10.1093/geronj/47.2.s80. [DOI] [PubMed] [Google Scholar]
- 17.Jylha M, Guralnik JM, Ferrucci L, et al. Is self-rated health comparable across cultures and genders? J Gerontol. 1998;53:S144–52. doi: 10.1093/geronb/53b.3.s144. [DOI] [PubMed] [Google Scholar]
- 18.Mansson NO, Rastam L. Self-rated health as a predictor of disability pension and death—a prospective study of middle-aged men. Scand J Public Health. 2001;29:151–8. [PubMed] [Google Scholar]
- 19.Engstrom G, Hedblad B, Janzon L. Subjective well-being associated with improved survival in smoking and hypertensive men. J Cardiovasc Risk. 1999:257–61. doi: 10.1177/204748739900600411. [DOI] [PubMed] [Google Scholar]
- 20.Ginsberg GM, Hammerman-Rozenberg R, Cohen A, et al. Independence in instrumental activities of daily living and its effect on mortality. Aging Clin Exp Res. 1999;11:161–8. [PubMed] [Google Scholar]
- 21.DerSimonian R, Laird N. Meta-analysis in clinical trials. Controlled Clin Trials. 1986;7:177–88. doi: 10.1016/0197-2456(86)90046-2. [DOI] [PubMed] [Google Scholar]
- 22.Greenland S, Longnecker M. Methods for trend estimating from summarized dose-response data, with applications to meta-analysis. Am J Epidemiol. 1992:1301–9. doi: 10.1093/oxfordjournals.aje.a116237. [DOI] [PubMed] [Google Scholar]
- 23.Egger M, Davey Smith G, Schneider M, et al. Bias in meta-analysis detected by a simple, graphical test. Br Med J. 1997;3:629–34. doi: 10.1136/bmj.315.7109.629. [DOI] [PMC free article] [PubMed] [Google Scholar]
- 24.Bath PA. Self-rated health as a risk factor for prescribed drug use and future health and social service use in older people. J Gerontol A Biol Sci Med Sci. 1999;54:M565–70. doi: 10.1093/gerona/54.11.m565. [DOI] [PubMed] [Google Scholar]
- 25.Bernard SL, Kincade JE, Konrad TR, et al. Predicting mortality from community surveys of older adults: the importance of self-rated functional ability. J Gerontol. 1997;52:S155–63. doi: 10.1093/geronb/52b.3.s155. [DOI] [PubMed] [Google Scholar]
- 26.Hays JC, Schoenfeld D, Blazer DG, et al. Global self-ratings of health and mortality: hazard in the North Carolina Piedmont. J Clin Epidemiol. 1996;49:969–7. doi: 10.1016/0895-4356(96)00138-2. [DOI] [PubMed] [Google Scholar]
- 27.Helmer C, Barberger-Gateau P, Letenneur L, et al. Subjective health and mortality in French elderly women and men. J Gerontol. 1999;54:S84–92. doi: 10.1093/geronb/54b.2.s84. [DOI] [PubMed] [Google Scholar]
- 28.Idler EL, Kasl S. Health perceptions and survival: do global evaluations of health status really predict mortality? J Gerontol. 1991;46:S55–65. doi: 10.1093/geronj/46.2.s55. [DOI] [PubMed] [Google Scholar]
- 29.Korten AE, Jorm AF, Jiao Z, et al. Health, cognitive, and psychosocial factors as predictors of mortality in an elderly community sample. J Epidemiol Community Health. 1999;53:83–8. doi: 10.1136/jech.53.2.83. [DOI] [PMC free article] [PubMed] [Google Scholar]
- 30.Nybo H, Petersen HC, Gaist D, et al. Predictors of mortality in 2,249 nonagenarians—the Danish 1905-Cohort Survey. J Am Geriatr Soc. 2003;51:1365–73. doi: 10.1046/j.1532-5415.2003.51453.x. [DOI] [PubMed] [Google Scholar]
- 31.Ruigomez A, Alonso J, Anto JM. Relationship of health behaviours to five-year mortality in an elderly cohort. Age Ageing. 1995;24:113–39. doi: 10.1093/ageing/24.2.113. [DOI] [PubMed] [Google Scholar]
- 32.Mossey J, Shapiro E. Self-rated health: a predictor of mortality among the elderly. Am J Public Health. 1982;72:800–8. doi: 10.2105/ajph.72.8.800. [DOI] [PMC free article] [PubMed] [Google Scholar]
- 33.Kaplan G, Barell V, Lusky A. Subjective state of health and survival in elderly adults. J Gerontol. 1988;43:S114–20. doi: 10.1093/geronj/43.4.s114. [DOI] [PubMed] [Google Scholar]
- 34.Liang J. Self-reported physical health among aged adults. J Gerontol. 1986;41:248–60. doi: 10.1093/geronj/41.2.248. [DOI] [PubMed] [Google Scholar]
- 35.Saliba D, Elliott M, Rubenstein LZ, et al. The vulnerable elders survey: a tool for identifying vulnerable older people in the community. J Am Geriatr Soc. 2001;49:1691–9. doi: 10.1046/j.1532-5415.2001.49281.x. [DOI] [PubMed] [Google Scholar]
- 36.Krause NM, Jay GM. What do global self-rated health items measure? Med Care. 1994;32:930–42. doi: 10.1097/00005650-199409000-00004. [DOI] [PubMed] [Google Scholar]
- 37.Ferraro K. Self-ratings of health among the old and the old-old. J Health Soc Behav. 1980;20:45–51. [PubMed] [Google Scholar]
- 38.Mutran E, Ferraro K. Medical needs and use of services among older men and women. J Gerontol. 1988;43:S162–71. doi: 10.1093/geronj/43.5.s162. [DOI] [PubMed] [Google Scholar]
- 39.Kaplan G, Baron-Epel O. What lies behind the subjective evaluation of health status? Soc Sci Med. 2003;56:1669–76. doi: 10.1016/s0277-9536(02)00179-x. [DOI] [PubMed] [Google Scholar]
- 40.Cockerham W, Sharp K, Wilcox J. Aging and perceived health status. J Gerontol. 1983;38:349–55. doi: 10.1093/geronj/38.3.349. [DOI] [PubMed] [Google Scholar]
- 41.Iezzoni LI. Statistically derived predictive models: caveat Emptor. J Gen Intern Med. 1999;14:388–9. doi: 10.1046/j.1525-1497.1999.04049.x. [DOI] [PMC free article] [PubMed] [Google Scholar]
- 42.Fan VS, Au D, Heagerty P, et al. Validation of case-mix measures derived from self-reports of diagnoses and health. J Clin Epidemiol. 2002;55:371–80. doi: 10.1016/s0895-4356(01)00493-0. [DOI] [PubMed] [Google Scholar]
- 43.DeSalvo KB, Fan VS, McDonnell MB, et al. Predicting mortality and health care utilization with a single question. Health Serv Res. doi: 10.1111/j.1475-6773.2005.00404.x. in press. [DOI] [PMC free article] [PubMed] [Google Scholar]
- 44.Moher D, Pham B, Klassen TP, et al. What contributions do languages other than English make on the results of meta-analyses? J Clin Epidemiol. 2000;53:964–72. doi: 10.1016/s0895-4356(00)00188-8. [DOI] [PubMed] [Google Scholar]
Associated Data
This section collects any data citations, data availability statements, or supplementary materials included in this article.
Supplementary Materials
Description of Variable Groupings.