

SUMMARY
Recent ChIP experiments indicate that spliceosome assembly and splicing can occur cotranscriptionally in S. cerevisiae. However, only a few genes have been examined, and all have long second exons. To extend these studies, we analyzed intron-containing genes with different second exon lengths, by ChIP as well as by whole-genome tiling arrays (ChIP-CHIP). The data indicate that U1 snRNP recruitment is independent of exon length. Recursive splicing constructs, which uncouple U1 recruitment from transcription, suggest that cotranscriptional U1 recruitment contributes to optimal splicing efficiency. In contrast, U2 snRNP recruitment as well as cotranscriptional splicing is deficient on short second exon-genes. We estimate that ≥90% of endogenous yeast splicing is post-transcriptional, consistent with an analysis of post-transcriptional snRNP-associated pre-mRNA.
INTRODUCTION
Eukaryotic pre-mRNAs undergo a number of processing steps prior to export from the nucleus to the cytoplasm. Covalent modifications include 5′ capping, pre-mRNA splicing, and polyadenylation (for review, see Bentley, 2005). Some of these, capping for example, are intimately connected to transcription. Splicing, in contrast, has a more uncertain relationship to transcription, especially in yeast (Bentley, 2005; Neugebauer, 2002).
Intron removal by pre-mRNA splicing is carried out by the spliceosome, a macromolecular complex containing five small ribonucleoprotein particles (U snRNPs) and multiple non-snRNP auxiliary factors. Spliceosome assembly is directed by the pre-mRNA 5′ splice site, branch point, and 3′ splice site, after which two coupled transesterification reactions are catalyzed (Brow, 2002). Based largely on in vitro experiments, yeast spliceosome assembly begins with U1 snRNP association/base pairing with the 5′ splice site and Mud2p-BBP association with the branchpoint-3′ss region to form commitment complex (CC). In the first ATP-dependent step, U2 snRNP undergoes a base pairing interaction with the branch point in the pre-spliceosome. The U5.U4/U6 tri-snRNP then joins this U1–U2 complex to form the complete spliceosome. A number of major rearrangements ensue, which result in destabilization and release of U1 and U4 snRNPs from the spliceosome with concomitant activation (for reviews, see Brow, 2002; Burge et al., 1999; Jurica and Moore, 2003; Villa et al., 2002).
Many aspects of in vivo spliceosome assembly, splicing, and mRNP processing occur cotranscriptionally. In higher eukaryotes, RNA Pol II may directly promote cotranscriptional spliceosome assembly. The C-terminal domain (CTD) of Pol II consists of 52 repeats of a YSPTSPS heptad, which are differentially phosphorylated at serine-2 and serine-5 during transcription. This domain directly interacts with splicing factors and is probably responsible for coordination between transcription and splicing (for reviews, see Kornblihtt et al., 2004; Maniatis and Reed, 2002; Proudfoot et al., 2002). Recently, two groups described in vitro transcription-splicing systems that suggest Pol II-synthesized substrates are spliced much more efficiently than pre-synthesized or T7-derived transcripts (Das et al., 2006; Ghosh and Garcia-Blanco, 2000; Hicks et al., 2006). These reports demonstrate a functional coupling between transcription and splicing, i.e., Pol II transcription is required for efficient shunting of the pre-mRNA into the spliceosome assembly pathway. Although the coupling mechanism(s) between transcription and splicing is less well understood in yeast, there are some positive indications, and introns appear to stimulate gene expression (Furger et al., 2002; Howe et al., 2003; Juneau et al., 2006; Lacadie et al., 2006).
Recent in vivo studies of yeast spliceosome assembly have benefited from the application of chromatin immunoprecipitation (ChIP) to assess U snRNP association with nascent pre-mRNAs (Gornemann et al., 2005; Kotovic et al., 2003; Lacadie and Rosbash, 2005). The approach monitors where along a gene snRNPs are recruited to nascent pre-mRNA and associates distance along a gene with assembly time, i.e., where = when. Like the in vitro studies, the in vivo experiments depict a step-wise assembly pathway, at least CC formation followed by association of the other splicing snRNPs (Gornemann et al., 2005; Lacadie and Rosbash, 2005; Tardiff and Rosbash, 2006). Although preformed penta-snRNP complexes have been purified under low salt conditions in vitro (Stevens et al., 2002), this particle does not seem to be required in vivo and may not participate in cotranscriptional spliceosome assembly (Tardiff and Rosbash, 2006). Studies in HeLa nuclear extracts give rise to similar conclusions (Behzadnia et al., 2006). We have also recently observed cotranscriptional splicing by using a split MS2 ChIP assay (Lacadie et al., 2006).
The data describing cotranscriptional assembly and splicing in yeast is based on a limited number of intron-containing genes. Moreover, these studies have focused on genes with relatively long (>1 kb) second exons, which facilitate the ChIP analysis. However, a significant number of yeast intron-containing genes have second exons considerably smaller than 1 kb (see below). These include many ribosomal protein genes, which comprise ~40% of intron-containing yeast genes. Ribosomal proteins are generally small, and their genes therefore have short open reading frames. They are also highly transcribed and therefore generate a considerable fraction of cellular mRNA (Ares et al., 1999). This second exon size difference is non-trivial, because our studies suggested that cotranscriptional splicing occurs about 1 kb after the 3′ss (Lacadie and Rosbash, 2005). Perhaps there are specific mechanisms to ensure that spliceosome assembly is cotranscriptional. For example, Pol II elongation rates could decrease, allowing more time for the recruitment and function of splicing factors. To address this directly, we assayed cotranscriptional spliceosome assembly and splicing of genes with various second exon lengths. ChIP experiments demonstrate that cotranscriptional U1:U2 ratios are well-correlated with second exon length, suggesting a kinetic competition between spliceosome assembly and 3′ end formation. Post-transcriptional splicing complexes corroborate cotranscriptional recruitment, namely, shorter second exon genes are released from the site of transcription at an earlier stage of spliceosome assembly. Whole-genome tiling arrays provide high resolution recruitment patterns as well as more detailed information about splicing kinetics on a large number of intron-containing genes. Finally, a ChIP assay on a set of recursive splicing constructs suggests that cotranscriptional U1 snRNP recruitment contributes to splicing efficiency, whereas post-transcriptional U2/tri-snRNP recruitment is as efficient as cotranscriptional recruitment.
RESULTS
Most S. cerevisiae second exons are short
Recent in vivo experiments on yeast cotranscriptional spliceosome assembly and splicing have examined genes with relatively long (>1 kb) second exons, e.g., ACT1 and ECM33 (Figure S1). To examine the extent to which these are representative, we generated a histogram describing the distribution of second intron lengths of 238 annotated yeast intron-containing genes (Figure S1A). The most populated group contains second exons between 300 and 400 bp, and the median second exon length is 434 bp. These lengths are much shorter than the positions along second exons where spliceosome assembly and splicing appear to take place, i.e., maximal U2/U5 levels occur ~500 bp past the 3′ ss, and splicing occurs ~1 kb past the 3′ ss (Gornemann et al., 2005; Kotovic et al., 2003; Lacadie and Rosbash, 2005; Lacadie et al., 2006). The distinction is even more striking when relative transcription rates are considered (Figure S1B). This is largely due to ribosomal protein genes, which are intensely transcribed (Ares et al., 1999; Holstege et al., 1998; Warner, 1999) and also have short second exons. These observations suggest the possibility that only a small fraction of intron-containing nascent pre-mRNAs are sufficiently long to support cotranscriptional splicing (Figure S1B). Alternatively, short second exon genes could have altered transcription or spliceosome assembly to allow cotranscriptional splicing.
Nascent RP51A and ACT1 pre-mRNAs show different spliceosome assembly patterns
To distinguish between these two possibilities, we used a standard ChIP approach and compared U snRNP recruitment to ACT1 (long second exon: 1117 bp) and RP51A (short second exon: 407 bp). These are two well-studied intron-containing genes and have been used for in vivo as well as in vitro experiments.
On ACT1, U1 snRNP (U1C-TAP) signal peaks near the 3′ ss, whereas U2 snRNP (Lea1-TAP) peaks ~400 bp after the 3′ ss; the overall U1:U2 peak ratio is ~1:1 (Figure 1A), consistent with published results (Lacadie and Rosbash, 2005; Tardiff and Rosbash, 2006). In contrast, snRNP recruitment to RP51A is different. Although U1 peaks within the intron similar to ACT1 recruitment, U2 snRNP levels are comparatively much lower, resulting in a U1:U2 peak ratio of ~3:1 (Figure 1B). Note that it is this relative difference between U1 and U2 levels rather than the absolute enrichment that is most relevant. Absolute levels are also influenced by transcription; RP51A is transcribed nearly 2-fold higher than ACT1 (Holstege et al., 1998; data not shown). One interpretation of this difference in U1:U2 ratio is that the second exon of RP51A is too short to recruit maximal levels of U2 snRNP. This hypothesis predicts that cleavage and polyadenylation would release the RNP from the transcription site, resulting in a significant fraction of post-transcriptional RP51A pre-mRNAs associated with U1 snRNP. We therefore immunoprecipitated U1 snRNP and compared the relative association between ACT1 and RP51A pre-mRNAs by RT-PCR. To ensure that the pre-mRNA was post-transcriptional and had undergone polyadenylation, reverse transcriptase was primed with oligo dT. Data were normalized to endogenous DBP2 pre-mRNA to control for experimental variation and the intronless gene, PMA1, is shown as a negative control. Poly(A)+ RP51A pre-mRNA is ~4 fold more highly associated with U1 snRNP than ACT1 (Figure 1C), suggesting that many RP51A pre-mRNAs are released from Pol II at an early stage of spliceosome assembly. Interestingly, there are also significant levels of post-transcriptional ACT1 pre-mRNA-U1 snRNP complexes despite robust cotranscriptional U2 snRNP recruitment (see Discussion).
Figure 1.
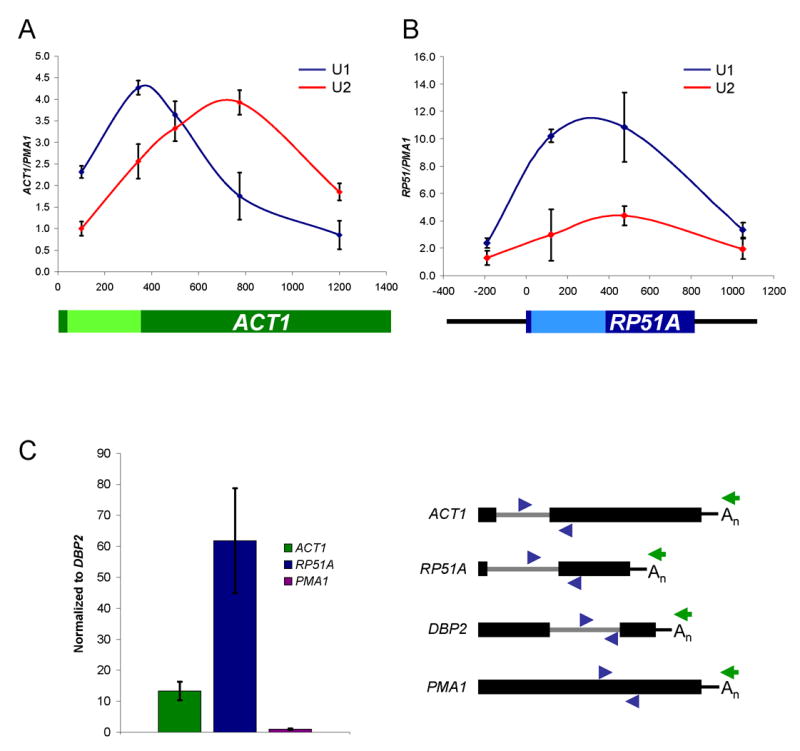
ACT1 and RP51A recruit different levels of U1 and U2 snRNPs cotranscriptionally. (A) ChIP results for U1 (blue) and U2 (red) snRNP recruitment to ACT1. Enrichment is expressed as ACT1 signal normalized to an intronless gene, PMA1. The exons (dark green) and intron (light green) of ACT1 are shown in the schematic below the graph. (B) ChIP results for RP51A. The exons (dark blue), intron (light blue), and upstream/downstream sequence (thin black line) of RP51A are shown in the schematic below the graph. (C) U1 snRNP IPs to characterize post-transcriptional RP51A and ACT1 pre-mRNA association. Pre-mRNA association (IP:IN ratio) is normalized to DBP2 pre-mRNA, which is highly U1-associated post-transcriptionally. Values were then set to 1.0 for PMA1, an intronless negative control. Schematics of genes (exons – thick black lines; introns – thin gray lines), PCR primer pairs (blue), and oligo dT (green) are shown to the right of the graph. Genes are not drawn exactly to scale. All data represent the average of at least two independent experiments and error bars report average deviation.
Second exon length determines extent of co-/post-transcriptional spliceosome assembly and splicing
The ACT1 and RP51A ChIP and snRNP IP data suggest that exon length may define a limited time window during which nascent spliceosome assembly can occur. However, the altered snRNP patterns could also result from other differences between genes. For example, specific secondary structures within yeast introns (Goguel and Rosbash, 1993; Newman, 1987; Parker and Patterson, 1987) or different promoters (Cramer et al., 1999; Kadener et al., 2001; Kadener et al., 2002) could alter snRNP recruitment in a gene-specific fashion. To minimize gene-specific differences, we created different second exon lengths within a single gene. The constructs are based on HZ18, which expresses a galactose-driven RP51A-LacZ fusion protein and has been assayed for snRNP recruitment by ChIP (Lacadie et al., 2006; Teem and Rosbash, 1983). The well-characterized ADH2 3′ UTR (Hyman et al., 1991) was inserted into LacZ of HZ18 to generate constructs with second exon lengths of approximately 350, 600, 1200, and 2300 bp (lengths include ~100 bp of 3′ UTR; Figure 2A).
Figure 2.
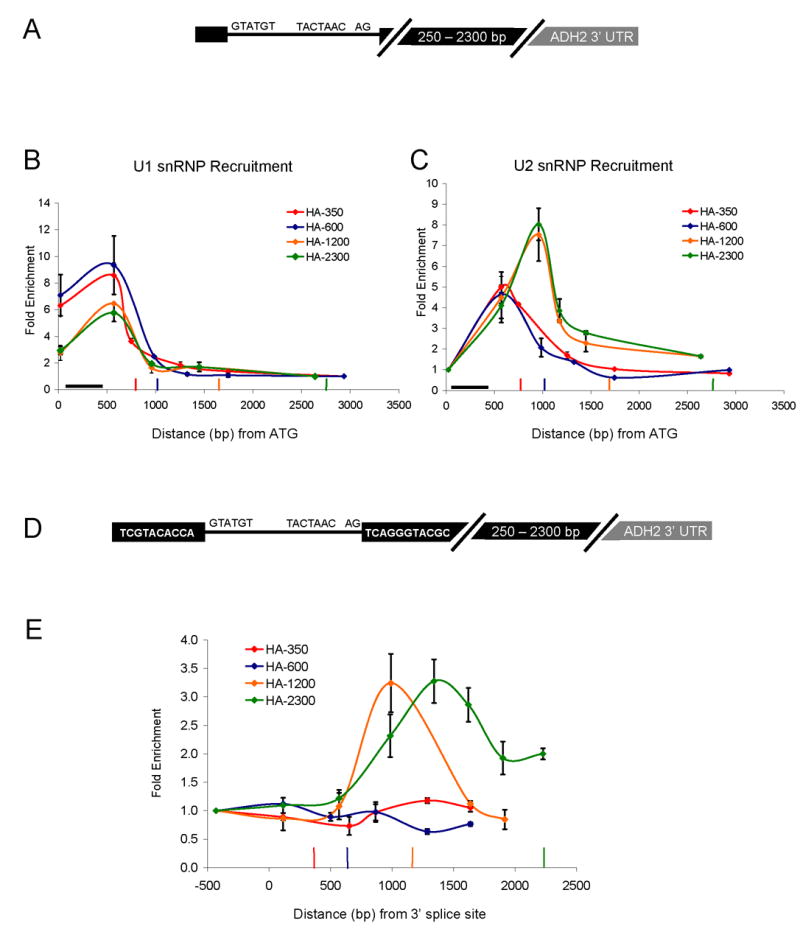
Second exon length determines extent of cotranscriptional spliceosome assembly and splicing. (A) Schematic of HZ18-ADH2 derivatives. Constructs differ only in second exon length. (B) U1 snRNP ChIPs to HZ18-ADH2 derivatives. Fold enrichment is expressed relative to the last primer pair. Black horizontal bar indicates intron position. Vertical colored bars indicate cleavage/polyadenylation signals for the corresponding colored HZ18-ADH2 construct. (C) U2 snRNP ChIPs to HZ18-ADH2 derivatives. Fold enrichment is expressed relative to the first primer pair. (D) Schematic of split MS2 HZ18-ADH2 derivatives. (E) MS2-HA ChIPs to split MS2 HZ18-ADH2 constructs. Fold enrichment is relative to first primer pair. Vertical colored bars indicate cleavage/polyadenylation signals for the corresponding colored split MS2 HZ18-ADH2 construct. X-axis is distance from the 3′ ss (rather than from ATG). All data represent the average of at least two independent experiments and error bars report average deviation.
The U1 snRNP recruitment results reflect those of ACT1 and RP51A, namely, higher U1 levels on HA-350 and HA-600, whereas HA-1200 and HA-2300 have lower levels (Figure 2B). Conversely, U2 snRNP levels are lower on HA-350 and HA-600 and higher on HA-1200 and HA-2300 (Figure 2C). This indicates that the short second exon genes have a limited capacity to recruit U2 snRNP/tri-snRNP and dislodge U1 cotranscriptionally. Moreover, this suggests that the differences between ACT1 and RP51A snRNP recruitment are principally due to exon length rather than gene-specific features. We interpret the earlier “peak” in U2 snRNP values (Figure 3C, HA-350 and HA-600) to reflect incomplete nascent snRNP recruitment due to premature cleavage and polyadenylation/transcription termination. Indeed, the values at the second primer pair prior to the polyA site of HA-350 and HA-600 are nearly identical for all four constructs.
Figure 3.

Post-transcriptional spliceosome assembly is not required for efficient splicing. (A) (Left panel) Primer extension analysis of HA-ADH2 reporter constructs. (Upper right panel) HA-ADH2 pre-mRNAs normalized to endogenous RP51B pre-mRNA. (Lower right panel) Percent pre-mRNA values from HA-ADH2 constructs. (B) U1 snRNP IPs to characterize HZ18-ADH2 pre-mRNA association. Pre-mRNA association is normalized to DBP2 pre-mRNA. Values were then set to 1.0 for GAL10, an intronless negative control. All data represent the average of at least two independent experiments and error bars report average deviation.
Based on the differences between U1/U2 levels, we suspected that splicing occurs cotranscriptionally on the two longer constructs but not on the two shorter constructs. To test this prediction, we imported into the four constructs a recently developed assay for cotranscriptional splicing (Abruzzi et al., 2004; Lacadie et al., 2006). In this ChIP-based system, an RNA stem loop that binds to the MS2 (fused to HA epitope) phage coat protein is split by an intron (called split MS2). Upon intron removal, the stem loop forms, binds the MS2 protein and thereby monitors cotranscriptional splicing by ChIP with an anti-HA antibody. Previous results showed significant splicing by ~1 kb past the 3′ ss of the HZ18 construct (Lacadie et al., 2006).
Consistent with the U snRNP recruitment patterns, there is no signal with the shorter two constructs, whereas robust, comparable splicing signals are observed with the longer two constructs (Figure 2E). These results suggest that splicing and therefore complete assembly requires more than 600 bp but less than 1.2 kb of second exon. The split MS2 ChIPs correlate with the U2 recruitment patterns (Figure 2C), suggesting that they are a reasonable surrogate for cotranscriptional splicing. This notion also fits with the observation that U2 and U5 recruitment patterns are generally very similar (Lacadie and Rosbash, 2005) and that the MS2 splicing pattern immediately follows the U2 and U5 patterns (Lacadie et al., 2006).
Co-/post-transcriptional splicing are equally efficient
If cotranscriptional U2/U5 recruitment is important for efficient splicing, the shorter constructs might have an increased pre-mRNA:mRNA ratio. An increase in pre-mRNA might also be due to release of U1 snRNP containing pre-mRNA by polyadenylation, even if post-transcriptional splicing is as efficient as cotranscriptional splicing. We therefore assayed steady-state RNA levels by primer extension and quantitative RT-PCR (Figure 3A).
All four constructs gave rise to indistinguishable pre-mRNA levels (Figure 3A, upper right panel). However, the two shorter constructs do show reproducibly higher mRNA levels than the two longer constructs (Figure 3A, lower right panel), which alters the pre-mRNA percentages. Given the cotranscriptional splicing results (Figure 2), this could indicate that the predominantly post-transcriptional splicing of these two constructs is more efficient than cotranscriptional splicing or that the smaller mRNAs could have longer cytoplasmic half-lives. In either case, the suggestion is that cotranscriptional U2/U5 recruitment and splicing do not increase splicing efficiency. This suggests that, like RP51A, the shorter exon pre-mRNAs are more associated with U1 post-transcriptionally (Figure 1C). The four pre-mRNAs were therefore assayed for post-transcriptional U1 association, and the data were normalized to endogenous DBP2 pre-mRNA to control for experimental variation.
As expected, a bias was found in favor of the shorter second exon constructs (Figure 3B, compare with 1C): HA-350 (3-fold) and HA-600 (2-fold) showed enhanced association of U1 snRNP with poly(A)+ pre-mRNA than HA-1200 or HA-2300 (Figure 3B). As an additional control, GAL10 mRNA (intronless) association with U1 snRNP was assayed in parallel and was approximately 10-fold lower than even the longest HZ18-ADH2 pre-mRNAs. Consistent with a post-transcriptional association of some ACT1 pre-mRNA with U1 snRNP (Figure 1C), there are significant levels of post-transcriptional U1-containing complexes even for HA-1200 and HA-2300. This is despite robust cotranscriptional U2 snRNP recruitment and splicing (see Discussion).
Tiling arrays show global U snRNP recruitment patterns
Whole-genome tiling arrays are a powerful method of mapping DNA binding protein sites (Mockler et al., 2005). More recently, this strategy has been used to map RNA binding protein locations (Swinburne et al., 2006). We therefore sought to complement our limited sample of cotranscriptional recruitment patterns and characterize U snRNP recruitment to most and perhaps all intron-containing genes. To this end, we performed ChIPs against U1, U2, and U5 snRNPs and analyzed immunoprecipitated DNAs on high-density oligonucleotide tiling arrays; these were printed with 50-mer probes at 32 bp spacing. This arrangement should also increase the resolution of U snRNP recruitment, at least to intron-containing genes that are transcribed at sufficiently high levels.
A representative view of chromosome 16 contains 4 annotated intron-containing genes and many intronless genes; U snRNP signals are strongly apparent on 3 of the 4 genes (Figure 4A). Examining the entire genome indicates that credible U snRNP signals are highly specific for intron-containing genes and reflect the lower resolution patterns previously observed for ACT1 and RP51A (compare Figures 1A and 1B with Figures 5A and 5E). ~98% of ribosomal protein intron-containing genes were enriched for U snRNPs (99 of 101), whereas only ~25% of non-ribosomal protein intron-containing genes were enriched for U snRNPs (34 of 138). This difference is likely due to the high transcription rates of ribosomal protein genes (Warner, 1999).
Figure 4.
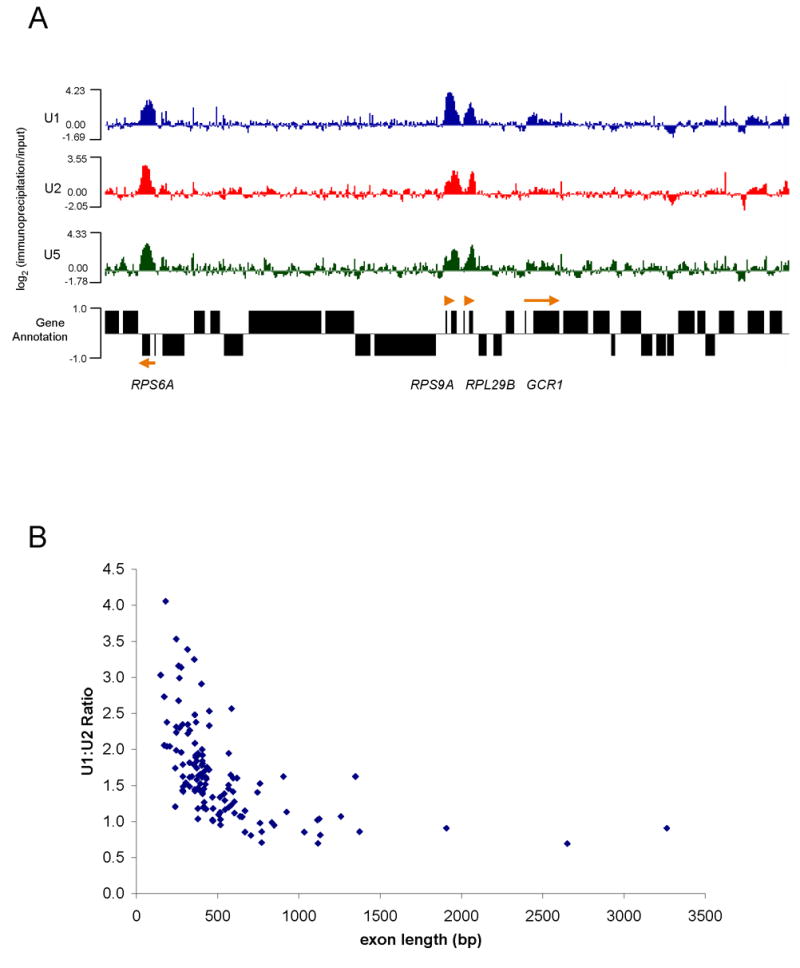
Whole-genome ChIP-CHIP shows global recruitment of U snRNPs. (A) A representative view (chromosome 16) of U1, U2, and U5 ChIP-CHIPs hybridized to whole-genome tiling arrays printed with 50-mer probes at 32 bp spacing. Values are expressed as log2 of immunoprecipitation/input ratios. Annotated genes from Saccharomyces Genome Database are shown. Four intron-containing genes are located within the displayed region (orange arrows; point in direction of transcription). (B) U1:U2 ratios as a function of second exon length are shown for genes showing significant enrichment of U snRNPs (~130 genes). Ratios were calculated from the peak value from U1 and U2 IPs.
Figure 5.
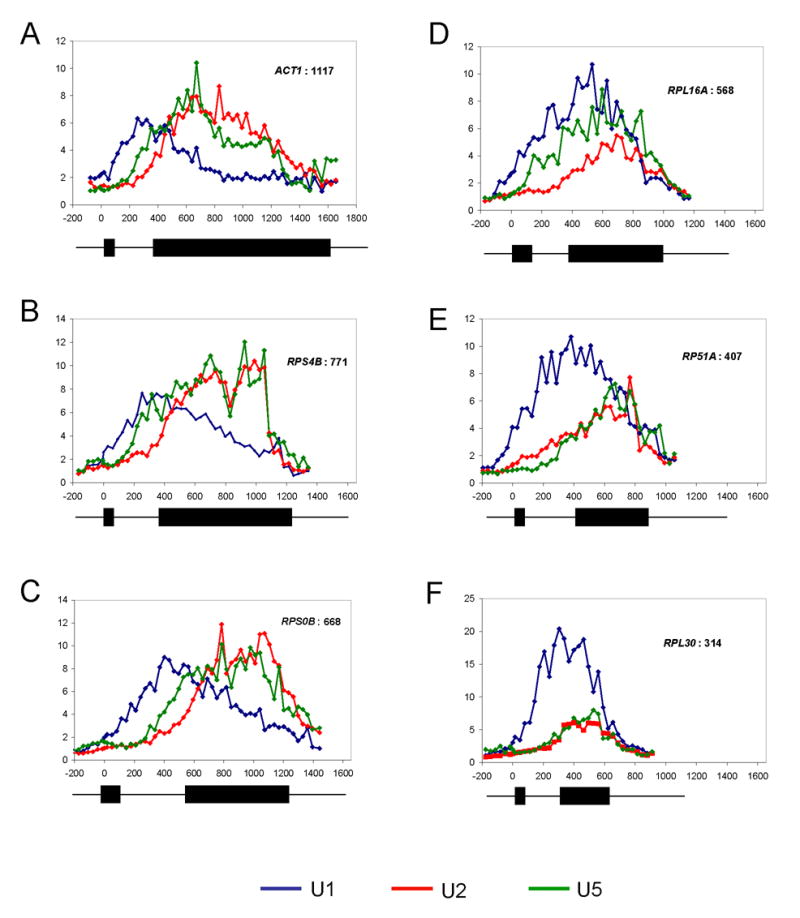
Progressive spliceosome assembly. (A–F) U1, U2, and U5 snRNP ChIP-CHIPs from whole-genome tiling arrays are shown for six representative genes. Fold enrichment is expressed relative to intergenic background. U1 is blue, U2 red, and U5 is green. Gene schematics are shown below each gene. All scales (distance from ATG) are the same. (A) ACT1, 1117 bp exon (B) RPS4B, 771 bp (C) RPS0B, 668 bp (D) RPL16A, 568 bp (E) RP51A, 407 bp (F) RPL30, 314 bp.
To generalize the relationship between U1:U2 ratios and second exon lengths (Figures 1 and 2), we calculated the U1:U2 ratio for all 133 intron-containing genes that gave significant signal (Figure 4B). Consistent with the reporter constructs and the ChIP data on ACT1 and RP51A (Figures 1 and 2), shorter second genes have a higher U1:U2 ratio. This relationship is strongly exon length dependent and independent of known intron features, such as intron length and consensus splicing sequences (data not shown). We find this relationship quite remarkable, considering the diversity in intron sequence and structure.
Although these ratios provide a rough indication of spliceosome progression, we exploited the high resolution to more closely examine spliceosome assembly patterns. To this end, we compared U1, U2, and U5 snRNP recruitment patterns of representative genes as a function of second exon length (Figure 5A to 5F). There are three main patterns. (1) As exemplified by ACT1 (long 2nd exon), there are separate U1 and U2/U5 peaks with a gradual decrease of U1 followed by a subsequent gradual decrease of U2/U5 (Figure 5A). This is similar to the previously published ChIP patterns (Lacadie and Rosbash, 2005). (2) RPS4B and RPS0B also have separate U1 and U2/U5 peaks; however, U2/U5 decreased more abruptly at the 3′ end of the ORFs (Figure 5B and 5C). (3) RPL16A, RP51A, and RPL30 have less distinct U1 and U2/U5 peaks, and both U1 and U2/U5 decrease simultaneously at the 3′ end of the ORF (rather than first U1 and then U2/U5) (Figure 5D–F). These patterns are consistent with cotranscriptional splicing (5A), robust recruitment of late spliceosomal complexes but transcript release because of cleavage/termination before complete cotranscriptional splicing (5B–C), and incomplete U2/U5 recruitment with release of both U1 and U2/U5 complexes because of cleavage/termination (5D–F). These data are in good agreement with those of Neugebauer and colleagues (Kotovic et al., 2003), who assayed U1 recruitment with ChIP-CHIP and conventional microarrays. Long second exon genes were less enriched, presumably because the microarray probes are biased against the 5′ ends of genes.
The genes with patterns (2) and (3) are the likely principal source of post-transcriptional splicing complexes containing U1 snRNP and CBC, the nuclear cap-binding complex. Indeed, CBC associates more highly with U1 snRNP than with the other four splicing snRNPs: U2, U4, U5, and U6. Moreover, proteomic analysis of tagged Cbp20p complexes indicates that U1 snRNP is the most abundant CBC-associated snRNP. As the CBC-U1 snRNP association is transcription-dependent (Figure S2; see Discussion), it suggests that these complexes are bridged by pre-mRNA and are in vivo commitment complexes.
Cotranscriptional U1 snRNP recruitment increases splicing efficiency
Our current results indicate that U1 snRNP is robustly recruited to all intron-containing yeast genes. This is because maximal U1 recruitment occurs near the 3′ ss and is independent of second exon length. Moreover, numerous experiments indicate that U1 snRNP is important for subsequent U2 and U5 cotranscriptional recruitment. However, the importance of cotranscriptional versus post-transcriptional U1 recruitment is unknown. To address this issue, we employed a recursive splicing assay first described by the Séraphin group (Lopez and Seraphin, 2001). In the experimental design, a first intron is imbedded within the 5′ splice site of a second intron. The first intron must be accurately removed to unmask the 5′ ss of the second intron, which is subsequently spliced. Lopez and Séraphin (2001) observed no detectable deficit in splicing efficiency (by β-galactosidase activity) when an intron was imbedded within the 5′ ss, suggesting that transcription and splicing are not tightly coupled. Because the LacZ open reading frame is long, we generated four recursive constructs with decreasing second exon lengths; all have the ACT1 intron interrupting the 5′ ss of the RP51A intron (Figure 6A).
Figure 6.
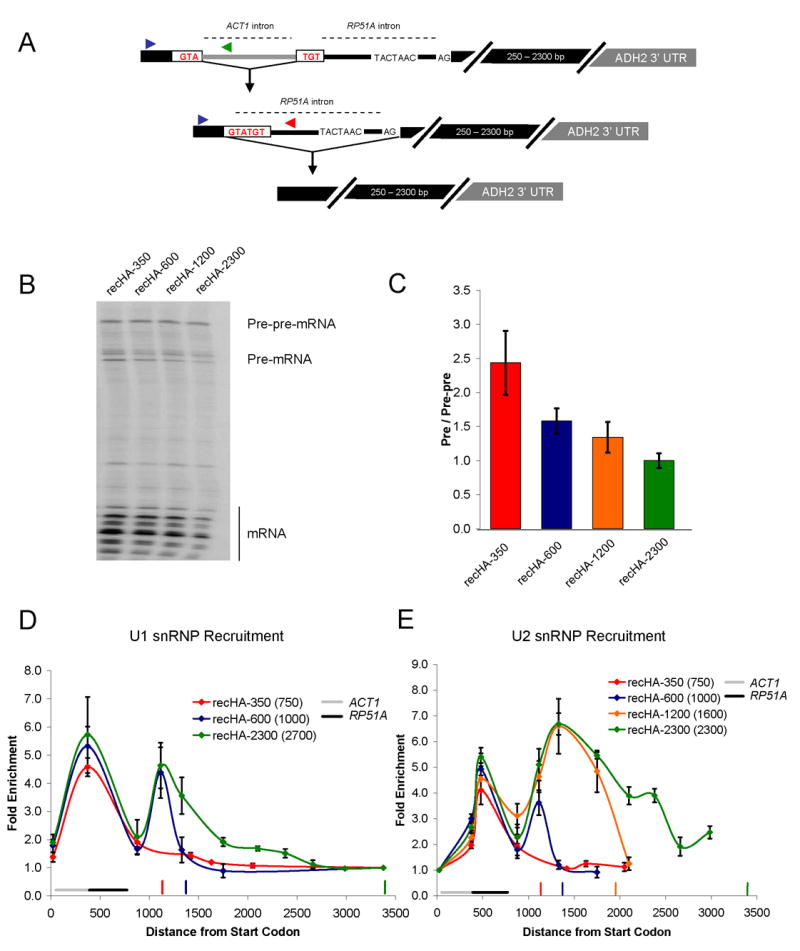
Cotranscriptional U1 snRNP recruitment enhances splicing efficiency. (A) Schematic of recursive splicing construct. The ACT1 intron interrupts the 5′ ss of RP51A and must be removed prior to RP51A intron splicing. (B) Primer extension analysis of recursive splicing constructs. (C) Quantitative RT-PCR of recursive splicing constructs (shown in B). Primer pairs specific to the pre-pre-mRNA and pre-mRNA were used to generate a pre-mRNA to pre-pre-mRNA ratio. Location of these primers is shown in (A). The same forward primer (blue arrow) was used to analyze both pre-pre-mRNA (reverse primer; green arrow) and pre-mRNA (reverse primer; red arrow). These were normalized to recHA-2300, which was set to 1.0. (D) U1 snRNP recruitment to recursive constructs. Fold enrichment is relative to the last primer pair. Location of ACT1 and RP51A introns is noted. Vertical colored bars indicate cleavage/polyadenylation sites of the corresponding recursive construct. In the legend, the numbers in parentheses are the second exon lengths for the ACT1 intron (these include the RP51A intron as part of the “exon”). Note that recHA-1200 data was omitted from this figure to prevent too many recruitment curves from obscuring the main point. U1 and U2 recruitment to recHA-1200 is essentially the same as HA-2300 (data not shown). (E) U2 snRNP recruitment to recursive constructs. Fold enrichment is relative to the first primer pair. All data represent the average of at least two independent experiments and error bars report average deviation.
Based on our knowledge of splicing kinetics and U snRNP recruitment, we surmised that U1 snRNP recruitment to the smallest masked 5′ss (recHA-350; note that the true second exon size includes the RP51A intron and is ~750 nt) might be substantially post-transcriptional. If there is any positive influence of cotranscriptional U1 recruitment on splicing, this construct might then accumulate pre-mRNA (ACT1 intron removed) relative to pre-pre-mRNA (completely unspliced); the latter should be similar for all four constructs. Indeed, pre-pre-mRNA levels are indistinguishable between the four constructs, by primer extension (Figure 6B) and quantitative PCR (Figure 6C). However, there is a roughly 2.5-fold increase in the pre-mRNA to pre-pre-mRNA ratio for recHA-350 as compared to recHA-2300 (Figure 6C).
Does this pre-mRNA increase correlate with altered spliceosome assembly? Interestingly, both splicing events are evident by the snRNP ChIP assays. All four constructs have a similar U1 signal (both level and location), indicative of the first 5′ss/recruitment event (Figure 6D). However, the second U1 recruitment event is less uniform; the smallest second exon construct (recHA-350) shows no cotranscriptional U1 recruitment to the unmasked 5′ss. We surmise that 750 bp is insufficient distance/time to remove the first intron and recruit U1 snRNP to the unmasked 5′ ss. However, recHA-600 shows maximal U1 recruitment, indicating that 1000 bp is enough distance/time to splice and recruit maximal U1 with this particular construct. Note that cotranscriptional recruitment of U1 snRNP to the masked intron is an assay for cotranscriptional splicing of the first intron.
For U2 snRNP recruitment to the first intron, all four constructs follow the U1 pattern and have similar U2 snRNP recruitment signals and patterns (Figure 6E). For the second splicing event, U2 snRNP recruitment is also similar to the U1 patterns to this intron, namely, high U2 levels on recHA-1200 and recHA-2300, partial U2 recruitment to recHA-600, and no U2 recruitment to recHA-350 (Figure 6E). The data suggest that the decreased splicing efficiency of recHA-350 is due to the lack of efficient cotranscriptional U1 snRNP recruitment to the unmasked intron. In contrast, the reduced cotranscriptional U2 snRNP recruitment to recHA-600 does not result in a large decrease in splicing efficiency. Cotranscriptional U1 snRNP recruitment may commit the intron to efficient post-transcriptional splicing factor recruitment and splicing.
DISCUSSION
Recent work shows that cotranscriptional spliceosome assembly and splicing occur in yeast (Gornemann et al., 2005; Kotovic et al., 2003; Lacadie and Rosbash, 2005; Lacadie et al., 2006). However, these analyses used a limited set of endogenous genes and reporter constructs; all have relatively long second exons (>1 kb). Here we present a more complete view of cotranscriptional spliceosome assembly by combining ChIP analyses with whole-genome tiling arrays. U1 snRNP recruitment is independent of second exon length and makes a contribution to splicing efficiency. U2 and U5 snRNP recruitment, in contrast, is dependent on exon length. As a consequence, genes with short second exons undergo predominantly post-transcriptional splicing, which occurs efficiently.
How much yeast splicing then takes place cotranscriptionally? The U snRNP and split MS2 ChIPs indicate that splicing begins when Pol II is beyond 600 bp past the 3′ ss and that maximal cotranscriptional splicing requires ~1 kb past the 3′ ss (Figure 2). Assuming an average transcription rate of ~1.5 kb/min and that cotranscriptional splicing is complete on HA-1200, spliceosome assembly and splicing occurs within ~1 minute of transcribing the 3′ ss. This estimate is similar to that of Neugebauer and colleagues, which is based on the ChIP recruitment of Prp19p, a spliceosome activation complex component (Gornemann et al., 2005). One minute is marginally faster than previously observed in metazoans (1) by electron microscopy of early Drosophila embryo genes, in which splicing occurs ~3 min after transcription of the 3′ ss; (Beyer and Osheim, 1988) (2) from β-globin transcripts in a cell culture system (Audibert et al., 2002), or (3) from an analysis of C. tentans (Kiseleva et al., 1994; Wetterberg et al., 2001). Nonetheless, we do not know exactly what fraction of splicing on long second exon genes is cotranscriptional. As we observe some post-transcriptional U1 snRNP association of these pre-mRNAs (Figure 2 and 3B), a fraction of all nascent pre-mRNAs probably fails even to undergo cotranscriptional U1 snRNP recruitment and then engages the entire splicing machinery post-transcriptionally. We suspect, however, that most splicing on a long second exon gene is cotranscriptional. Evidence for this includes comparable ChIP signal from a 5′ UTR-located MS2 stem loop and the split MS2 stem loop (Lacadie et al., 2006; data not shown).
In contrast, most splicing on short second exon genes is apparently post-transcriptional. The abrupt decreases in U2/U5 signal at the end of smaller ORFs (Figure 5) indicate that 3′ UTRs are short and do not substantially impact this conclusion. This is also consistent with recent tiling array results (David et al., 2006). The abrupt decreases also suggest relatively little cotranscriptional splicing of these genes - such as RPS4B (771 bp, Figure 5B) and RPS0B (668 bp, Figure 5C). By incorporating transcription rate data (Figure S1B), we conservatively predict that ~90% of yeast splicing is post-transcriptional (700 bp cut off). If patterns such as RPS4B reflect full assembly without splicing, the estimate rises to ~98% (800 bp cut off)
Several groups have reported associations of splicing factors with RNA Pol II in higher eukaryotes (for reviews, see Bentley, 2005; Kornblihtt et al., 2004). Moreover, the mammalian CTD is required for efficient splicing of all genes tested (Fong and Bentley, 2001; McCracken et al., 1997) and contributes to alternative splicing regulation (de la Mata and Kornblihtt, 2006). Nonetheless, it is uncertain whether yeast RNA Pol II contributes directly to splicing factor recruitment. It may be relevant that the yeast CTD contains roughly half the number of heptad repeats of mammalian CTD and seems to be dispensable for splicing (Licatalosi et al., 2002). There is one report that yeast Prp40p, a U1 snRNP component, associates with the CTD (Morris and Greenleaf, 2000; Phatnani et al., 2004). However, another group failed to confirm this observation through a different experimental approach (Wiesner et al., 2002). A recent mammalian study identified an important association between mammalian 3′ end formation factors and U2 snRNP (Kyburz et al., 2006). Perhaps a similar relationship in yeast promotes faster assembly than would occur otherwise. However, all data to date are consistent with simple kinetic competition between yeast splicing and 3′ end formation; if there is not enough time/distance, cotranscriptional assembly and splicing will not occur. The is based in part on the lack of robust U2 snRNP recruitment by genes with short second exons, which suggests a lack of robust coupling between Pol II and U2/tri-snRNP recruitment. The recruitment data include the tiling arrays (Figure 4), which show a coherent spliceosome assembly picture independent of intron features (e.g., size and structure). Finally, the recursive splicing experiments of Lopez and Séraphin (2001) also suggest that transcription and splicing are not tightly coupled.
Use of this recursive splicing strategy does provide insight into a potential contribution of cotranscriptional U1 snRNP recruitment to splicing efficiency (Figure 6). In the recursive splicing of the recHA-350 construct, substantial U1 recruitment appears to be pushed post-transcriptionally; this may contribute to less efficient splicing. This is in contrast to the longest construct, recHA-2300, in which assembly and splicing of the second intron occurs cotranscriptionally and more efficiently. However, the (second) pre-mRNA substrate is considerably different than a canonical nascent pre-mRNA. For example, the 5′ ss “appears” much later than usual; in fact, the branch point is probably available before the 5′ ss. As we previously showed that the branch point alone can recruit U1 snRNP (Lacadie and Rosbash, 2005; Lacadie et al., 2006), it is possible that the second branch point (of RP51A) helps recruit U1 to the second intron. This consideration suggests that the two-fold decrease in splicing efficiency may be an underestimate of the post-transcriptional versus cotranscriptional splicing efficiency ratio. In any case, we suggest that the recursive 5′ ss of recHA-350 experiences less than optimal splicing, possibly because of enhanced competition from RNA binding proteins away from the site of transcription. Relevant to this idea are recent experiments showing that nonspecific RNP complexes reduce spliceosome formation efficiency on pre-mRNAs not coupled to transcription (Das et al., 2006).
Given the paucity of known direct transcription-splicing contacts in yeast, cotranscriptional splicing events may benefit from more indirect interactions. For example, recent experiments suggest that TFIIS promotes cotranscriptional splicing without directly recruiting splicing factors (Lacadie et al., 2006). Another possibility is a higher local U1 snRNP concentration near active chromatin. As recent in vitro coupled transcription-splicing experiments suggest competition between splicing and degradation by nucleases (Hicks et al., 2006), coupling between U1 recruitment and transcription may help avoid degradation pathways. Interestingly, transcription-dependent CBC-U1 complexes are highly abundant and stable in vivo (Figure S2). Pre-mRNAs bridging these in vivo commitment complexes are most likely derived from short second exon genes (Figure 1C and 3B).
Pre-mRNA microarray experiments show that introns are not all affected similarly by the same mutant, e.g., ts splicing factors (Burckin et al., 2005; Clark et al., 2002). Whole genome-tiling ChIP-CHIPs from various splicing mutant strains should be able to complement these observations, particularly from mutants that probably affect early assembly steps. For example, some differences between intron-containing genes may result from splicing factors focused on post-transcriptional events. In higher eukaryotes as well, tiling arrays would significantly increase our understanding of alternative splicing as well as the binding and regulatory sites of various splicing factors. Indeed, recent ChIP experiments with mammalian splicing factors (Listerman et al., 2006) reinforce this optimism and suggest that the same tiling approach taken here with yeast should be applicable to metazoans.
EXPERIMENTAL PROCEDURES
Yeast Strains and Growth Conditions
Yeast strains were manipulated according to standard procedures (Guthrie and Fink, 1991). Cultures were maintained in 2% galactose 0.05% glucose for all experiments with HZ18 derivatives. For ChIP-CHIP experiments, cells were grown in 2% glucose. TAP-tagged strains were obtained from Open Biosystems.
Plasmids
Construction of HZ18 derivatives with varying second exon lengths was achieved by either Quick change PCR or standard cloning. For Quick change, oligos were designed to amplify ADH2 3′ UTR and poly(A) site as defined previously (Hyman et al., 1991). 2.5 μg of this PCR product (~300 base pairs of ADH2 with 40 bases upstream and downstream for HZ18 targeting) was then used as a primer for quick change according to manufacturer’s protocol (Stratagene). For standard cloning, the same ADH2 sequence was PCR amplified with oligos containing either ClaI or SacI sites. Digested PCR products were then cloned into ClaI or SacI sites in HZ18 using standard methods. Split MS2 constructs were generated by cloning a BamHI/AclI digested PCR product amplified from the split MS2 vector into BamHI/AclI sites in the HZ18-ADH2 derivatives. Recursive constructs were generated by quick change PCR. The ACT1 intron was PCR amplified with oligos containing RP51A sequence splitting the 5′ ss. The PCR product was then used as a primer for quick change and reaction were performed as described above. Plasmids and strains can be found in Supplemental Table 1. Oligos used for Quick change and cloning are located in Supplemental Table 2.
Chromatin Immunoprecipitation
Chromatin Immunoprecipitations and quantitative PCR were performed as previously described (Komarnitsky et al., 2000; Lacadie and Rosbash, 2005). Real time PCRs were performed on a Rotor-Gene 3000 PCR machine (Corbett Research). ACT1 ChIP signals are expressed as the IP to input ratio for ACT1 over the IP to input ratio for the intronless PMA1 gene. Reported ACT1/PMA1 values are the averages of three independent experiments and error bars represent average deviation. For ChIPs to HZ18-ADH2 constructs, U1 snRNP IPs are normalized to the last primer pair and U2 snRNP IPs are normalized to the first primer pair. Split MS2 ChIPs are normalized to the first primer pair. All data represent the average of at least two independent experiments and error bars report average deviation. Sequences of oligos used in this study can be found in Supplemental Table 2.
U snRNP Immunoprecipitations
U1 snRNP IPs for detecting post-transcriptional pre-mRNA association were performed as described (Tardiff and Rosbash, 2006). Input and IP RNAs were phenol:chloroform extracted, ethanol precipitated, and cDNA made by oligo dT-primed reverse transcription according to manufacturer’s protocol (Invitrogen). For U1 snRNP IPs of RP51A, ACT1, and the HZ18-ADH2 constructs, pre-mRNA IP:IN ratios were normalized to DBP2 pre-mRNA IP:IN ratios as a positive control and then set to 1.0 for an intronless mRNA negative control. All data represent the average of at least two independent experiments and error bars report average deviation.
Genomic U snRNP Profiling (ChIP-CHIP)
Tiling ChIP-CHIP was performed by NimbleGen Systems, Inc as part of a ChIP Array Service (http://www.nimblegen.com). ChIP was performed as described above. The input (~20 ng) and the IP were amplified by LM-PCR as previously described (Ren et al., 2000). Input (4 μg) and IP (4 μg) of LM-PCR product ranging from 200 to 600 nucleotides was provided. Input (Cy3-labeled) and IP (Cy5-labeled) were hybridized on S. cerevisiae whole-genome tiling arrays with 50-mer probes at 32 bp spacing. For each hybridization, NimbleGen Systems returned raw data signal intensities for specific IP and input DNA, plus a log2 ratio of the IP to input signals. Signals for intron-containing genes were considered if U1, U2, and U5 signals were at least 2-fold over background and showed separable U1 from U2/U5 peaks.
Recursive Splicing Assay
RNA was purified from yeast strains harboring recursive constructs by hot acid phenol extraction (Ausubel et al., 1994). Total RNA (2 μg) was treated with DNase and extended with RB1 (Pikielny and Rosbash, 1986) using Superscript III reverse transcriptase (Invitrogen). Quantitative PCR was then performed with oligos specific to each pre-mRNA. Reported values are the average of three independent experiments and error bars represent average deviation.
Supplementary Material
Acknowledgments
We thank our local colleagues, especially K. Abruzzi and S. Kadener, as well as K Neugebauer for suggestions and comments on the manuscript. Thanks also to B. Séraphin, B. Graveley, and A. Berglund for helpful discussions. This work was supported in part by a grant to M.R. from the National Institutes of Health (NIH) (R01 GM23549) and the NIH Genetics Training Grant (5T32 GM07122).
Footnotes
Publisher's Disclaimer: This is a PDF file of an unedited manuscript that has been accepted for publication. As a service to our customers we are providing this early version of the manuscript. The manuscript will undergo copyediting, typesetting, and review of the resulting proof before it is published in its final citable form. Please note that during the production process errors may be discovered which could affect the content, and all legal disclaimers that apply to the journal pertain.
References
- Abruzzi KC, Lacadie S, Rosbash M. Biochemical analysis of TREX complex recruitment to intronless and intron-containing yeast genes. EMBO J. 2004;23:2620–2631. doi: 10.1038/sj.emboj.7600261. [DOI] [PMC free article] [PubMed] [Google Scholar]
- Ares M, Jr, Grate L, Pauling MH. A handful of intron-containing genes produces the lion’s share of yeast mRNA. RNA. 1999;5:1138–1139. doi: 10.1017/s1355838299991379. [DOI] [PMC free article] [PubMed] [Google Scholar]
- Audibert A, Weil D, Dautry F. In vivo kinetics of mRNA splicing and transport in mammalian cells. Mol Cell Biol. 2002;22:6706–6718. doi: 10.1128/MCB.22.19.6706-6718.2002. [DOI] [PMC free article] [PubMed] [Google Scholar]
- Ausubel FM, Brent R, Kingston RE, Moore DD, Seidman JG, Smith JA, Struhl K. Current protocols in molecular biology. 2. Greene Publishing Associates; 1994. [Google Scholar]
- Behzadnia N, Hartmuth K, Will CL, Luhrmann R. Functional spliceosomal A complexes can be assembled in vitro in the absence of a penta-snRNP. RNA. 2006;12:1738–1746. doi: 10.1261/rna.120606. [DOI] [PMC free article] [PubMed] [Google Scholar]
- Bentley DL. Rules of engagement: co-transcriptional recruitment of pre-mRNA processing factors. Curr Opin Cell Biol. 2005;17:251–256. doi: 10.1016/j.ceb.2005.04.006. [DOI] [PubMed] [Google Scholar]
- Beyer AL, Osheim YN. Splice site selection, rate of splicing, and alternative splicing on nascent transcripts. Genes Dev. 1988;2:754–765. doi: 10.1101/gad.2.6.754. [DOI] [PubMed] [Google Scholar]
- Brow DA. Allosteric cascade of spliceosome activation. Annu Rev Genet. 2002;36:333–360. doi: 10.1146/annurev.genet.36.043002.091635. [DOI] [PubMed] [Google Scholar]
- Burckin T, Nagel R, Mandel-Gutfreund Y, Shiue L, Clark TA, Chong JL, Chang TH, Squazzo S, Hartzog G, Ares M., Jr Exploring functional relationships between components of the gene expression machinery. Nat Struct Mol Biol. 2005;12:175–182. doi: 10.1038/nsmb891. [DOI] [PubMed] [Google Scholar]
- Burge CB, Tuschl T, Sharp PA. Splicing of precursors to mRNAs by the spliceosome. In: Gesteland RR, Cech TR, Atkins JF, editors. The RNA World II. Cold Spring Harbor: Cold Spring Harbor Press; 1999. pp. 525–560. [Google Scholar]
- Clark TA, Sugnet CW, Ares M., Jr Genomewide analysis of mRNA processing in yeast using splicing-specific microarrays. Science. 2002;296:907–910. doi: 10.1126/science.1069415. [DOI] [PubMed] [Google Scholar]
- Cramer P, Caceres JF, Cazalla D, Kadener S, Muro AF, Baralle FE, Kornblihtt AR. Coupling of transcription with alternative splicing: RNA pol II promoters modulate SF2/ASF and 9G8 effects on an exonic splicing enhancer. Mol Cell. 1999;4:251–258. doi: 10.1016/s1097-2765(00)80372-x. [DOI] [PubMed] [Google Scholar]
- Das R, Dufu K, Romney B, Feldt M, Elenko M, Reed R. Functional coupling of RNAP II transcription to spliceosome assembly. Genes Dev. 2006;20:1100–1109. doi: 10.1101/gad.1397406. [DOI] [PMC free article] [PubMed] [Google Scholar]
- David L, Huber W, Granovskaia M, Toedling J, Palm CJ, Bofkin L, Jones T, Davis RW, Steinmetz LM. A high-resolution map of transcription in the yeast genome. Proc Natl Acad Sci U S A. 2006;103:5320–5325. doi: 10.1073/pnas.0601091103. [DOI] [PMC free article] [PubMed] [Google Scholar]
- de la Mata M, Kornblihtt AR. RNA polymerase II C-terminal domain mediates regulation of alternative splicing by SRp20. Nat Struct Mol Biol. 2006 doi: 10.1038/nsmb1155. [DOI] [PubMed] [Google Scholar]
- Fong N, Bentley DL. Capping, splicing, and 3′ processing are independently stimulated by RNA polymerase II: different functions for different segments of the CTD. Genes Dev. 2001;15:1783–1795. doi: 10.1101/gad.889101. [DOI] [PMC free article] [PubMed] [Google Scholar]
- Furger A, O’Sullivan JM, Binnie A, Lee BA, Proudfoot NJ. Promoter proximal splice sites enhance transcription. Genes Dev. 2002;16:2792–2799. doi: 10.1101/gad.983602. [DOI] [PMC free article] [PubMed] [Google Scholar]
- Ghosh S, Garcia-Blanco MA. Coupled in vitro synthesis and splicing of RNA polymerase II transcripts. RNA. 2000;6:1325–1334. doi: 10.1017/s1355838200992537. [DOI] [PMC free article] [PubMed] [Google Scholar]
- Goguel V, Rosbash M. Splice site choice and splicing efficiency are positively influenced by intramolecular base-pairing in yeast. Cell. 1993;72:893–901. doi: 10.1016/0092-8674(93)90578-e. [DOI] [PubMed] [Google Scholar]
- Gornemann J, Kotovic KM, Hujer K, Neugebauer KM. Cotranscriptional spliceosome assembly occurs in a stepwise fashion and requires the cap binding complex. Mol Cell. 2005;19:53–63. doi: 10.1016/j.molcel.2005.05.007. [DOI] [PubMed] [Google Scholar]
- Guthrie C, Fink GR. Guide to yeast genetics and molecular biology. Meth Enzymol. 1991;194:389–398. [PubMed] [Google Scholar]
- Hicks MJ, Yang CR, Kotlajich MV, Hertel KJ. Linking splicing to Pol II transcription stabilizes pre-mRNAs and influences splicing patterns. PLoS Biol. 2006;4:e147. doi: 10.1371/journal.pbio.0040147. [DOI] [PMC free article] [PubMed] [Google Scholar]
- Holstege FC, Jennings EG, Wyrick JJ, Lee TI, Hengartner CJ, Green MR, Golub TR, Lander ES, Young RA. Dissecting the regulatory circuitry of a eukaryotic genome. Cell. 1998;95:717–728. doi: 10.1016/s0092-8674(00)81641-4. [DOI] [PubMed] [Google Scholar]
- Howe KJ, Kane CM, Ares M., Jr Perturbation of transcription elongation influences the fidelity of internal exon inclusion in Saccharomyces cerevisiae. RNA. 2003;9:993–1006. doi: 10.1261/rna.5390803. [DOI] [PMC free article] [PubMed] [Google Scholar]
- Hyman LE, Seiler SH, Whoriskey J, Moore CL. Point mutations upstream of the yeast ADH2 poly(A) site significantly reduce the efficiency of 3′-end formation. Mol Cell Biol. 1991;11:2004–2012. doi: 10.1128/mcb.11.4.2004. [DOI] [PMC free article] [PubMed] [Google Scholar]
- Juneau K, Miranda M, Hillenmeyer ME, Nislow C, Davis RW. Introns regulate RNA and protein abundance in yeast. Genetics. 2006;174:511–518. doi: 10.1534/genetics.106.058560. [DOI] [PMC free article] [PubMed] [Google Scholar]
- Jurica MS, Moore MJ. Pre-mRNA splicing: awash in a sea of proteins. Mol Cell. 2003;12:5–14. doi: 10.1016/s1097-2765(03)00270-3. [DOI] [PubMed] [Google Scholar]
- Kadener S, Cramer P, Nogues G, Cazalla D, de la Mata M, Fededa JP, Werbajh SE, Srebrow A, Kornblihtt AR. Antagonistic effects of T-Ag and VP16 reveal a role for RNA pol II elongation on alternative splicing. EMBO J. 2001;20:5759–5768. doi: 10.1093/emboj/20.20.5759. [DOI] [PMC free article] [PubMed] [Google Scholar]
- Kadener S, Fededa JP, Rosbash M, Kornblihtt AR. Regulation of alternative splicing by a transcriptional enhancer through RNA pol II elongation. Proc Natl Acad Sci U S A. 2002;99:8185–8190. doi: 10.1073/pnas.122246099. [DOI] [PMC free article] [PubMed] [Google Scholar]
- Kiseleva E, Wurtz T, Visa N, Daneholt B. Assembly and disassembly of spliceosomes along a specific pre-messenger RNP fiber. EMBO J. 1994;13:6052–6061. doi: 10.1002/j.1460-2075.1994.tb06952.x. [DOI] [PMC free article] [PubMed] [Google Scholar]
- Komarnitsky P, Cho EJ, Buratowski S. Different phosphorylated forms of RNA polymerase II and associated mRNA processing factors during transcription. Genes Dev. 2000;14:2452–2460. doi: 10.1101/gad.824700. [DOI] [PMC free article] [PubMed] [Google Scholar]
- Kornblihtt AR, de la Mata M, Fededa JP, Munoz MJ, Nogues G. Multiple links between transcription and splicing. RNA. 2004;10:1489–1498. doi: 10.1261/rna.7100104. [DOI] [PMC free article] [PubMed] [Google Scholar]
- Kotovic KM, Lockshon D, Boric L, Neugebauer KM. Cotranscriptional recruitment of the U1 snRNP to intron-containing genes in yeast. Mol Cell Biol. 2003;23:5768–5779. doi: 10.1128/MCB.23.16.5768-5779.2003. [DOI] [PMC free article] [PubMed] [Google Scholar]
- Kyburz A, Friedlein A, Langen H, Keller W. Direct interactions between subunits of CPSF and the U2 snRNP contribute to the coupling of pre-mRNA 3′ end processing and splicing. Mol Cell. 2006;23:195–205. doi: 10.1016/j.molcel.2006.05.037. [DOI] [PubMed] [Google Scholar]
- Lacadie SA, Rosbash M. Cotranscriptional spliceosome assembly dynamics and the role of U1 snRNA:5′ss base pairing in yeast. Mol Cell. 2005;19:65–75. doi: 10.1016/j.molcel.2005.05.006. [DOI] [PubMed] [Google Scholar]
- Lacadie SA, Tardiff DF, Kadener S, Rosbash M. In vivo commitment to yeast cotranscriptional splicing is sensitive to transcription elongation mutants. Genes Dev. 2006;20:2055–2066. doi: 10.1101/gad.1434706. [DOI] [PMC free article] [PubMed] [Google Scholar]
- Licatalosi DD, Geiger G, Minet M, Schroeder S, Cilli K, McNeil JB, Bentley DL. Functional interaction of yeast pre-mRNA 3′ end processing factors with RNA polymerase II. Mol Cell. 2002;9:1101–1111. doi: 10.1016/s1097-2765(02)00518-x. [DOI] [PubMed] [Google Scholar]
- Listerman I, Sapra AK, Neugebauer KM. Cotranscriptional coupling of splicing factor recruitment and precursor messenger RNA splicing in mammalian cells. Nat Struct Mol Biol. 2006;13:815–822. doi: 10.1038/nsmb1135. [DOI] [PubMed] [Google Scholar]
- Lopez PL, Seraphin B. Uncoupling yeast intron recognition from transcription with recursive splicing. EMBO Reports. 2001;1:1–6. doi: 10.1093/embo-reports/kvd065. [DOI] [PMC free article] [PubMed] [Google Scholar]
- Maniatis T, Reed R. An extensive network of coupling among gene expression machines. Nature. 2002;416:499–506. doi: 10.1038/416499a. [DOI] [PubMed] [Google Scholar]
- McCracken S, Fong N, Yankulov K, Ballantyne S, Pan G, Greenblatt J, Patterson SD, Wickens M, Bentley DL. The C-terminal domain of RNA polymerase II couples mRNA processing to transcription. Nature. 1997;385:357–361. doi: 10.1038/385357a0. [DOI] [PubMed] [Google Scholar]
- Mockler TC, Chan S, Sundaresan A, Chen H, Jacobsen SE, Ecker JR. Applications of DNA tiling arrays for whole-genome analysis. Genomics. 2005;85:1–15. doi: 10.1016/j.ygeno.2004.10.005. [DOI] [PubMed] [Google Scholar]
- Morris DP, Greenleaf AL. The splicing factor, Prp40, binds the phosphorylated carboxyl-terminal domain of RNA polymerase II. J Biol Chem. 2000;275:39935–39943. doi: 10.1074/jbc.M004118200. [DOI] [PubMed] [Google Scholar]
- Neugebauer KM. On the importance of being co-transcriptional. J Cell Sci. 2002;115:3865–3871. doi: 10.1242/jcs.00073. [DOI] [PubMed] [Google Scholar]
- Newman A. Specific accessory sequences in Saccharomyces cerevisiae introns control assembly of pre-mRNAs into spliceosomes. EMBO J. 1987;6:3833–3839. doi: 10.1002/j.1460-2075.1987.tb02720.x. [DOI] [PMC free article] [PubMed] [Google Scholar]
- Parker R, Patterson B. Architecture of fungal introns: implications for spliceosome assembly. In: Dudock B, Inouye M, editors. Molecular Biology of RNA: New Perspectives. New York: Academic Press; 1987. pp. 133–149. [Google Scholar]
- Phatnani HP, Jones JC, Greenleaf AL. Expanding the functional repertoire of CTD kinase I and RNA polymerase II: novel phosphoCTD-associating proteins in the yeast proteome. Biochemistry. 2004;43:15702–15719. doi: 10.1021/bi048364h. [DOI] [PMC free article] [PubMed] [Google Scholar]
- Pikielny CW, Rosbash M. Specific small nuclear RNAs are associated with yeast spliceosomes. Cell. 1986;45:869–877. doi: 10.1016/0092-8674(86)90561-1. [DOI] [PubMed] [Google Scholar]
- Proudfoot NJ, Furger A, Dye MJ. Integrating mRNA processing with transcription. Cell. 2002;108:501–512. doi: 10.1016/s0092-8674(02)00617-7. [DOI] [PubMed] [Google Scholar]
- Ren B, Robert F, Wyrick JJ, Aparicio O, Jennings EG, Simon I, Zeitlinger J, Schreiber J, Hannett N, Kanin E, et al. Genome-wide location and function of DNA binding proteins. Science. 2000;290:2306–2309. doi: 10.1126/science.290.5500.2306. [DOI] [PubMed] [Google Scholar]
- Stevens SW, Ryan DE, Ge HY, Moore RE, Young MK, Lee TD, Abelson J. Composition and functional characterization of the yeast spliceosomal penta-snRNP. Mol Cell. 2002;9:31–44. doi: 10.1016/s1097-2765(02)00436-7. [DOI] [PubMed] [Google Scholar]
- Swinburne IA, Meyer CA, Liu XS, Silver PA, Brodsky AS. Genomic localization of RNA binding proteins reveals links between pre-mRNA processing and transcription. Genome Res. 2006;16:912–921. doi: 10.1101/gr.5211806. [DOI] [PMC free article] [PubMed] [Google Scholar]
- Tardiff DF, Rosbash M. Arrested yeast splicing complexes indicate stepwise snRNP recruitment during in vivo spliceosome assembly. RNA. 2006;12:968–979. doi: 10.1261/rna.50506. [DOI] [PMC free article] [PubMed] [Google Scholar]
- Teem JL, Rosbash M. Expression of a β-galactosidase gene containing the ribosomal protein 51 intron is sensitive to the rna2 mutation of yeast. Proc Natl Acad Sci USA. 1983;80:4403–4407. doi: 10.1073/pnas.80.14.4403. [DOI] [PMC free article] [PubMed] [Google Scholar]
- Villa T, Pleiss JA, Guthrie C. Spliceosomal snRNAs: Mg(2+)-dependent chemistry at the catalytic core? Cell. 2002;109:149–152. doi: 10.1016/s0092-8674(02)00726-2. [DOI] [PubMed] [Google Scholar]
- Warner JR. The economics of ribosome biosynthesis in yeast. Trends Biochem Sci. 1999;24:437–440. doi: 10.1016/s0968-0004(99)01460-7. [DOI] [PubMed] [Google Scholar]
- Wetterberg I, Zhao J, Masich S, Wieslander L, Skoglund U. In situ transcription and splicing in the Balbiani ring 3 gene. EMBO J. 2001;20:2564–2574. doi: 10.1093/emboj/20.10.2564. [DOI] [PMC free article] [PubMed] [Google Scholar]
- Wiesner S, Stier G, Sattler M, Macias MJ. Solution structure and ligand recognition of the WW domain pair of the yeast splicing factor Prp40. J Mol Biol. 2002;324:807–822. doi: 10.1016/s0022-2836(02)01145-2. [DOI] [PubMed] [Google Scholar]
Associated Data
This section collects any data citations, data availability statements, or supplementary materials included in this article.