

Abstract
The spleen is the largest secondary lymphoid organ, is considered the draining site for compounds that are administered intravenously, and is therefore considered an important organ to evaluate for treatment-related lesions. Due to the presence of B and T lymphocytes, the immunotoxic effects of xenobiotics or their metabolites on these cell populations may be reflected in the spleen. Therefore it is one of the recommended organs to evaluate for enhanced histopathology of the immune system. The two major functional zones of the spleen are the hematogenous red pulp and the lymphoid white pulp (periarteriolar sheaths, follicles and marginal zones). For enhanced histopathology, these splenic compartments should be evaluated separately for changes in size and cellularity, and descriptive rather than interpretive terminology should be used to characterize any changes (Haley et al., 2005). Moreover, germinal center development within the lymphoid follicles should be noted as increased or decreased.
Keywords: Spleen, red pulp, white pulp, PALS, marginal zone, follicles
Introduction
The spleen is considered the draining site for compounds that are administered intravenously (US FDA, 2001). The two major functional zones of the spleen are the hematogenous red pulp and the lymphoid white pulp. The white pulp, located around a central arteriole, is composed of the periarteriolar lymphoid sheath (PALS, T-cell area), the adjacent follicles (B-cell area), and marginal zone (B-cell area) (Figure 1). The marginal zone lies between the white and red pulp and the junction between the marginal zone and red pulp is not always distinct. In addition to lymphocytes, the marginal zone contains specific populations of macrophages. The splenic architecture is similar across species; however the marginal zone of the rat is comparatively prominent.
Figure 1.

Normal spleen from a control rat is depicted in Figures 1a–c. In Figure 1a the arrowhead indicates the PALS region of the spleen surrounding the central artery. This is the darkest region of the white pulp due to the presence of predominately small lymphocytes. The short arrow indicates a lymphoid follicle whereas the long arrow indicates the marginal zone that surrounds both the PALS and the follicle. In this control spleen, apoptotic cells are rare within these three regions of the white pulp. The arrows in Figures 1b and 1c indicate two small heterochromatic cell fragments, indicative of apoptotic bodies.
According to the STP position paper: Best Practice Guideline for the Routine Pathology Evaluation of the Immune System (Haley et al., 2005), the separate compartments in each lymphoid organ should be evaluated separately and descriptive rather than interpretive terminology should be used to characterize changes within those compartments. Therefore, the PALS, lymphoid follicles, marginal zone, and red pulp should be evaluated separately for changes in size and cellularity. Germinal center development within the lymphoid follicles should be noted as increased or decreased. Typical cellular changes that can be observed after exposure to an immunomodulatory agent are an alteration in the size and density of the PALS and/or marginal zone, and a change in the number of follicles with germinal centers (Gopinath, 1996; Harleman, 2000; Kuper et al., 2000). Measures of follicle cellularity and germinal center development have been reported to be the most sensitive predictors for potential immunotoxicity whereas subtle changes in the red pulp are often difficult to detect (Germolec et al., 2004). See Cesta for more detailed information on the normal structure and function of the spleen (Cesta, 2006).
White Pulp
Decreased cellularity of the PALS region can occur after exposure to irradiation, viruses or drugs that can cause necrosis or apoptosis of the T cells (Figure 2). Athymic animals also have decreased cellularity in this T cell-rich region. There can also be specific decreased cellularity of the B cell-rich marginal zone, although this is a less frequent treatment-related effect but may be increasingly encountered with the development of novel immunomodulatory drugs (Haley, personal communication) (Figure 3). Such a change may be suggestive of deficits in T-independent humoral immune responses. Some chemicals, such as N,N-dimethyl-p-toluidine and AZT/Methadone HCL will cause an overall decrease in the cellularity and area of the white pulp (Figures 4 and 5). Increased cellularity of the PALS region may be seen with certain chemical treatments such as Citral and androstenedione (Figures 6 and 7) but there can also be increased cellularity of this region in early metastasis of thymic T-cell lymphomas, and other lymphomas and leukemias.
Figure 2.

Splenic tissue from a 30-day-old Sprague Dawley rat treated with dexamethasone is depicted in Figures 2a–d. At low magnification (Figure 2a) the PALS region appears “moth-eaten” due to a moderate degree of scattered lymphocyte apoptosis (arrow). The arrowhead in Figure 2a indicates the presence of apoptotic cells within the periphery of the marginal zone. Figures 2b and 2c show higher magnifications of this PALS region. The arrows indicate tingible body macrophages with cytoplasmic engulfed apoptotic debris and the arrowhead indicates free apoptotic bodies. Figure 2d is a higher magnification of the region depicted in Figure 2a with an arrowhead. This image illustrates a region of the peripheral marginal zone with apoptotic bodies and tingible body macrophages.
Figure 3.
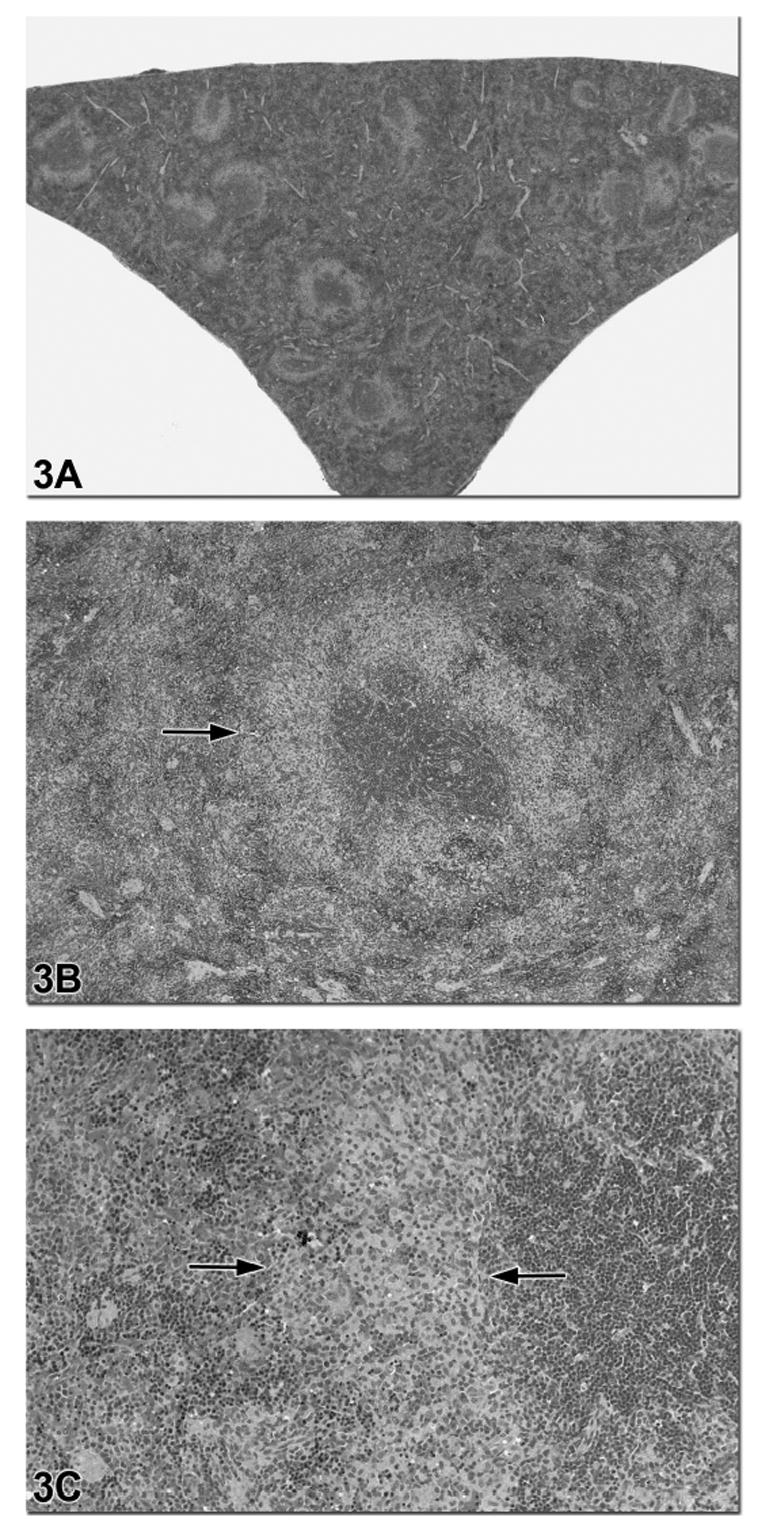
Figures 3a–c are images of a spleen from a 90-day-old F344 rat treated with riddelline. There is diffuse and severe decreased cellularity of the B lymphocytes in the marginal zone (arrows in 3b and 3c). Higher magnification in Figure 3b shows that the T cell-rich PALS regions and B cell-rich follicles are not affected. The area of B lymphocyte depletion in the marginal zone is paler staining due to the presence of macrophages (Figure 3c).
Figure 4.

Figures 4a and 4b are low and high magnifications images of a spleen from a male F344 rat in a N,N-dimethyl-p-toluidine subchronic study. Figures 4c and 4d are low and high magnification images from an age- and sex-matched control rat with prominent marginal zones. The spleen from the treated rat had a diagnosis of decreased white pulp area and cellularity and decreased red pulp area and cellularity. Figure 4b illustrates that all compartments of the white pulp (PALS, follicles, marginal zone) were similarly affected.
Figure 5.

This spleen is from a female B6C3F1 mouse that was treated with 800 mg/kg bodyweight of the antiviral drug azidothymidine (AZT) plus methadone HCL for 90 days. This treatment resulted in decreased cellularity of both the white pulp and red pulp. The capsular surface has a distinctive scalloped appearance, in this case indicative of a decrease in organ size due to the marked loss of lymphocytes and red blood cells. The higher magnification in 5b illustrates the variable decrease in cellularity in the PALS, marginal zones and follicles. As with all enhanced histopathology evaluations, each compartment should be evaluated separately and compared with controls.
Figure 6.

The low and high magnification images of the spleen in Figures 6a and 6b are from a 90-day-old male B6C3F1 mouse treated with citral and an age-and sex-matched control from the same study is provided in Figures 6c and 6d for comparison. In this study, the diagnosis for the spleen in Figure 6a was a mild increase in lymphocyte cellularity. At high magnification (Figure 6b) the PALS regions and marginal zones have increased cellularity and there is a relative decrease in the area of red pulp due to the expansion of the white pulp as well as a decrease in hematopoietic precursor cells. This type of lesion would have to be distinguished from neoplasia. This example illustrates the need to compare a lesion with appropriate controls in order to determine the range of normal histology and to devise an appropriate grading scheme.
Figure 7.
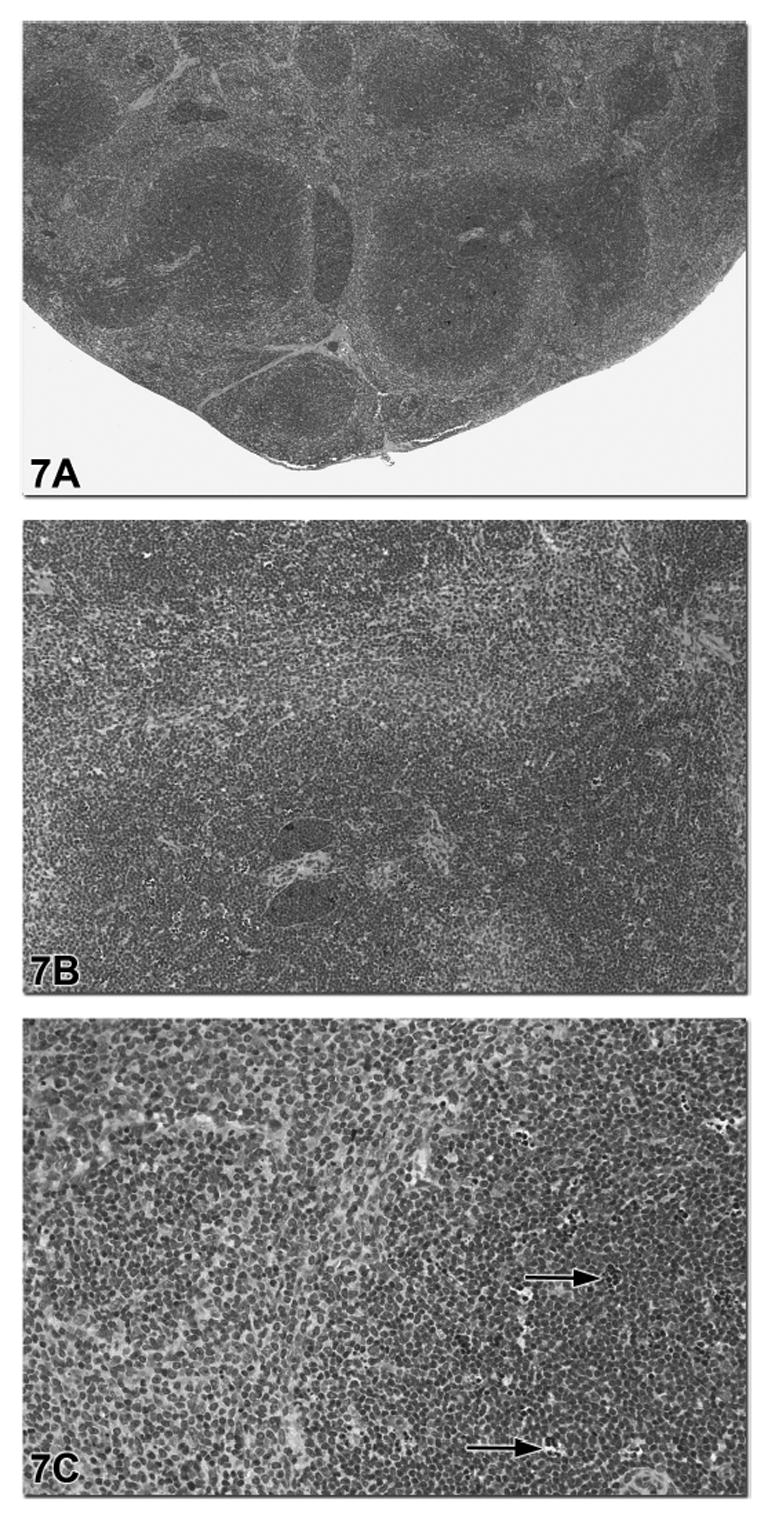
This spleen is from a male B6C3F1 mouse in a subchronic androstenedione study. The diagnosis was a mild increase in lymphocyte cellularity and mild lymphocyte apoptosis based on an appropriate grading scheme for this study. Figure 7a shows the expansion of the white pulp with a relative decrease in the area of red pulp. Figure 7b shows that the increase in lymphocyte cellularity involves the T cell-rich PALS regions. Within these regions of lymphocyte hypercellularity there was scattered lymphocyte apoptosis with tingible body macrophages (arrows, Figure 7c).
An acute immune response to antigens may result in increased cellularity in the B-cell areas and an increase in secondary follicles with prominent germinal centers. Immature B cells, or immunoblasts, will proliferate in response to antigenic stimuli. These cells are larger and paler-staining than the mature lymphocytes and have rounded, regular nuclear membranes. They will mature to immunoglobulin-producing plasma cells and migrate into the red pulp. F344 rats with mononuclear cell leukemia (MCL) may have an apparent increased cellularity in the marginal zone due to infiltration or sequestration of the large granular lymphocyte leukemic cells within this region. Marked increased in cellularity of the white pulp is sometimes difficult to distinguish from neoplasia. See Suttie for a comprehensive review of splenic lesions and discussion of borderline diagnoses of splenic neoplasia (Suttie, 2006).
Red Pulp
The red pulp should also be evaluated for changes in lymphocyte numbers. Reactive extramedullary hematopoiesis may be seen in conjunction with conditions that target the destruction of lymphocytes. This condition must be differentiated from the infiltration of the red pulp with large granular lymphocyte leukemic cells in F344 rats with MCL. It is also possible to identify decreased lymphocyte cellularity of the red pulp in those cases where systemic lymphocyte numbers are significantly decreased. Although the red pulp contains lymphocytes and macrophages, it is predominantly composed of red blood cells. For this reason there can be variation in splenic size and weight as well as histological variation in red pulp size and erythrocyte cellularity depending on the method of euthanasia and the efficacy of exsanguination at necropsy. However, variations in spleen weight due to methods of exsanguination are more likely to be encountered in dogs and monkeys, rather than rats. The available evidence suggests that splenic weight is a relatively insensitive indicator of immunotoxicity (Luster et al., 1992). In order to be toxicologically significant, the changes in spleen weight should be dose related and be confirmed with histopathological evaluation.
Aging Lesions
Increased cellularity in the B cell-rich follicles or marginal zones can be seen in aging rats and mice without any apparent increase in plasma cells. Enlarged spleens with decreased lymphocyte cellularity and increased myelopoiesis may be seen in aging rats, especially Sprague-Dawley rats, without an apparent etiology.
Additional Cells and Lesions
The presence, severity grade and location of plasma cells, apoptotic cells, tingible body macrophages, pigmented macrophages, granulocytes and hematopoietic cells should also be noted. Although granulomas, macrophage aggregates, fibrosis and necrosis are not strictly a component of enhanced histopathology, they should be noted during the evaluation. An example of a checklist for the changes to be noted in the spleen for enhanced histopathology is given in Table 1. This table is intended to be an example of a guideline that the pathologist can use during histological evaluation rather than a format for reporting lesions. The diagnoses listed in this table are descriptive rather than interpretive, consistent with the STP position paper: Best Practice Guideline for the Routine Pathology Evaluation of the Immune System (Haley et al., 2005).
TABLE 1.
Spleen.
| Yes/⇑ ⇓/Severity Grade* | No | |
|---|---|---|
| Periarteriolar lymphoid sheath | ||
| Increased/decreased size | ||
| Increased/decreased number | ||
| Increased/decreased lymphocytes | ||
| Marginal zone | ||
| Increased/decreased size | ||
| Increased/decreased lymphocytes | ||
| Follicles | ||
| Increased/decreased numbers | ||
| Increased/decreased lymphocytes | ||
| Increased/decreased germinal centers | ||
| Red pulp | ||
| Increased/decreased size | ||
| Increased/decreased lymphocytes | ||
| Increased hematopoietic cells | ||
| Increased numbers (indicate location) | ||
| Plasma cells | ||
| Apoptotic cells | ||
| Tingible body macrophages | ||
| Pigmented macrophages | ||
| Dendritic cells | ||
| Granulocytes/mast cells | ||
| Granuloma/macrophage aggregates | ||
| Fibrosis | ||
| Necrosis | ||
| Other | ||
One recommendation for a grading scheme would be 0 = normal, 1 = minimal, 2 = mild, 3 = moderate, 4 = marked.
Footnotes
This research was supported by the Intramural Research Program of the NIH, National Institute of Environmental Health Sciences.
References
- Cesta MF. Normal structure, function, and histology of the spleen. Toxicol Pathol. 2006;34:455–465. doi: 10.1080/01926230600867743. [DOI] [PubMed] [Google Scholar]
- Germolec DR, Kashon M, Nyska A, Kuper CF, Portier C, Kommineni C, Johnson KA, Luster MI. The accuracy of extended histopathology to detect immunotoxic chemicals. Toxicol Sci. 2004;82:504–14. doi: 10.1093/toxsci/kfh271. [DOI] [PubMed] [Google Scholar]
- Gopinath C. Pathology of toxic effects on the immune system. Inflamm Res. 1996;45(Suppl 2):S74–S8. [PubMed] [Google Scholar]
- Haley P, Perry R, Ennulat D, Frame S, Johnson C, Lapointe JM, Nyska A, Snyder P, Walker D, Walter G. STP position paper: best practice guideline for the routine pathology evaluation of the immune system. Toxicol Pathol. 2005;33:404–7. doi: 10.1080/01926230590934304. [DOI] [PubMed] [Google Scholar]
- Harleman JH. Approaches to the identification and recording of findings in the lymphoreticular organs indicative for immunotoxicity in regulatory type toxicity studies. Toxicology. 2000;142:213–9. doi: 10.1016/s0300-483x(99)00146-8. [DOI] [PubMed] [Google Scholar]
- Kuper CF, Harleman JH, Richter-Reichelm HB, Vos JG. Histopathologic approaches to detect changes indicative of immunotoxicity. Toxicol Pathol. 2000;28:454–66. doi: 10.1177/019262330002800317. [DOI] [PubMed] [Google Scholar]
- Luster MI, Portier C, Pait DG, White KL, Jr, Gennings C, Munson AE, Rosenthal GJ. Risk assessment in immunotoxicology. I. Sensitivity and predictability of immune tests. Fundam Appl Toxicol. 1992;18:200–10. doi: 10.1016/0272-0590(92)90047-l. [DOI] [PubMed] [Google Scholar]
- Suttie AW. Histopathology of the spleen. Toxicol Pathol. 2006;34:466–503. doi: 10.1080/01926230600867750. [DOI] [PubMed] [Google Scholar]
- U.S. Food and Drug Administration (US FDA), Department of Health and Human Services, Center for Drug Evaluation and Research (CDER) [October 2002];Guidance for Industry Immunotoxicology Evaluation of Investigational New Drugs. 2001 http://www.fda.gov/cder/guidance/index.html.