Abstract
Nicotinic acetylcholine receptors (nAChRs) are pentameric ligand-gated cation channels composed of α and β subunits. nAChR subunit expression is highly regulated during development. Previous studies have revealed increased expression of α3, α5, α7, and β4 subunit mRNAs and α7 binding sites during hippocampal and cortical development. Here, we examined the expression of α2 subunit mRNA in rat cortex and hippocampus using highly sensitive radioactive in situ hybridization. α2 subunit mRNA expression was first detected at P3 in cortex and hippocampus. During postnatal development the distribution of α2 subunit mRNA expression was spatially similar to the one found in adult, exhibiting highly restricted expression in scattered cells mostly in cortical layer V and retrosplenial cortex, and in scattered cells in CA1/CA3 stratum oriens and CA3 stratum radiatum. However, the expression intensity and number of α2 positive cells strongly increased to reach peak levels in both cortex and hippocampus at P7 and decreased thereafter to moderate to low to levels. Double in situ hybridization revealed that most, but not all, α2 mRNA expression was located in non-pyramidal GAD-positive cortical and hippocampal interneurons. Thus, similar to other nAChR subunits, α2 mRNA expression is transiently upregulated during postnatal development and nAChRs containing α2 subunits could regulate GABAergic activity during a critical period of network formation.
1. Introduction
Neuronal nicotinic acetylcholine receptors (nAChRs) are ligand-gated ion channels widely expressed in the central (CNS) and peripheral nervous system (PNS), where they are activated by the endogenous neurotransmitter acetylcholine (Le Novère and Changeux, 1995, Dani 2001). In the rat, a total of eight ligand binding α and three structural β subunits have been cloned, which in various combinations of α and β subunits, form distinct heteromeric or homomeric pentameric receptor subtypes (Couturier et al., 1990; Seguela et al., 1993, Sargent, 1993, Corringer et al., 2000). After cloning and characterization of the muscle type nAChR subunits (α1, β1, δ ,ε, γ ), the α2 was the first neuronal subunit to be cloned, sequenced and characterized (α2, Wada et al., 1988) followed by α3 (Boulter et al., 1986), α4 (Goldman et al., 1987), β2 (Deneris et al., 1988), β3 (Deneris et al., 1989), β4 (Isenberg and Meyer, 1989, Duvoisin et al., 1989), α5 (Boulter et al., 1990), α6, (Lamar et al., 1990), α7 (Seguela et al., 1993), α9 (Elgoyhen et al., 1994) and finally α 10 (Elgoyhen et al., 2001).
Although, one of the first neuronal subunits cloned, α2 has not received the attention like more widely expressed subunits such as α4 and β2 which form the majority of heteromeric nAChRs and the α7 homomer forming subunit, mostly because of the limited expression of α2 mRNA. In situ hybridization in adult rodent brain sections has revealed that α2 mRNA expression is highly restricted to scattered cells located in various brain structures, including hippocampus and cortex, with substantial expression only found in the interpeduncular nucleus (Wada et al., 1988, Ishii et al., 2005). However, numerous studies investigating the developmental expression of nAChRs and subunit mRNAs have shown that the expression is often developmentally regulated (Naeff et al., 1992; Schuetze et al., 1987, Zoli et al. 1995, Winzer-Serhan and Leslie, 1997). In particular, cortical and hippocampal structures exhibit transiently increased expressions of α3, β4, and α5 (Winzer-Serhan and Leslie, 1997; 2005) and α7 subunit mRNAs and receptor binding sites during pre- and postnatal development (Adams et al., 2002; Broide et al., 1995). Regulation of α2 subunit mRNA has been reported in the developing chick nervous system (Brussaard et al., 1994, Daubas et al., 1990). However, the developmental expression of α2 nAChR subunit mRNA in rat brain remains unknown. In this study we used highly specific in situ hybridization to examine the expression of α2 nAChR subunit mRNA during cortical and hippocampal development.
2. Methods and materials
2.1. Tissue Preparation
Timed pregnant Sprague-Dawley rat dams (with the day of insemination designed as embryonic 0 (E0); Harlan, Houston, TX) were killed by decapitation. The fetuses were removed by cesarean section and their heads (E15, E18, and E21) immediately frozen in isopentane at −20°C. Pups were born at E22/postnatal day 0 (P0), and animals of different postnatal ages (P1, P3, P5, P7, P10, P14, and P21) and adult males were killed by decapitation. The brains were removed and frozen in isopentane at −20°C and stored at −80°C until use. This procedure was approved by the Texas A&M Univ. Animal Use Committee and was consistent with federal guidelines. Twenty-micron brain sections were cryostat-cut in the transverse plane and post-fixed with 4% paraformaldehyde in 0.1 M Phosphate buffer (PB), pH 7.4 for 1 h at room temperature (RT), then washed in PB, air-dried, and stored desiccated at −20°C until use.
2.2. cRNA Probe Preparation
Plasmids (pBluscript-SK (+) containing full-length α2 (1931 bp) and α4 cDNA, (kindly provided by Dr. J. Boulter, University of California, Los Angeles) were first linearized by restriction enzymes digest. The α2 template was then processed for in vitro transcription with [35S]-UTP to synthesize full-length radio-labeled antisense or sense (T3, T7 RNA polymerase, respectively) cRNA probes. Non-labeled full-length α2 and α4 cRNA antisense probes were also generated using non-labeled UTP instead of [35S]-UTP.
A 476 bp template for glutamic acid decarboxylase-67kDa (GAD67) was generated by RT-PCR (forward primer: 5’-ATGGCATCTTCCACGCCTTCG-3’, reverse primer: 5’-CCAAATTAAAACCTTCCATGCC-3’). The amplified GAD67 fragment (185-650 bp) was inserted into pPCR-Script Amp SK(+). The orientation of the GAD 67 insert was confirmed by sequencing (Gene Technologies Lab, College Station, TX). The linearized plasmid containing GAD67 fragment was used as template to synthesize non-radioactive digoxigenin (Dig)-labeled cRNA antisense probe using T7 RNA polymerase with Dig-rUTP (Dig-RNA labeling Mix, Roche Applied Science, Indianapolis, IN).
2.3. In situ and double in situ hybridization
Tissue sections were processed for in situ hybridization as previously described (Winzer-Serhan et al., 1997, 1999). Briefly, sections were pretreated with 0.05 μg/ml proteinase K for 10 minutes at RT, acetylated, dehydrated through a graded series of ethanols (50, 70, 95, and 100%), and then air-dried. Sections were incubated overnight at 60–65°C with hybridization solution (12.5% dextran sulfate, 0.5μg tRNA, 0.01 M dithiothreitol) (Fisher Scientific, Pittsburgh, NJ), 0.3 M NaCl, 10 mM Tris-HCl, pH 8.0, and 1 mM EDTA, (pH 8.0). The next day, sections were incubated with RNAase A (10 mg/ml) for 30 min at 37°C, followed by two 5 and 10 min washes of decreasing salinity (2 – 0.5 x sodium chloride-sodium citrate buffer (SSC)) at RT and a 30 min wash in 0.1x SSC at 65°C. Tissue sections were dehydrated, dried in a stream of cool air, and apposed to Kodak BioMax-MR film with [14C] standards of known radioactivity at 4°C for 5 days. Following film development sections were dipped in Kodak autoradiography NTB emulsion and exposed at 4°C for 5 weeks. Slides were developed in Kodak D-19 diluted 1:1 with water, fixed in Kodak Professional fixer (Rochester, NY), and counter stained with Cresyl-Violet. After staining, the slides were cover slipped with DPX mounting medium (Fluka, Ronkonkoma, NY).
For displacement study, 35S-labeled α2 antisense probe (107 cpm/ml) in combination with non-labeled α4 or α2 antisense probes (0.6 μg/ml) were used for hybridization. The tissue sections were then processed for in situ hybridization as described above.
For double in situ hybridization, sections were hybridized overnight at 60–65°C with Dig-labeled GAD67 antisense probe (2.5 μg/ml) in combination with 35S-labeled α2 antisense probe (107 cpm/ml). After hybridization, sections were washed as described above. After the hot wash, the slides were incubated in Genius buffer 1 (GB1; 100 mM Tris-HCl, 150 mM NaCl, pH 7.5) for 1 min, followed by a 30 min incubation in 5% nonfat dry milk in GB1 + 0.25% Triton-X at RT. A 1:1,000 dilution (GB1 + 0.25% Triton-X) of anti-Dig alkaline phosphatase conjugated Fab antibody (Roche Applied Science, Indianapolis, IN) was applied and the slides were incubated for 3 h at 37°C. The slides were washed for 1, 5, and 10 min in GB1 + 0.25% Triton-X; then color reagent (50 μl NBT, 37.5 μl BCIP in 10 ml GB3, 100 mM Tris-HCl, 100 mM NaCl, 50 mM MgCl2, pH 9.5) was applied in the dark. The slides were incubated overnight at RT and washed twice in GB4 (10 mM Tris-HCl, 1 mM EDTA, pH 8.0) and double deionized water, dehydrated with brief dips in graded ethanol (50, 75, 95, and 100 %), air-dried, and apposed to Kodak BioMax MR film for appropriate periods. Following film development, sections were coated with 2% parlodion, dried overnight, and dipped in Kodak autoradiography NTB emulsion. After a 4~5 weeks exposure period the slides were developed and cover-slipped.
2.4. Data Analysis
Autoradiographic images of sections were obtained and analyzed using a computer-based image analysis system (MCID, Imaging Research, GE Healthcare). A standard curve (raw optical density vs. nCi/g wet weight) was generated from [14C]-standards (Amersham). Specific hybridization (nCi/g wet weight) to α2 mRNA was determined by subtracting non-specific hybridization obtained with the sense probe from the values obtained with the antisense probe. α2 mRNA expression was analyzed using a one-way ANOVA with postnatal days as the between-variable. Following a significant density difference, Fisher’s least significance difference (LSD) was used for the post hoc analyses. The α level was set at 0.05 for all analyses.
The light- and dark-field photomicrographic images were taken from emulsion-dipped sections by automatic photomicrographic system (Olympus, Melville, NY. USA). The number of cells expressing α2 mRNA was counted under darkfield from emulsion-dipped sections containing dorsal hippocampus and somatosensory cortex (from Bregma −2.80 mm to −3. 80 mm according to the “Rat Brain Atlas” by Paxinos and Watson, 1998). Data were expressed as the total number of cells per section after correction for dilution due to brain growth. Correction factors were determined by measuring the length of the area corresponding to Bregma −2.80 and −3.80 mm in 3 rats age P7, P21, and adults, and the actual number of cells per section was multiplied by 1 (P7), 1.2094 (P21) and 1.3507 (adults). The P7, P21, and adult hippocampi were found to be 1.273 ± 29.06, 1.540 ± 41.43, and 1.720 ± 46.19 mm, respectively.
In sections hybridized with 35S-labeled α2 antisense probe, a positively labeled cell was defined as one having silver grains tightly clustered above a cell body stained by Cresyl-violet. The positively Dig-labeled cells were identified by the purple color of the alkaline phosphatase colorimetric reaction; α2 positive hybridization signal was defined as a tight cluster of silver grains above a cell body stained by Dig-labeled GAD67 probe.
3. Results
3.1. Adult expression and probe specificity
The expression pattern of α2 nAChR subunit mRNA in adult rat brain resembled the previously reported expression pattern (Fig. 1) (Wada et al., 1989; Ishii et al., 2005). A series of coronal sections were hybridized with 35S-α2 antisense or sense probes, to detect specific and non-specific hybridization, respectively. Hybridization signal was detected within few scattered cells in CA1/CA3 stratum oriens, CA3 stratum radiatum, and mostly in cortical layers V (Fig. 1). The nAChR α2 subunit mRNA expression was more intense in ventral than in dorsal hippocampus (data not shown). To verify that the full-length 35S-α2 antisense cRNA probe hybridized specifically to α2 mRNA and not to the highly homologous α4 nAChR subunit mRNA, consecutive sections were processed with 35S-α2 antisense in the presence of non-labeled antisense probes for α2 or α4. Hybridization of 35S-labeled α2 antisense probe was displaced only by non-labeled α2 (Fig. 1B) but not α4 cRNA probe (Fig. 1C), indicating no cross-reactivity to α4 mRNA. However, in order to prevent any possible cross-reactivity to α4 mRNA, a combination 35S-α2 with non-labeled α4 antisense probe was used for this study. The sense α2 control exhibited low hybridization signal indicating low non-specific hybridization; however, some signal was detected in the hippocampal pyramidal layer and in the granule layer of the dentate gyrus (Fig. 1D). Therefore, signal detected with the α2 antisense probe in the pyramidal or granule layers could not be verified as specific and was not included in the analysis.
Fig.1.
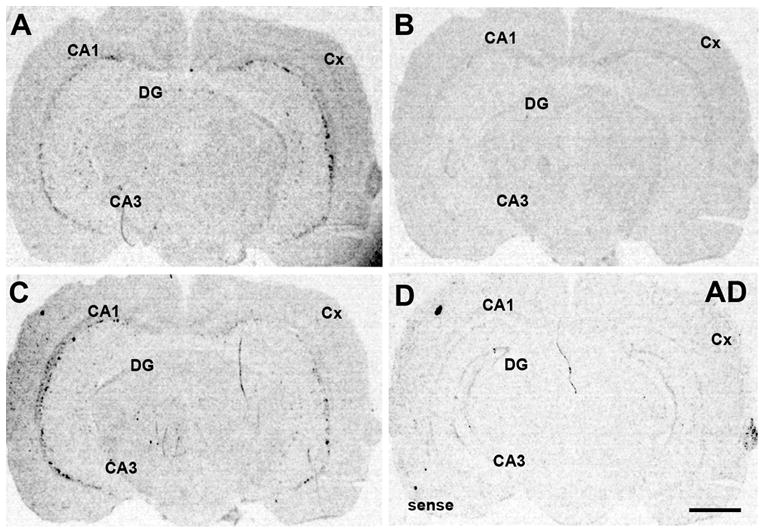
Adult expression of α2 nAChR subunit mRNA. Coronal sections were hybridized with 35S-α2 full-length antisense probe (A), 35S-α2 antisense in the presence of non-labeled α2 antisense probe (B), 35S-α2 antisense in the presence of non-labeled α4 antisense probe (C), or 35S-α2 sense probe (D). Note: hybridization signal of the 35S-α2 antisense probe was displaced by α2 but not by α4 antisense probe. Abbreviations: AD, adult; CA1/CA1, CA3/CA3 hippocampal field; Cx, cortex; DG, dentate gyrus. Scale bar = 1 mm.
3.2. Expression of α2 subunit mRNA during development
Developmental expression of α2 mRNA was analyzed in pre- and postnatal animals. No hybridization signal was detected at any embryonic age (E15, E18, E21) or in neonates (P1) in hippocampus or cortex (Fig. 2A and B). Low levels of α2 mRNA expression were first seen in hippocampus and cortex at P3 (Fig. 2C). The expression strongly increased to reach peak levels at the end of the first postnatal week in both hippocampus and cortex (Fig. 2D-F), then declined during the second postnatal week (Fig. 2G and H) and remained at low levels thereafter, similar to the low expression intensity found in adult hippocampus and cortex (Fig. 1; Fig. 2I and J; Fig. 6A). One-way ANOVAs revealed a significant difference between α2 expression intensity during postnatal development [F (6, 20) = 25.639; F (6, 20) = 19.863; F (6, 20) = 22.832, P’s < 0.001 in CA1/CA3 stratum oriens and somatosensory cortex, respectively]. Fisher’s LSD post hoc analyses revealed significant differences in expression intensity on P7, P10, and P14 when compared to adult values (P’s < 0.001, for CA1/CA3 stratum oriens, and somatosensory cortex) (Fig. 6A). However, the postnatal distribution of α2 mRNA was spatially similar to the adult in both hippocampus and cortex.
Fig.2.
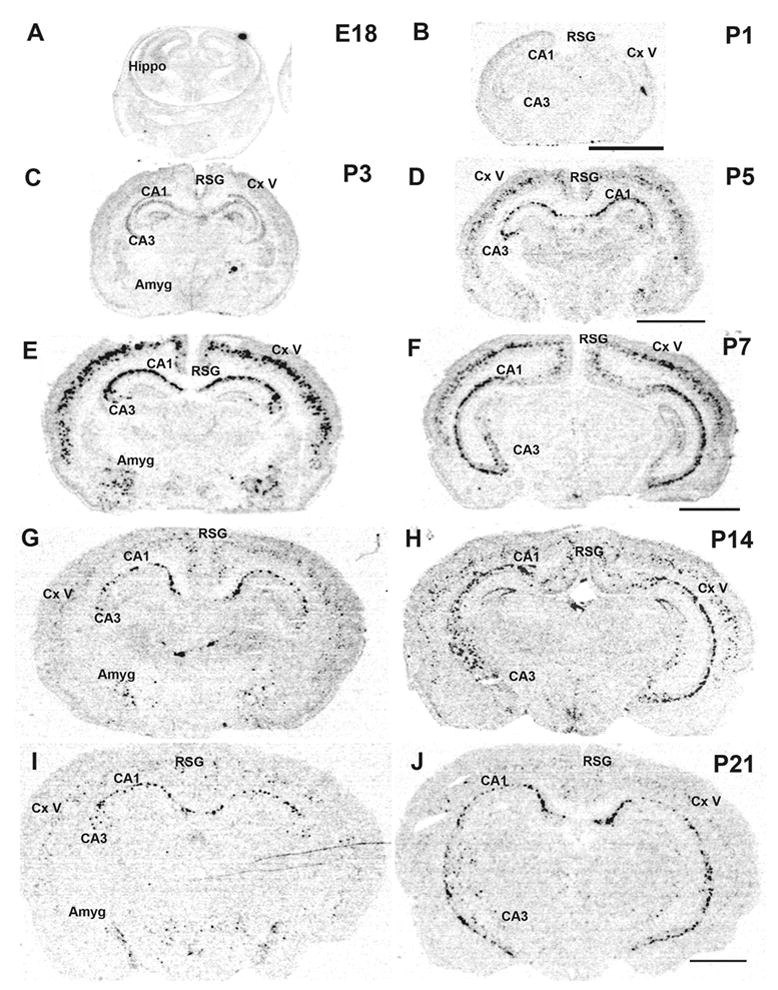
Developmental expression of α2 nAChR subunit mRNA. Coronal sections from E18 (A), P1 (B), P3 (C), P5 (D), dorsal and ventral P7 (E, F), dorsal and ventral P14 (G, H), and dorsal and ventral P21 (I, J) were hybridized with 35S-α2 antisense probe. Abbreviations: Amyg, amygdala; CA1/CA3, CA1/CA1 hippocampal field; Cx, cortex; V, cortical layer V; Hippo, hippocampus; RSG, retrosplenial granular cortex. Scale bar = 200 μm. Scale bar in B applies to A and B, in D applies to C and D, in F applies to E and F, and in J applies to G-J.
Fig.6.
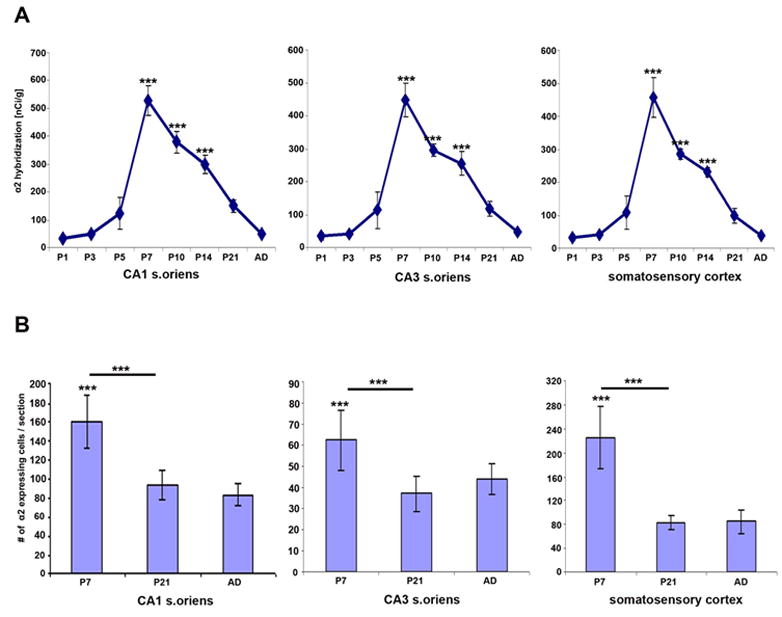
Developmental changes in hybridization signal to α2 mRNA (A) and number of cells expressing α2 mRNA in CA1/CA3 stratum oriens and somatosensory cortex at P7, P21 and adult (B). A: Plotted are means ± SEM of specific α2 hybridization (nCi/g) at different postnatal ages. B: Plotted are average numbers of α2 mRNA expressing cells per section at P7, P21 and adult corrected for growth. The asterisks indicate a significant difference when compared to adult expression, asterisks above bar indicate significant difference of P7 compared to P21, ***, P<0.001 according to student’s T-test, n=3.
Darkfield analysis of dorsal hippocampus confirmed the expression of α2 mRNA in scattered neurons in CA1 and CA3 stratum oriens and CA3 stratum radiatum beginning at P3 (Fig. 3A). At P7, strong expression was detected in scattered cells in CA1 stratum oriens and CA3 stratum radiatum and moderate expression in CA3 stratum oriens (Fig. 3B). Very few cells expressing α2 transcripts were detected in the hilar region of dentate gyrus at any age (Fig. 3). By P14 α2 expressing cells were mainly localized to the outer layer of CA1 stratum oriens/alveus.
Fig. 3.
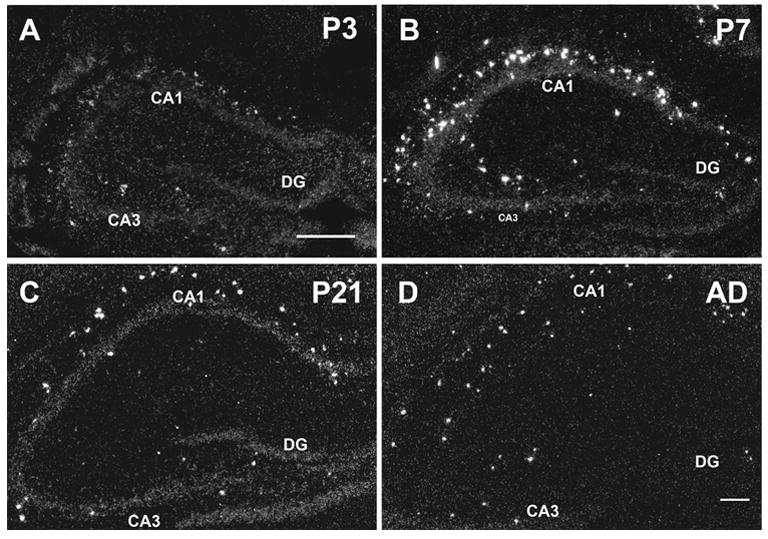
Darkfield images of α2 mRNA expression in developing hippocampus at P3 (A), P7 (B), P21 (C), and adult (D). Abbreviations: CA1/CA3, CA1/CA3 hippocampal field; DG, dentate gyrus . Scale bar = 100 μm, in A applies to A and B, and in D applies to C and D.
In the developing cortex, α2 subunit mRNA expression was restricted to deeper cortical layers with a spatial distribution pattern similar to the one seen in adults (Fig. 4). Transcripts for α2 nAChR subunits were detected in scattered cells mostly in layer V and a few in layer VI starting at P3 (Fig. 4A). The expression strongly increased in intensity and number of α2 positive cells by the end of the first postnatal week, but decreased thereafter, similar to the temporal expression pattern found in the hippocampus (Fig. 4B, C, D). In the retrosplenial cortex, expression of α2 mRNA was detected in scattered cells beginning at P3, increasing in intensity and number by P7, then sharply declined to adult levels (Fig. 5). Whereas the spatial distribution of α2 mRNA expressing cells did not change during development, the number of cells expressing α2 mRNA seemed temporally increased at P7. To determine if the change could be explained by dilution resulting from cortical and hippocampal growth, the number of neurons expressing α2 subunit transcript was adjusted and compared between different ages (Fig. 6B). Cell counts were taken at P7, P21, and adult in dorsal hippocampus and somatosensory cortex. The total number of α2 expressing cells in cortex, and hippocampus strongly decreased after P7 (somatosensory cortex: P7= 5628 ± 68, P21= 2433 ± 30, AD= 2150± 23; CA1 stratum oriens: P7= 3993 ± 69, P21= 2576 ± 31, AD= 2120 ± 24; CA3 stratum oriens: P7= 1563 ± 70, P21= 1101 ± 31, AD=1123 ± 24). When corrected for the growth of the hippocampus and expressed as α2 positive cells per section, significant differences were detected between P7 and P21 and adults in all three areas counted (P < 0.001, student’s T-test), but not between P21 and adult (Fig. 6B). The results suggest that there was a 40~63% decrease (CA1/CA3 stratum oriens and somatosensory cortex) in the number of α2 mRNA expressing cells during second and third postnatal development (Fig. 6B).
Fig.4.
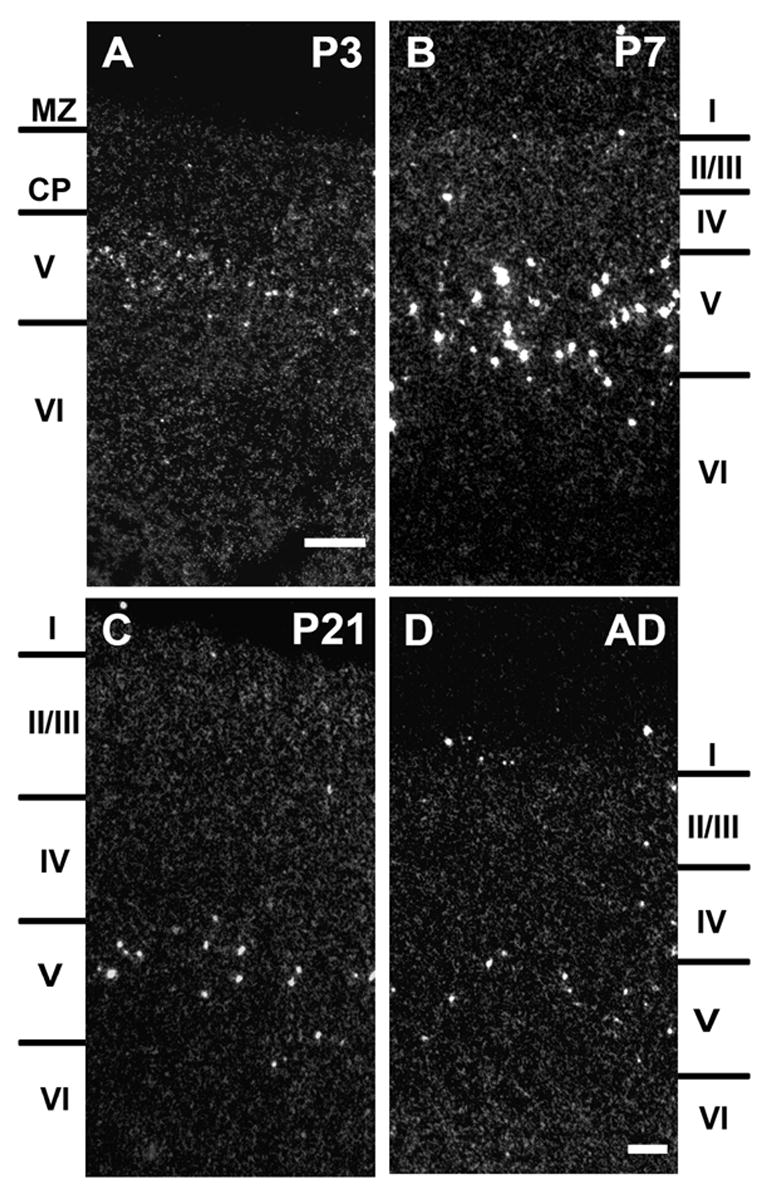
Darkfield images of α2 mRNA expression in developing somatosensory cortex at P3 (A), P7 (B), P21 (C), and adult (D). Abbreviations: CP, cortical plate; cortical layers I - VI; MZ, marginal zone are indicated by the side markers. Scale bar = 100 μm, in A applies to A and B, in D applies to C and D.
Fig. 5.
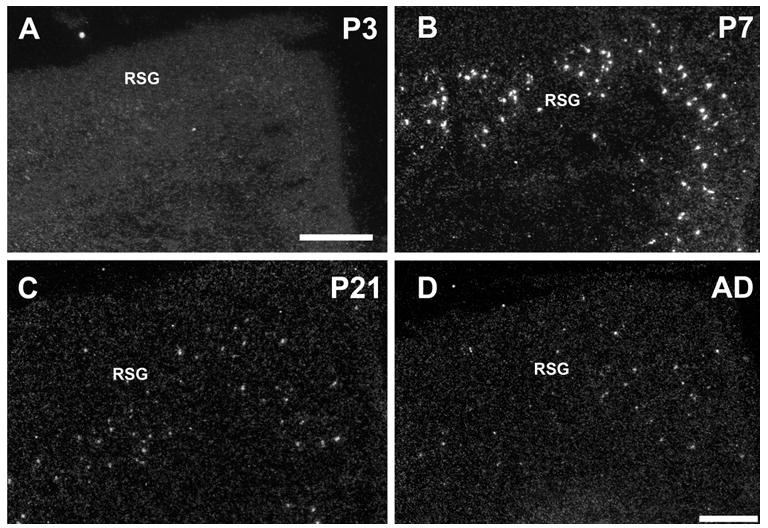
Darkfield images of α2 mRNA expression in developing retrosplenial granular cortex at P3 (A), P7 (B), P21 (C), and adult (D). Abbreviations: RSG, retrosplenial granular cortex. Scale bar = 100 μm, A applies to A and B, D applies to C and D.
3.3. Co-expression of nAChR α2 subunit mRNA and GAD67mRNA in hippocampus and cortex
The scattered distribution of α2 mRNA expressing cells in hippocampus and cortex suggest their expression in inhibitory interneurons. We used double in situ hybridization with Dig-labeled GAD67 antisense probe as a marker for GABAergic interneurons in combination with 35S- labeled full-length α2 antisense probe to co-localize α2 and GAD67 transcripts in adults (Fig. 7). In addition, we analyzed coexpression at P14, when the expression signal was significantly higher than in adults (Fig. 8). Coexpression of α2 and GAD67 mRNAs was detected in CA1 and CA3 stratum oriens and somatosensory and retrosplenial cortex in adult and P14 animals. However, not all α2 mRNA transcripts were coexpressed with GAD67 mRNA and not all GAD positive neurons in areas of α2 expression were coexpressed with α2 mRNA.
Fig.7.
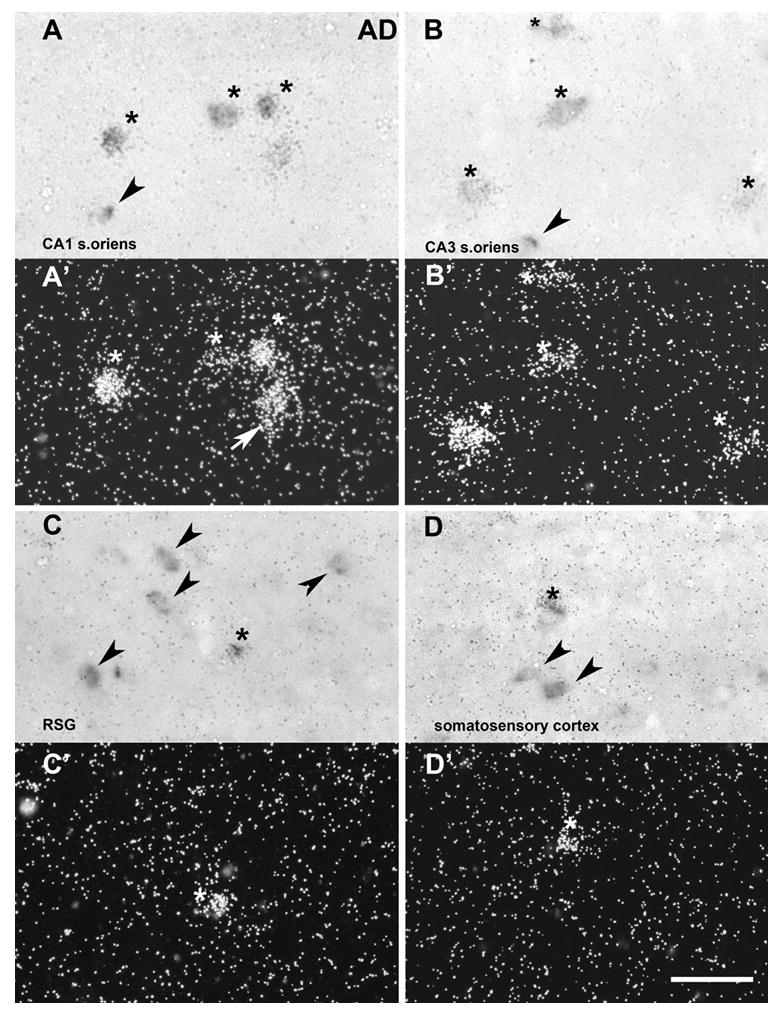
Double in situ hybridization in adult rat brain. Light- and dark-field images of α2 nAChR subunit and glutamic acid decarboxylase 67 (GAD) mRNA expression in CA1 stratum oriens (A and A’), CA3 stratum oriens (B and B’), retrosplenial granular cortex (RSG) (C and C’), and somatosensory cortex (D and D’). Sections were hybridized with digoxigenin-labeled GAD (dark cells in A, B, C, and D) in combination with 35S-labeled α2 antisense probes (silver grains in A’, B’, C’, and D’). The co-localized GAD and α2 mRNA expressions is marked by asterisks; Arrow indicates non-GAD-positive neurons expressing α2 mRNAs; Arrowheads represent single-labeled GAD expressing neurons. Scale bar = 25 μm.
Fig.8.
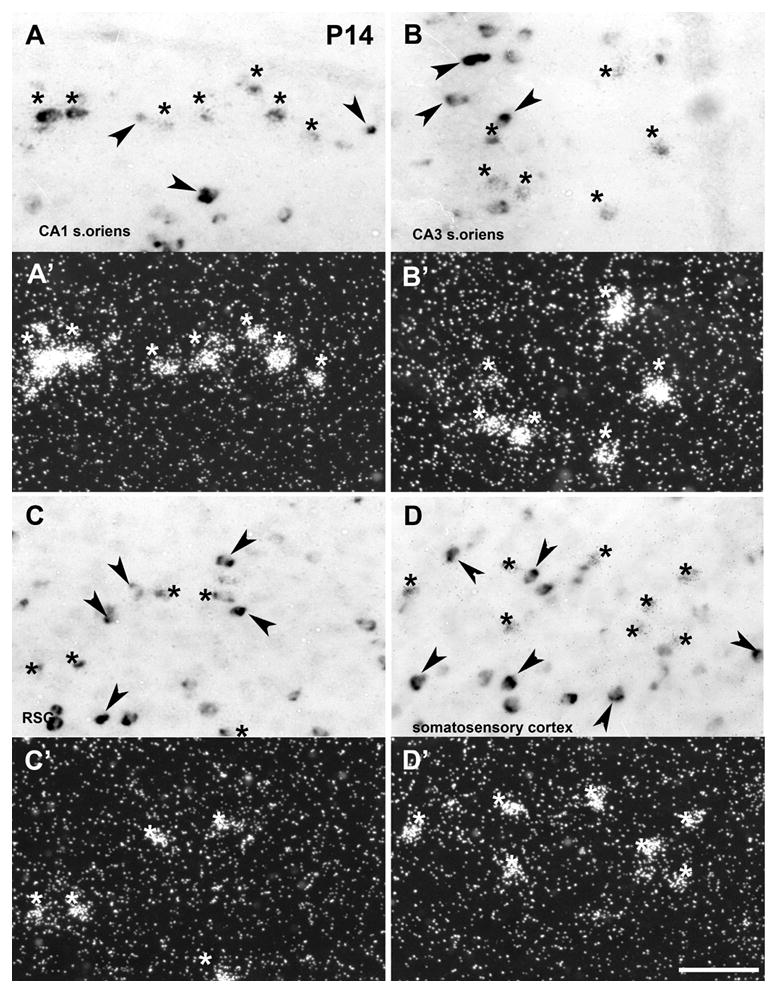
Double in situ hybridization in postnatal rat brain. Light- and dark-field images of α2 nAChR subunit and glutamic acid decarboxylase 67 (GAD) mRNA expression in CA1 stratum oriens (A and A’), CA3 stratum oriens (B and B’), retrosplenial granular cortex (RSG) (C and C’), and somatosensory cortex (D and D’) at P14. The co-localized GAD and α2 mRNA expressions is marked by asterisks; Arrowheads represent single-labeled GAD expressing neurons. Scale bar = 25 μm.
4. Discussion
The aim of this study was to examine the expression of nAChR α2 subunit mRNA during cortical and hippocampal development. The present data show a transient upregulation of α2 subunit mRNA expression intensity and number of cells expressing α2 mRNA but not a change in the general expression pattern in hippocampus or cortex during development. The highly restricted distribution of α2 subunit mRNA was first detected during the first postnatal week, in a pattern similar the adult. In addition, we verified the expression of α2 subunit mRNA in GABAergic interneurons in postnatal and adult animals.
4.1. Methodological considerations
A previous study suggested the possible cross-reactivity of the full-length hydrolyzed α2 cRNA probe to α4 mRNA, the most closely related subunit (Azam et al., 2002, Le Novere and Changeux, 1995). In this study we used a full-length, non-hydrolyzed cRNA probe to detect α2 nAChR subunit mRNA during development and in adults under highly stringent conditions which previously prevented cross-reactivity to homologous sequences (Winzer-Serhan et al., 1999). The adult hybridization pattern was identical to that previously described with strong α2 mRNA expression in the interpeduncular nucleus and in scattered cells in most brain regions, but distinct from α4 mRNA distribution (Wada et al., 1988, Goldman et al., 1987). A comparison to the hybridization pattern derived with the short α2 antisense probe revealed similar results (data not shown). However, the full-length probe greatly enhanced sensitivity and, therefore, was used in this study. To further demonstrate the specificity of the full-length probe, displacement of the radiolabled α2 antisense probe by non-labeled α2 but not α4 antisense probe also demonstrated the specificity of the full-length non-hydrolyzed α2 probe. In addition, to prevent any cross-reactivity to α4 mRNA, an excess of non-labeled full-length α4 antisense probe was added to the hybridization solution throughout the study. Taken together, the hybridization signal most likely represents hybridization to α2 nAChR subunit mRNA during development and in the adult.
4.2. Expression of nAChR α2 mRNA during development
In cortex and hippocampus, α2 mRNA expression appears postnatally, exhibiting a rapid increase in intensity and numbers of α2 positive neurons during the first postnatal week, followed by a sharp decline thereafter. This transient developmental upregulation in cortical structures has also been reported for α3, β4, α5 and α7 subunits (Adams et al., 2002, Winzer-Serhan and Leslie, 1997, 2005), suggesting a general pattern of nAChR subunit mRNA regulation, despite different transcriptional elements controlling their expression (Boyd, 1994, Bessis et al., 1993, Yang et al., 1997, Nagavarapu et al., 2001).
α2 mRNA expression was restricted to cortical layers V and hippocampal CA1 and CA3 stratum oriens with a few scattered neurons found in CA3 stratum radiatum. Coexpression studies revealed the expression of α2 mRNA generally, but not exclusively, in GABAergic interneurons in both structures in adult and developing brain. Cortical GABAergic interneurons are born and differentiate prenatally and are mostly derived from the medial ganglionic eminence from where they migrate tangentially into cortical structures (Marin and Rubenstein, 2001). Given the late onset of α2 mRNA expression after the interneurons completed their migration, α2 containing nAChRs do not seem to be involved in migration and differentiation processes of GABAergic interneurons. However, during early postnatal hippocampal and cortical development, when GABA is an excitatory neurotransmitter, GABAergic interneurons play a critical role in early network formation (Ben-Ari, 2002 and Ben-Ari et al., 2004). During this critical postnatal period, α2 mRNA expression is upregulated, indicating that α2 containing nAChRs could form and control the activity of GABAergic interneurons and GABA release.
In neonates GAD67 is also a marker for a transient population of cells in strata radiatum and oriens. These cells are considered to be pioneer cells, and are thought to be important during hippocampal network formation. (Super et al., 1998, Jiang et al., 2001). The GAD67 positive pioneer cells are very prominent during the first postnatal week and start to disappear thereafter, so that GAD67 immunoreactivity begins to resemble an adult-like pattern by P14. This transient appearance of GAD67 pioneer neurons is similar to the temporal expression pattern of α2 in CA1 stratum oriens and α2 mRNA is coexpressed with GAD during development. Thus, it is possible that α2 containing nAChRs are expressed in a subpopulation of this developmentally relevant cell population and perhaps participate in their regulation. This would explain the sharp drop-off in cell numbers expressing α2 mRNA in the hippocampus but would not explain the decline in cortex. However, it remains to be seen if α2 mRNA expressing cells undergo cell death or simply stop expressing α2 nAChR subunit mRNA.
Hippocampal interneurons are known to express different nAChRs. Depending on their electrophysiological and pharmacological properties they can be classified in at least three different receptor subtypes (Alkondon et al., 1993, Jones and Yakel, 1997, Buhler and Dunwiddie 2001). Based on results presented in this study, α2 containing nAChRs can be found in at least one subpopulation of GABAergic interneurons in cortical layer V and VI and hippocampal stratum oriens during postnatal development and in the adult. Due to the great diversity of interneurons in morphology, physiology and expression of biochemical markers (Freund and Buzsaki, 1996), it is not possible to identify different interneuronal populations based on their location in either hippocampus or cortex. However, there is a population of GABAergic interneurons located in the CA1 oriens/alveus region projecting to stratum lacunosum-moleculare (O-LM cells); a location similar to the one where α2 mRNA expressing neurons are located in postnatal and adult hippocampus. These parvalbumin and somatostatin positive O-LM cells (Klausberger et al., 2003) have a distinct physiology and are involved in generating autonomous theta frequency oscillations (Maccaferri and McBain 1996, Pike et al. 2000). Further studies are needed to verify the expression of α2 nAChR subunit mRNA in this interneuronal population, but if confirmed, α2 containing nAChRs could be important in the regulation of hippocampal theta rhythms.
4.3. Subunit composition
Expression in oocytes has revealed that α2 nAChR subunits form functional heteromeric receptors in combination with either β2 or β4 subunits (Papke et al, 1989). Given the spatial and temporal expression pattern of α2 mRNA in comparison to either β2 or β4 (Winzer-Serhan and Leslie, 1997, Zoli et al 1995), and the lack of co-detection in single cells of α2 and β4 by single cell RT-PCR (Sudweeks and Yakel, 2000), it seems likely that β2 rather than β4 will coassemble with α2 in adult and developing interneurons. In addition, it is possible that other α subunits, if expressed in the same neuron, participate in the formation of α2β2 containing pentamers, forming similarly complex structures as described before for heteromeric nAChRs (Le Novere et al 2002, Luetje, 2004). There is evidence for the expression of a developmentally regulated α2α5β2 nAChR subtype in chick (Balestra et al., 2000), a similar receptor might form in rodent brain. Other α subunits are expressed as well, for example, in CA1/CA3 stratum oriens interneurons α4 and α7 mRNAs are detected, and in cortical layer V and CA3 stratum radiatum expression of α3, α4, α5 and α7 mRNAs can be found during development (Adams et al., 2002, Sudweeks and Yakel, 2000, Winzer-Serhan and Leslie, 1997, 2005). Thus, at least in some interneurons, complex heteromeric α2 containing nAChRs seem possible. However, to date there is no evidence in rat that α2 combines with other α subunits to form functional nAChR ion channels.
It remains to be seen if functional α2 containing nAChRs are formed in cortex and hippocampus during development or in the adult. However, pharmacological and physiological analysis has revealed that α2β2 nAChRs have a relatively high affinity for nicotine and acetylcholine similar to α4β2, but have longer open time, greater peak conductance and current, and slower desensitization kinetics (Khiroug et al., 2004, Papke et al., 1989, Sudweeks and Yakel, 2000). These subtle pharmacological and electrophysiological differences can be important in tailoring the response to a cholinergic stimulus in specific cells within the diverse population of GABAergic interneurons. Nevertheless, the relatively high sensitivity to nicotine could allow nicotine to activate the transient population of α2 containing nAChRs during a developmental age when hippocampus and cortex are particularly sensitive to GABAergic stimulation. Consequently, activation of α2β2 containing nAChRs by exogenous nicotine derived from smoking could particularly influence developmental network formation.
Acknowledgments
This study was supported by NIH grant #DA016487.
Footnotes
Publisher's Disclaimer: This is a PDF file of an unedited manuscript that has been accepted for publication. As a service to our customers we are providing this early version of the manuscript. The manuscript will undergo copyediting, typesetting, and review of the resulting proof before it is published in its final citable form. Please note that during the production process errors may be discovered which could affect the content, and all legal disclaimers that apply to the journal pertain.
References
- Adams CE, Broide RS, Chen Y, Winzer-Serhan UH, Henderson TA, Leslie FM. Development of the alpha7 nicotinic cholinergic receptor in rat hippocampal formation. Dev Brain Res. 2002;193:175–187. doi: 10.1016/s0165-3806(02)00547-3. [DOI] [PubMed] [Google Scholar]
- Alkondon M, Albuquerque EX. Diversity of nicotinic acetylcholine receptors in rat hippocampal neurons. I Pharmacological and functional evidence for distinct structural subtypes. J Pharmacol Exp Ther. 1993;265:1455–1473. [PubMed] [Google Scholar]
- Azam L, Winzer-Serhan UH, Chen Y, Leslie FM. Expression of neuronal nicotinic acetylcholine receptor subunit mRNAs within midbrain dopamine neurons. J Comp Neurol. 2002;444:260–274. doi: 10.1002/cne.10138. [DOI] [PubMed] [Google Scholar]
- Balestra B, Vailati S, Moretti M, Hanke W, Clementi F, Gotti C. Chick optic lobe contains a developmentally regulated alpha2alpha5beta2 nicotinic receptor subtype. Mol Pharmacol. 2000;58:300–311. doi: 10.1124/mol.58.2.300. [DOI] [PubMed] [Google Scholar]
- Ben-Ari Y. Excitatory actions of GABA during development: the nature of the nurture. Nat Rev Neurosci. 2002;3:728–739. doi: 10.1038/nrn920. [DOI] [PubMed] [Google Scholar]
- Ben-Ari Y, Khalilov I, Represa A, Gozlan H. Interneurons set the tune of developing networks. Trends Neurosci. 2004;27:422–427. doi: 10.1016/j.tins.2004.05.002. [DOI] [PubMed] [Google Scholar]
- Boulter J, Evans K, Goldman D, Martin G, Treco D, Heinemann S, Patrick J. Isolation of a cDNA clone coding for a possible neuronal nicotinic acetylcholine receptor α-subunit. Nature. 1986;319:368–374. doi: 10.1038/319368a0. [DOI] [PubMed] [Google Scholar]
- Boulter J, O’Shea-Greenfield A, Duvoisin RM, Connolly JG, Wada E, Jensen A, Gardner PD, Ballivet M, Deneris ES, Mckinnon D, Heinemann S, Patrick J. α3, α5, and β4: three members of the rat neuronal nicotinic acetylcholine receptor-related gene family from a gene cluster. J Biol Chem. 1990;265:4472–4482. [PubMed] [Google Scholar]
- Boyd RT. Sequencing and promoter analysis of the genomic region between the rat neuronal nicotinic acetylcholine receptor beta4 and alpha3 genes. J Neurobiol. 1994;25:960–973. doi: 10.1002/neu.480250806. [DOI] [PubMed] [Google Scholar]
- Broide RS, O’Connor LT, Smith MA, Smith JA, Leslie FM. Developmental expression of alpha7 neuronal nicotinic receptor messenger RNA in rat sensory cortex and thalamus. Neuroscience. 1995;67:83–94. doi: 10.1016/0306-4522(94)00623-d. [DOI] [PubMed] [Google Scholar]
- Brussaard AB, Yang X, Doyle JP, Huck S, Role LW. Developmental regulation of multiple nicotinic AChR channel subtypes in embryonic chick habenula neurons: contributions of both the alpha2 and alpha4 subunit genes. Pflugers Arch. 1994;429:27–43. doi: 10.1007/BF02584027. [DOI] [PubMed] [Google Scholar]
- Buhler AV, Dunwiddie TV. Regulation of the activity of hippocampal stratum oriens interneurons by alpha7 nicotinic acetylcholine receptors. Neurosci. 2001;106:55–67. doi: 10.1016/s0306-4522(01)00257-3. [DOI] [PubMed] [Google Scholar]
- Corringer PJ, Le Novère N, Changeux JP. Nicotinic receptors at the amino acid level. Ann Rev Pharmacol Toxicol. 2000;40:431–458. doi: 10.1146/annurev.pharmtox.40.1.431. [DOI] [PubMed] [Google Scholar]
- Couturier S, Bertrand D, Matter JM, Hernandez MC, Bertrand S, Millar N, Valera S, Barkas T, Ballivet M. A neuronal nicotinic acetylcholine receptor subunit (alpha 7) is developmentally regulated and forms a homo-oligomeric channel blocked by alpha-BTX. Neuron. 1990;5:847–856. doi: 10.1016/0896-6273(90)90344-f. [DOI] [PubMed] [Google Scholar]
- Daubas P, Devillers-Thièry A, Geoffroy B, Martinez S, Bessis A, Changeux JP. Differential expression of the neuronal acetylcholine receptor α2 subunit gene during chick brain development. Neuron. 1990;5:49–60. doi: 10.1016/0896-6273(90)90032-b. [DOI] [PubMed] [Google Scholar]
- Dani JA. Overview of nicotinic receptors and their roles in the central nervous system. Biological Psychiatry. 2001;49:166–174. doi: 10.1016/s0006-3223(00)01011-8. [DOI] [PubMed] [Google Scholar]
- Deneris E, Connolly J, Boulter J, Wada E, Wada K, Swanson LW, Patrick J, Heinemann S. Primary structure and expression of β2: a novel subunit of neuronal nicotinic acetylcholine receptor. Neuron. 1988;1:45–54. doi: 10.1016/0896-6273(88)90208-5. [DOI] [PubMed] [Google Scholar]
- Deneris ES, Boulter J, Swanson LW, Patrick J, Heinemann S. Beta 3: a new member of nicotinic acetylcholine receptor gene family is expressed in brain. J Biol Chem. 1989;264:6268–6272. [PubMed] [Google Scholar]
- Duvoisin RM, Deneris ES, Patrick J, Heinemann S. The functional diversity of the neuronal nicotinic acetylcholine receptors is increased by a novel subunit: beta 4. Neuron. 1989;3:487–496. doi: 10.1016/0896-6273(89)90207-9. [DOI] [PubMed] [Google Scholar]
- Elgoyhen AB, Johnson DS, Boulter J, Vetter DE, Heinemann S. Alpha 9: an acetylcholine receptor with novel pharmacological properties expressed in rat cochlear hair cells. Cell. 1994;79:705–715. doi: 10.1016/0092-8674(94)90555-x. [DOI] [PubMed] [Google Scholar]
- Elgoyhen AB, Vetter DE, Katz E, Rothlin CV, Heinemann SF, Boulter J. α10: a determinant of nicotinic cholinergic receptor function in mammalian vestibular and cochlear mechanosensory hair cells. Proc Natl Acad Sci U S A. 2001;98:3501–3506. doi: 10.1073/pnas.051622798. [DOI] [PMC free article] [PubMed] [Google Scholar]
- Freund TF, Buzsaki G. Interneurons of the hippocampus. Hippocampus. 1996;6:347–470. doi: 10.1002/(SICI)1098-1063(1996)6:4<347::AID-HIPO1>3.0.CO;2-I. [DOI] [PubMed] [Google Scholar]
- Goldman D, Deneris E, Luyten W, Kochhar A, Patrick J, Heinemann S. Members of a nicotinic acetylcholine receptor gene family are expressed in different regions of the mammalian central nervous system. Cell. 1987;48:965–973. doi: 10.1016/0092-8674(87)90705-7. [DOI] [PubMed] [Google Scholar]
- Isenberg KE, Meyer GE. Cloning of a putative neuronal nicotinic acetylcholine receptor subunit. J Neurochem. 1989;52:988–991. doi: 10.1111/j.1471-4159.1989.tb02553.x. [DOI] [PubMed] [Google Scholar]
- Ishii K, Wong JK, Sumikawa K. Comparison of α2 nicotinic acetylcholine receptor subunit mRNA expression in the central nervous system of rats and mice. J Comp Neurol. 2005;493:241–260. doi: 10.1002/cne.20762. [DOI] [PMC free article] [PubMed] [Google Scholar]
- Jiang M, Oliva AA, Lam T, Swann JW. GABAergic neurons that pioneer hippocampal area CA1 of the mouse: morphologic features and multiple fates. J Comp Neurol. 2001;439:176–192. doi: 10.1002/cne.1341. [DOI] [PubMed] [Google Scholar]
- Jones S, Yakel JL. Functional nicotinic ACh receptors on interneurons in the rat hippocampus. J Physiol. 1997;504:603–610. doi: 10.1111/j.1469-7793.1997.603bd.x. [DOI] [PMC free article] [PubMed] [Google Scholar]
- Khiroug SS, Khiroug L, Yakel JL. Rat nicotinic acetylcholine receptor α2β2 channels: comparison of functional properties with α4β2 channels in Xenopus oocytes. Neuroscience. 2004;124:817–822. doi: 10.1016/j.neuroscience.2004.01.017. [DOI] [PubMed] [Google Scholar]
- Klausberger T, Magill PJ, Marton LF, Roberts JD, Cobden PM, Buzsaki G, Somogyi P. Brain-state- and cell-type-specific firing of hippocampal interneurons in vivo. Nature. 2003;421:844–848. doi: 10.1038/nature01374. [DOI] [PubMed] [Google Scholar]
- Lamar E, Miller K, Patrick J. Amplification of genomic sequences identifies a new gene, alpha6, in the nicotinic acetylcholine receptor gene family. Soc Neurosci Abstr. 1990;16:681. [Google Scholar]
- Le Novère N, Changeux JP. Molecular evolution of the nicotinic acetylcholine receptor: an example of multigene family in excitable cells. J Mol Evol. 1995;40:155–172. doi: 10.1007/BF00167110. [DOI] [PubMed] [Google Scholar]
- Le Novère N, Corringer PJ, Changeux JP. The diversity of subunit composition in nAChRs: evolutionary origins, physiologic and pharmacologic consequences. J Neurobiol. 2002;53:447–456. doi: 10.1002/neu.10153. [DOI] [PubMed] [Google Scholar]
- Luetje CW. Getting past the asterisk: the subunit composition of presynaptic nicotinic receptors that modulate striatal dopamine release. Mol Pharmacol. 2004;65:1333–1335. doi: 10.1124/mol.65.6.1333. [DOI] [PubMed] [Google Scholar]
- Maccaferri G, McBain CJ. The hyperpolarization-activated current (Ih) and its contribution to pacemaker activity in rat CA1 hippocampal stratum oriens-alveus interneurons. J Physiol. 1996;497:119–130. doi: 10.1113/jphysiol.1996.sp021754. [DOI] [PMC free article] [PubMed] [Google Scholar]
- Marin O, Rubenstein JL. A long, remarkable journey: tangential migration in the telencephalon. Nat Rev Neurosci. 2001;2:780–790. doi: 10.1038/35097509. [DOI] [PubMed] [Google Scholar]
- Naeff B, Schlumpf M, Lichtensteiger W. Pre- and postnatal development of high-affinity [3H]nicotine binding sites in rat brain regions: an autoradiographic study. Brain Res Dev Brain Res. 1992;68:163–174. doi: 10.1016/0165-3806(92)90058-5. [DOI] [PubMed] [Google Scholar]
- Nagavarapu U, Danthi S, Boyd RT. Characterization of a rat neuronal nicotinic acetylcholine receptor alpha7 promoter. J Biol Chem. 2001;276:16749–16757. doi: 10.1074/jbc.M009712200. [DOI] [PubMed] [Google Scholar]
- Papke RL, Boulter J, Patrick J, Heinemann S. Single-channel currents of rat neuronal nicotinic acetylcholine receptors expressed in Xenopus oocytes. Neuron. 1989;3:589–596. doi: 10.1016/0896-6273(89)90269-9. [DOI] [PubMed] [Google Scholar]
- Paxinos G, Watson C. The rat brain in sterotaxic coordinates. 4. San Diego, CA: Academic Press; 1998. [Google Scholar]
- Pike FG, Goddard RS, Suckling JM, Ganter P, Kasthuri N, Paulsen O. Distinct frequency preferences of different types of rat hippocampal neurons in response to oscillatory input currents. J Physiol. 2000;529:205–213. doi: 10.1111/j.1469-7793.2000.00205.x. [DOI] [PMC free article] [PubMed] [Google Scholar]
- Sargent PB. The diversity of neuronal nicotinic receptors. Ann Rev Neurosci. 1993;16:403–443. doi: 10.1146/annurev.ne.16.030193.002155. [DOI] [PubMed] [Google Scholar]
- Schuetze SM, Role LW. Developmental regulation of nicotinic acetylcholine receptors. Annu Rev Neurosci. 1987;10:403–457. doi: 10.1146/annurev.ne.10.030187.002155. [DOI] [PubMed] [Google Scholar]
- Seguela P, Wadiche J, Dineley-Miller K, Dani JA, Patrick JW. Molecular cloning, functional properties and distribution of rat brain α7: a nicotinic cation channel highly permeable to calcium. J Neurosci. 1993;13:596–604. doi: 10.1523/JNEUROSCI.13-02-00596.1993. [DOI] [PMC free article] [PubMed] [Google Scholar]
- Sudweeks SN, Yakel JL. Functional and molecular characterization of neuronal nicotinic ACh receptors in rat CA1 hippocampal neurons. J Physiol. 2000;527.3:515–528. doi: 10.1111/j.1469-7793.2000.00515.x. [DOI] [PMC free article] [PubMed] [Google Scholar]
- Supér H, Martinez A, Del Rio JA, Soriano E. Involvement of distinct pioneer neurons in the formation of layer-specific connections in the hippocampus. J Neurosci. 1998;18:4616–4626. doi: 10.1523/JNEUROSCI.18-12-04616.1998. [DOI] [PMC free article] [PubMed] [Google Scholar]
- Wada K, Ballivet M, Boulter J, Connolly J, Wada E, Deneris ES, Swanson LW, Heinemann S, Patrick J. Functional expression of a new pharmacological subtype of brain nicotinic acetylcholine receptor. Science. 1988;240:330–334. doi: 10.1126/science.2832952. [DOI] [PubMed] [Google Scholar]
- Wada E, Wada K, Boulter J, Deneris E, Heinemann S, Patrick J, Swanson LW. Distribution of alpha2, alpha3, alpha4, and beta2 neuronal nicotinic receptor subunit mRNAs in the central nervous system: A hybridization histochemical study in the rat. J Comp Neurol. 1989;284:314–335. doi: 10.1002/cne.902840212. [DOI] [PubMed] [Google Scholar]
- Winzer-Serhan UH, Broide RS, Chen Y, Leslie FM. Highly sensitive radioactive in situ hybridization using full-length hydrolyzed riboprobes to detect alpha2 adrenoceptor subtype mRNAs in adult and developing rat brain. Brain Res Brain Res Protoc. 1999;3:229–241. doi: 10.1016/s1385-299x(98)00043-9. [DOI] [PubMed] [Google Scholar]
- Winzer-Serhan UH, Leslie FM. Codistribution of nicotinic acetylcholine receptor subunit alpha3 and beta4 mRNAs in adult and developing rat brain. J Comp Neurol. 1997;386:540–554. doi: 10.1002/(sici)1096-9861(19971006)386:4<540::aid-cne2>3.0.co;2-2. [DOI] [PubMed] [Google Scholar]
- Winzer-Serhan UH, Leslie FM. Expression of α5 nicotinic acetylcholine receptor subunit mRNA during hippocampal and cortical development. J Comp Neurol. 2005;481:19–30. doi: 10.1002/cne.20357. [DOI] [PubMed] [Google Scholar]
- Yang X, Yang F, Fyodorov D, Wang F, McDonough J, Herrup K, Deneris E. Elements between protein-coding regions of the adjacent beta4 and alpha3 acetylcholine receptor genes direct neuron-specific expression in the central nervous system. J Neurobiol. 1997;32:311–324. [PubMed] [Google Scholar]
- Zoli M, Le Novère N, Hill JA, Jr, Changeux JP. Developmental regulation of nicotinic Ach receptor subunit mRNAs in the rat central and peripheral nervous system. J Neurosci. 1995;15:1912–1939. doi: 10.1523/JNEUROSCI.15-03-01912.1995. [DOI] [PMC free article] [PubMed] [Google Scholar]


