

Abstract
Analyzing the status of T-cell receptor (TCR) gene rearrangements has been an essential part of deciphering the stages of thymocyte development, understanding the αβ vs. γδ lineage decision, and characterizing T-cell leukemias. Methods such as PCR and quantitative Southern blotting provide useful information, but also have significant shortcomings such as lack of quantitation in the case of PCR and technical challenges in the case of Southern blotting. Here we describe a real-time PCR method that overcomes many of these shortcomings. This new method shows comparable results for the fraction of unrearranged TCRγ and TCRβ genes in human thymocytes and peripheral blood T cells as Southern blotting, and has the advantages of being simple to perform, highly quantitative, and requiring nanogram quantities of DNA. We also describe a real-time PCR method to quantitate T-cell receptor excision circles formed during TCRβ rearrangements.
Keywords: Real-time PCR, Quantitative Southern blot, T-cell receptor gene rearrangement, T-cell receptor excision circle
1. Introduction
Rearrangement of T-cell receptor (TCR) genes is an important part of thymocyte development. In addition to expression patterns of cell surface markers and lymphocyte specific genes (i.e., RAG-1, RAG-2, transcription factors, etc.), the status of TCR gene rearrangements helps define developmental stages. In both mouse and human thymocyte development, rearrangement of the TCRδ locus is initiated first, followed by TCRγ, β, and then α (Petrie et al., 1995; Blom et al., 1999; Livák et al., 1999). Cells expressing one of the two T-cell receptors, αβ or γδ, emerge following the completion of rearrangements and selection events. A vast TCR repertoire is created during rearrangement because each locus contains multiple variable (V), diversity (D, in δ and β loci), and joining (J) segments, that are joined together by V(D)J recombination in many possible combinations to form single exons (Bassing et al., 2002). In addition to defining developmental stages (Nakajima et al., 1995; Petrie et al., 1995; Blom et al., 1999; Livák et al., 1999), the study of TCR gene rearrangements has been used to help decipher the mechanism for the αβ vs. γδ lineage decision (Livák et al., 1995; Burtrum et al., 1996; Wilson et al., 1996; Margolis et al., 1997) and for characterization of leukemias (Hettinger et al., 1998; Pongers-Willemse et al., 1998; Langerak et al., 1999; Szczepanski et al., 2000; Valetto et al., 2000; van der Velden et al., 2002; Asnafi et al., 2003; Bruggemann et al., 2004).
Some of the techniques used to study TCR gene rearrangements up to this point have significant shortcomings. For example, PCR has been used to identify genes rearranged in various populations of cells (Wilson et al., 1996; Margolis et al., 1997; Blom et al., 1999; Livák et al., 1999), and while this method is highly sensitive, it is not truly quantitative. Several variations of quantitative Southern blotting have also been used extensively (Petrie et al., 1995; Blom et al., 1999; Livák et al., 1999; Valetto et al., 2000). In one version, a probe was designed to bind to a restriction fragment that changed size upon TCR gene rearrangement (Blom et al., 1999). Thus, the extent of gene rearrangement was assessed by the decrease in intensity of one band coupled with the appearance of new bands. In another version, a probe was designed to bind to a restriction fragment that was deleted during gene rearrangement (Petrie et al., 1995). In this case, the extent of rearrangement was determined by the loss of signal. Both Southern blotting methods are technically challenging and require a large amount of DNA to allow for accurate quantitation of the signals.
The most advantageous method to accurately assess the overall status of gene rearrangements would require only a small amount of DNA, use a simple protocol, and generate an easily quantitated signal. Real-time PCR is a technique that fulfils these experimental criteria. No restriction enzyme digestion is required and much less DNA is needed to detect a signal as compared to Southern blots. With real-time PCR, the signal is measured at the completion of each cycle during the logarithmic phase of the PCR, yielding a much more quantitative result. This method is easily applied to an analysis of the rearrangement status in rare cell populations that would require highly sensitive quantitation. Real-time PCR protocols have been designed for the detection of minimal residual disease in leukemia patients (Pongers-Willemse et al., 1998; Donovan et al., 2000; van der Velden et al., 2002; Bruggemann et al., 2004), for the study of complementarity-determining region variations among TCRβ rearrangements (Gallard et al., 2002), and for the detection of δ locus excision circles (TRECs) (Hazenberg et al., 2000; Ponchel et al., 2003). We show here a comparison between quantitative Southern blot analysis analogous to that developed by Petrie and colleagues (Petrie et al., 1995) and real-time PCR to determine the overall extent of TCR Vγ→Jγ and Vβ→DJβ rearrangements in human T lineage cells. In addition, a real-time PCR method to detect the presence of β TRECs and their contribution to the germline signal is also described.
2. Materials and methods
2.1. Antibodies and cell isolations
Antibodies to CD3, CD4, and CD8α were purchased from Caltag (Burlingame, CA); anti-CD8β was from Serotec (Raleigh, NC). Human neonatal thymus was obtained from infants and children undergoing cardiac surgery at Children’s Hospital in Oklahoma City, OK. Protocols were approved by the Institutional Review Boards of both The University of Oklahoma Health Sciences Center and The Oklahoma Medical Research Foundation. Thymocyte cell suspensions were made by forcing thymic tissue pieces though a 70-μm nylon filter. CD4 immature single positive cells (CD4 ISPs) were isolated using a two-step procedure. Thymocyte suspensions were first depleted of CD3+ cells using EasySep CD3 magnetic beads (Stem Cell Technologies; Vancouver, Canada), followed by depletion of CD8α+ cells using EasySep CD8 beads. The unbound fraction was then stained for CD4, CD8α, and CD3 expression and CD4 ISPs were isolated by sorting for CD4+CD3−CD8α− cells. Early double positive cells (EDPs) were isolated from the CD8α bead bound fraction of cells (see above) by staining with antibodies to CD8α, CD8β, CD3 and CD4, then sorting for CD4+CD8α+β−CD3− cells. Adult peripheral blood was obtained from healthy volunteers. Enriched preparations of T cells (84–95% purity as assessed by staining with anti-CD3 antibodies) were isolated from peripheral blood by Ficoll-Hypaque (Cellgro Mediatech Inc.; Herndon, VA) density gradient centrifugation, followed by rosetting with sheep red blood cells (Ferrell Farms; Oklahoma City, OK) (West et al., 1977). The HeLa cervical carcinoma cell line was obtained from the American Type Culture Collection (Manassas, VA) and used as a source of germline DNA in Southern blot and real-time PCR experiments. HeLa cells were grown in DMEM containing 10% FCS, 2 mM glutamine, 100 U/ml penicillin and 100 μg/ml streptomycin.
2.2. Probes and primers
PCR primers were obtained from the Molecular Biology Resource Facility at the University of Oklahoma Health Sciences Center (Oklahoma City, OK). Probes for quantitative Southern blot analysis (V-JγSB, V-DJβSB, and Cβ2SB) were amplified and cloned from 200 ng of HeLa cell DNA by PCR using 16 mM (NH4)2SO4, 67 mM Tris–HCl, pH 8.8, 0.01% Tween-20, 1.5 mM MgCl2, 0.8 mM dNTPs, 0.5 μg each forward and reverse primer, and 5U Taq DNA Polymerase (Continental Laboratory Products; San Diego, CA) in a 50-μl reaction. Cycling conditions were: initial denature at 94 °C for 5 min, followed by 30 cycles of 94 °C for 30 s, 60 °C for 30 s, and 72 °C for 30 s, followed by a final elongation of 5 min at 72 °C. Products were cloned using the TOPO TA cloning kit (Invitrogen Life Technologies; Carlsbad, CA), and sequenced. The probes were then generated by PCR amplification using the cloned plasmid as the template and purified by agarose gel electrophoresis and gel extraction using a Qiagen gel purification kit (Valencia, CA). Table 1 shows the sequences for all primers used in making the Southern blot probes. Probes for real-time PCR (V-Jγtaq, V-DJβtaq, Cβ2taq, and β TRECtaq) were purchased from PE Applied Biosystems (Foster City, CA) and Sigma Genosys (Haverhill, United Kingdom); sequences for real-time PCR probes and primers are shown in Table 2. The 5′ ends of the V-Jγtaq, V-DJβtaq, and β TRECtaq probes were labeled with the 6-FAM reporter dye and the 5′ end of the Cβ2taq probe was labeled with the VIC reporter dye; each probe was 3′ end-labeled with the TAMRA quencher dye. Fig. 1 shows the organization of the human TCRγ and β loci and the locations of the Southern blot and real-time PCR deletion probes for the γ and β loci (V-JγSB and V-Jγtaq, V-DJβSB and V-DJβtaq), as well as probes that bind to Cβ2 (Cβ2SB and Cβ2taq).
Table 1.
Primers for Southern blot probes and signal joint PCR amplifications
| Name | Forward primer sequence | Reverse primer sequence | Size (bp) |
|---|---|---|---|
| V-JγSB | AGATCCACATTCAACCCACA | GGAAGTGTGTGCTTGATGCC | 895 |
| V-DJβSB | TGGCCACAGGAGGTCGGTTT | TCCGATGGAGTTTGTCCCAG | 507 |
| Cβ2SB | ATGGGAGGATGGAGACAACC | GAGGACTTCCATCAGGATGA | 508 |
| Vβ2-SJ | GACATCCAGCTCTAAGGAGC | TCCCCTCTCAGCACTCA | 310 |
| Vβ4-SJ | GACATCCAGCTCTAAGGAGC | GCCTTCAGGCTCGTGTG | 304 |
| Vβ22-SJ | GACATCCAGCTCTAAGGAGC | GCACAGGCTGGAGTTGT | 254 |
SB designates primer sequences for the preparation of Southern blot probes and SJ designates primer sequences for the amplification of signal joints involving V→DJβ1 rearrangements using the indicated Vβ gene segments.
Table 2.
Primers and probes for real-time PCR amplicons
| Name | Probe sequence | Forward primer sequence | Reverse primer sequence | Size (bp) |
|---|---|---|---|---|
| V-Jγtaq | ATGGATCCTCTTCCCGGCTTCTGC | GGCATTAGATGATCCACCGACAAG | AAAGAATTTAGAGCAGTGCCCAAGA | 129 |
| V-DJβtaq | TCTCCCGGTCTCCCACCCGC | ACACGTGAAATGCTCTTTGCG | TTACTCCTGCGCCTCTGTGTC | 68 |
| Cβ2taq | CTTGTGCCAGCATCGCAGCAATCT | TGGCTTCTGGCACTCCTTG | GCCATGTGAAGACAGAGGCA | 65 |
| β TRECtaq | TGCTCTGGTGGTCTCCTCCCA | CGCTGTGCACAATGTTAC | CCACTCCCCTCAAAGG | 106 |
Fig. 1.
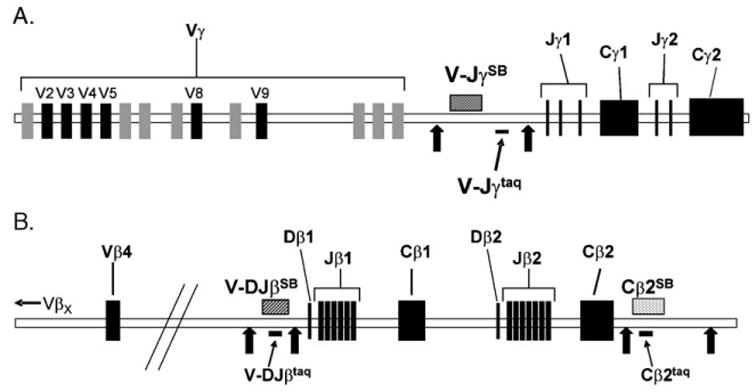
Locations of Southern blot probes and real-time PCR amplicons. The genomic organizations of the human TCRγ (A) and β (B) loci are shown as well as the locations of the Southern blot probes (SB) and real-time PCR amplicons (taq). The black arrows represent EcoRI sites. The black rectangles represent functional V, D, or J genes, while the gray segments represent pseudogenes (for the γ locus). Only the most proximal Vβ segment (Vβ4) is represented on the β locus schematic, with distal Vβ genes (VβX) denoted with an arrow upstream.
2.3. Quantitative Southern blotting
Genomic DNA was isolated with the Puregene Kit (Gentra Systems; Minneapolis, MN) according to the manufacturer’s instructions. For each Southern blot lane, 15 μg of genomic DNA were digested overnight at 37 °C with 100 units of EcoRI (Promega; Madison, WI) in a 200-μl reaction with 90 mM Tris–HCl, pH 7.5, 10 mM MgCl2, 50 mM NaCl, 4 mM spermidine, and 0.1 mg/ml BSA. Digested DNA was ethanol precipitated, dissolved in TE, and electrophoresed on a 0.7% agarose gel with 1–TBE (0.9 M Tris+0.9 M Borate +2 mM EDTA) running buffer for at least 24 h at 25 V. The DNA was transferred onto a Hybond-N+ nylon membrane (Amersham Biosciences; Buckinghamshire, England) using a model 785 Vacuum Blotter (Bio-Rad Laboratories; Hercules, CA) for 90 min with 5 in of Hg vacuum pressure. Fifty nanograms of each probe were labeled with 50 μCi of [α-32P]dCTP (3000 Ci/mmol; ICN Biomed; Irvine, CA) using random hexamers and a Klenow labeling kit from Amersham Biosciences; DNA was hybridized with 3–5–107 cpm of each probe for 16–24 h at 65 °C in 10 ml of 4–SSC (600 mM sodium chloride +660 mM sodium citrate, pH 7.0)+1% SDS+5–Den-Denhardt’s solution +0.1 mg/ml denatured herring sperm DNA. Blots were washed two times with 2 –SSC + 0.1% SDS and two times with 0.2–SSC+0.1% SDS for 20 min each at 65 °C. Washed blots were scanned with a Storm Scanner 840 phosphor-imager and the signal intensities were quantitated with ImageQuaNT software (version 5.2, Amersham Biosciences). The percent of DNA remaining in germline configuration was calculated by the formula: ([Xt(Cg/Ct)]/Xg)–100, where X represents the intensity of the various deletion probes (V-JγSB or V-DJβSB), C represents the intensity of β constant region probe (Cβ2SB), and g and t represent germ-line (HeLa) or thymocyte/T-cell DNA samples, respectively. Background correction was done by analyzing the area just above and below each band and subtracting the average of those two signals from the signal of the band.
2.4. Real-time PCR
Real-time PCRs were run on an ABI Prism 7700 Sequence Detection System under universal conditions (unless otherwise indicated) using reagents obtained from PE Applied Biosystems. For quantitation of the V-Jγtaq, V-DJβtaq, and Cβ2taq amplicons, each 50 μl reaction contained 25 μl universal master mix, 5–15 ng of DNA, 200 or 450 ng of each specific forward and reverse primer, and 0.2 μM of one of the following 3 TaqMan® probes: V-Jγtaq, V-DJβtaq, or Cβ2taq (Table 2). Each DNA sample was analyzed in triplicate at each of two concentrations for each primer/probe set.
HeLa DNA was used to generate standard curves (CT vs. log copy number) for the Cβ2taq, V-Jγtaq, and V-DJβtaq amplicons. To determine the number of copies of each target sequence in a given aliquot of HeLa DNA, a linearized plasmid containing the sequence of the Cβ2taq amplicon was used to construct a standard curve of CT vs. log copy number. The concentration of restriction digested, linearized plasmid DNA was determined using the Agilent 2100 BioAnalyzer with a DNA 7500 Lab Chip kit (Agilent Technologies; Palo Alto, CA). A standard set of dilutions was prepared in TE (10 mM Tris, pH 8.0+1 mM EDTA) containing 50 μg/ml yeast tRNA as carrier and frozen at −80°C in aliquots. The number of Cβ2 copies in each dilution was calculated. These dilutions yielded CT signals in the acceptable range (25–35) as defined by the manufacturer. Stability was verified by repeated real-time PCR assays on thawed aliquots. Real-time PCR assays were then performed with dilutions of HeLa genomic DNA that generated CT values in the same range as those obtained with the plasmid. The efficiencies of Cβ2taq amplification from plasmid DNA and HeLa genomic DNA were essentially identical (the slopes of log ng vs. CT values of the standard curves were −3.45 for plasmid and −3.42 for HeLa) (Fig. 2). Therefore, the plasmid standard curve was used to determine the concentration of HeLa genomic DNA in copies/100 ng DNA. Since HeLa cells contain only unrearranged genomic DNA, the number of copies of Cβ2 sequences was assumed to be equal to the numbers of copies of unrearranged V-Jγ and V-DJβ sequences. A set of diluted HeLa genomic DNA was then prepared and used to generate standard curves for the analyses of Cβ, V-Jγ, and V-DJβ copy numbers in genomic DNA isolated from thymocytes or enriched peripheral blood T cells. The percent of TCRγ locus remaining in germline configuration was calculated by the following formula: [(copies V-Jγ/copies Cβ2)(100)]. The percent of TCRβ locus remaining in germline configuration was calculated by a similar formula: [(copies V-DJβ1/copies Cβ2)(100)].
Fig. 2.
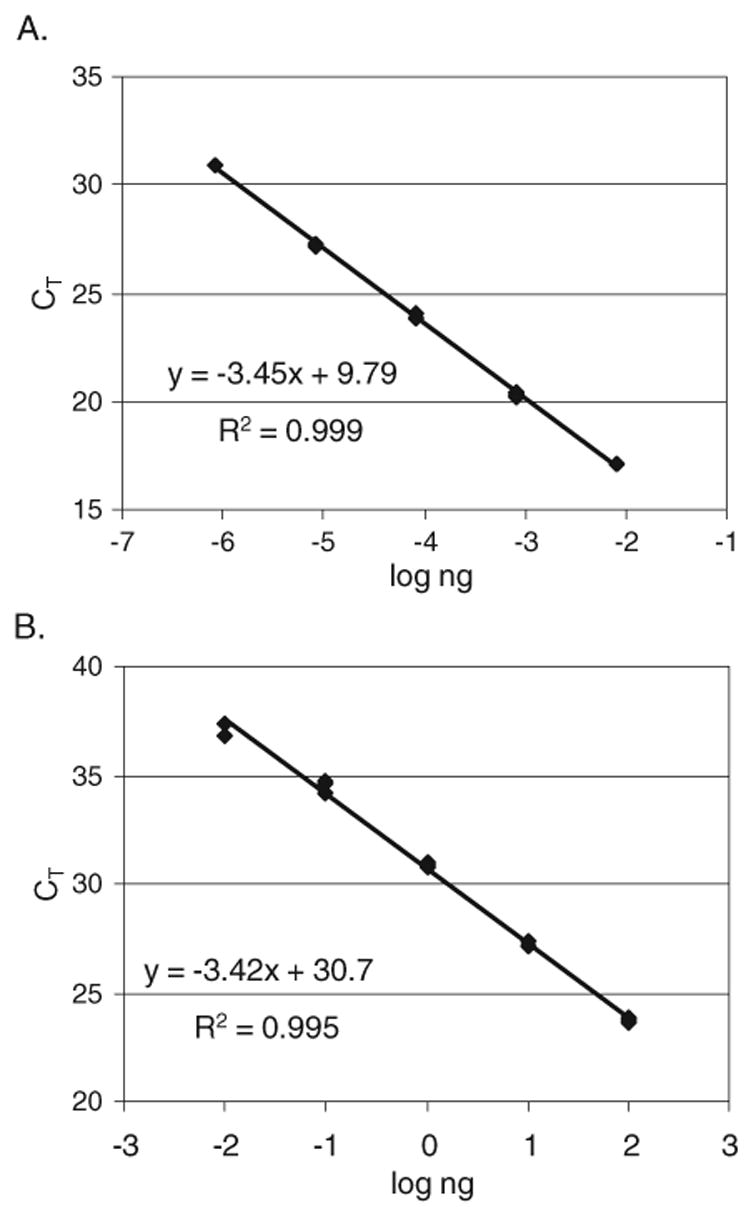
Standard curves for the Cβ2taq real-time PCR amplicon. Real-time PCR was performed with DNA from a Cβ2-containing plasmid (A) and HeLa genomic DNA (B) using primers and probes for the Cβ2taq amplicon (see Table 1). The slopes of the standard curves are −3.45 for the plasmid and −3.42 for HeLa genomic DNA, indicating a similar efficiency for amplification from each source of DNA.
2.5. Analysis of V-DJβ1 signal joints in human early double positive thymocytes
Signal joints from Vβ→DJβ1 rearrangements in EDP thymocytes were amplified by PCR using primers 5′ to Dβ1 and 3′ to Vβ2, Vβ4, and Vβ22 (Vβ segments that are used frequently). The PCR products were cloned into the TA cloning vector pCR2.1 (Invitrogen) and sequenced by the Oklahoma Medical Research Foundation DNA Sequencing Core. The primer sequences are included in Table 1.
2.6. β TREC detection
A method was developed to measure the levels of TCR βTRECs similar to that described in Hazenberg et al. (2000) and Ponchel et al. (2003) for detecting the excision of the δ locus. First, a plasmid was constructed containing a consensus signal joint formed by the joining of any human Vβ segment to any DJβ1 segment (Fig. 3). The concentration of this plasmid was determined as above, and a standard dilution set was prepared as for the Cβ2-containing plasmid. These dilutions were used to generate a standard curve of CT vs. log copy number. PCR conditions were adjusted to insure that only consensus signal joints could be amplified. This was accomplished by performing real-time PCRs with plasmids containing signal joints with 1, 2, 4, 9, and 17 added bases and entailed raising the annealing temperature 2° above that for universal conditions. Because of the stringent conditions for primer annealing, this assay is very sensitive to slight temperature variations in the block of the real-time PCR instrument. The slope of the CT vs. log copy number plot was similar for the consensus signal joint containing plasmid (−4.49) as for thymocyte genomic DNA (−4.29), making it possible to use the plasmid standard curve to calculate the numbers of β TREC copies in the genomic DNA samples. The amount of genomic DNA in each real-time PCR was increased to 50–150 ng when necessary to compensate for the low copy numbers of β TRECs in some of our samples. All genomic DNA samples were analyzed in quadruplicate at each of two concentrations. Because our real-time PCR β TREC assay amplified only TRECs containing consensus heptamer/heptamer signal joints from the Dβ1 locus, the number of copies was multiplied by 3.4 to obtain an estimate of the total number of TRECs containing both consensus and nonconsensus heptamer/heptamer signal joints to both Dβ1 and Dβ2 (see Section 3.4). The number of copies of germline V-DJβ sequences was calculated by subtracting the total number of β TREC copies from the number of copies measured in the V-DJβ real-time PCR assay (see above). When the β TRECtaq primers were used with HeLa DNA, the level of β TRECs detected was 1–2 orders of magnitude less than that detected with thymus or T-cell DNA, suggesting little non-specific amplification of unrearranged DNA.
Fig. 3.
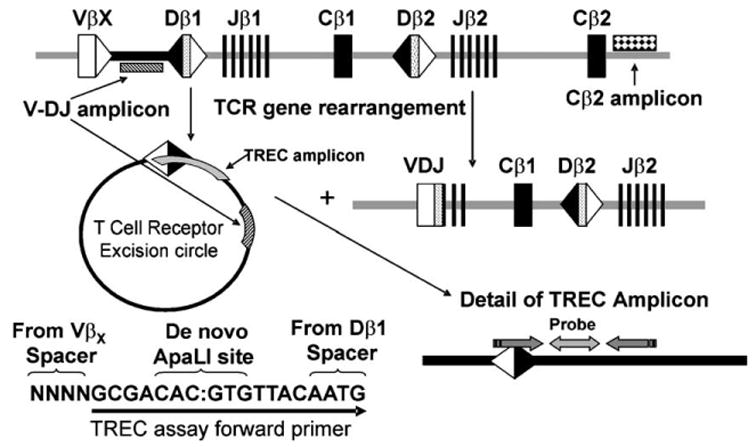
Real-time PCR assay for the detection of β T-cell receptor excision circles. The organization of the human TCRβ locus is shown, including DNA that has undergone V→DJβ1 rearrangement. The locations of the V-DJβtaq and β TRECtaq amplicons are shown, as well as the locations of primers to detect signal joints in β TRECs.
3. Results
3.1. Rationale for probe design for quantitative Southern blot and real-time PCR assays
Following the strategy of Petrie et al. (1995), we designed Southern blot and real-time PCR deletion probes (Fig. 1) to bind to the regions of DNA between the most J-proximal Vγ (Vγ11) and the most V-proximal Jγ (Jγ1.1) (V-JγSB and V-Jγtaq, Fig. 1A) and between the most D-proximal Vβ (Vβ4) and the most V-proximal Dβ (Dβ1) (V-DJβSB and V-DJβtaq, Fig. 1B). These regions are excised during TCRγ and β gene rearrangements (Bassing et al., 2002). The fraction of each locus in germline configuration can then be calculated by comparing the signal from the deletion probe to the signal of a probe binding to a region of DNA that does not undergo rearrangement and then normalizing to signals from control germline HeLa DNA. Therefore, a probe binding to the constant region of the β locus (Cβ2) was included in the analyses (Cβ2SB and Cβ2taq, Fig. 1B).
3.2. TCRγ and TCRβ rearrangements as detected by quantitative Southern blot
Human thymocytes and enriched T cells from peripheral blood were analyzed by Southern blot for the percentages of V→J rearrangements at the γ locus and V→DJ rearrangements at the β locus. In order to quantitate the results, a germline signal was obtained for all probes by including HeLa cell genomic DNA. Fig. 4 shows a representative blot. Table 3 shows that 15±14% (mean±S.D., individual values: 8.7, 31, 6.6) and 29±4% (mean±S.D., individual values: 27, 34, 27) of the γ locus was in germline configuration in the human thymocyte and enriched T-cell samples, respectively. The corresponding numbers for the β locus are: 42±7% (mean±S.D., individual values: 39, 50, 37) and 46±5% (mean±S.D., individual values: 42, 51, 44). It is important to note that the T cells were not pure populations. When the data are expressed as % rearranged (rather than % germline remaining) and corrected for T-cell purity, the analyses show that the TCRγ and β loci were 78±1% and 56±8% rearranged, respectively.
Fig. 4.
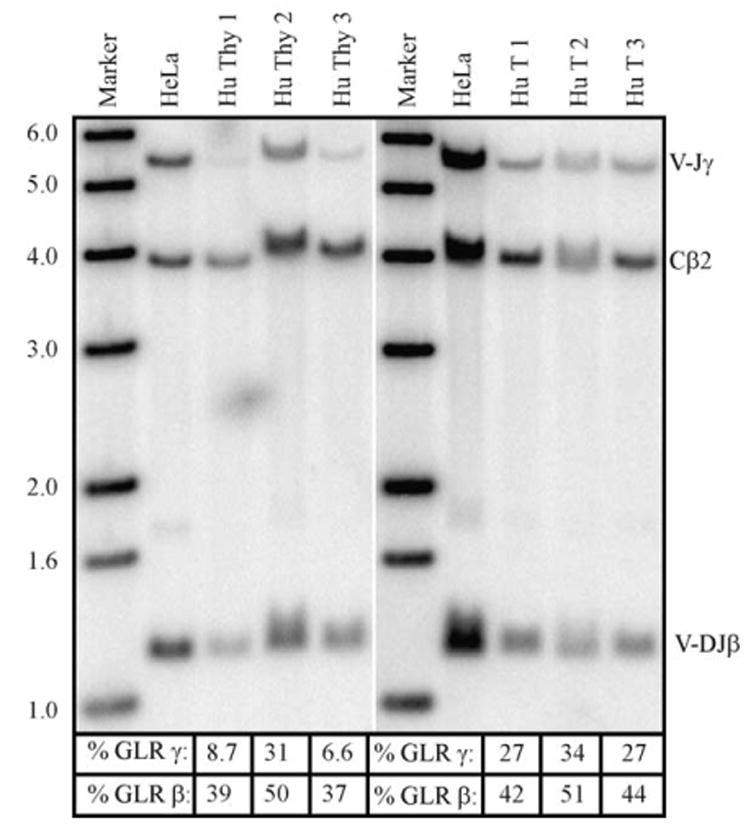
Quantitative Southern blot for TCRγ and β gene rearrangements in human thymocytes and T cells. Fifteen micrograms of genomic DNA from HeLa (lanes 2 and 7), human thymocytes (lanes 3–5), or peripheral blood T cells (lanes 8–10) were digested with EcoRI and subjected to Southern blotting as described in Materials and methods. The V-JγSB probe binds to a 5.5 Kb EcoRI fragment, the Cβ2SB control probe to a 3.8 Kb EcoRI fragment, and the V-DJβ1SB probe to a 1.3 Kb EcoR I fragment. The calculated % germline remaining for the γ and β loci for each isolate is shown below the blot.
Table 3.
Percent germline DNA remaining at the TCRγ and β loci as determined by real-time PCR and quantitative Southern blottinga
| DNA source | TCRγ Southern blot (%) | TCRγ Real-time PCR (%) | TCRβ Southern blot (%) | TCRβ Real-time PCR (%) |
|---|---|---|---|---|
| Thymus 1 | 8.7 | 7.2 | 39 | 36 |
| Thymus 2 | 31 | 28 | 50 | 46 |
| Thymus 3 | 6.6 | 6.0 | 37 | 34 |
| Mean | 15±14 | 14±13 | 42±7 | 39±6 |
| T cells 1 | 27 | 28 | 42 | 42 |
| T cells 2 | 34 | 30 | 51 | 43 |
| T cells 3 | 27 | 22 | 44 | 39 |
| Mean | 29±4 | 26±4 | 46±5 | 41±2 |
The percent germline remaining of the human TCRγ and β loci as assessed by quantitative Southern blotting and real-time PCR are presented and compared. See Materials and methods for formulas used to calculate the percent germline remaining in each assay.
It is also important to note that the fractions of the TCRγ and β loci remaining in germline configuration were significantly higher in thymus #2 than in the other two thymuses. This can be explained by the fact that this thymus had an abnormally high percentage of immature CD4−CD8− cells (14% compared to a more common value of 1–2%) and a depletion of CD4+CD8+ (double positive, DP) cells (not shown). Since DP cells normally constitute 75–90% of thymus and contain the majority of the TCR gene rearrangements, the overall extent of TCR genes remaining in germline configuration would be expected to be higher, consistent with the data.
3.3. Comparison of real-time PCR and quantitative Southern blot analysis for the detection of TCRγ and TCRβ rearrangements
The DNA isolates used in the Southern blot in Fig. 4 were also analyzed by real-time PCR using TaqMan® probes. Table 3 shows the percentages of germline γ and β DNA detected by real-time PCR compared to Southern blotting. Fig. 5 shows plots of percentages of germline DNA detected by real-time PCR vs. Southern blotting, including values for 7 samples of purified αβ cells and 2 samples of purified γδ cells in addition to the 6 samples described in Table 3. Correlation coefficients of 0.94 for γ rearrangements and 0.98 for β rearrangements demonstrate that our real-time PCR method detects comparable amounts of unrearranged γ and β loci as Southern blotting. It should be noted that this method is useful only for determining the overall extent of gene rearrangements, not for accessing the rearrangement of specific gene segments. However, it would certainly be possible to modify this method to assess the rearrangement of a specific gene segment if so desired.
Fig. 5.
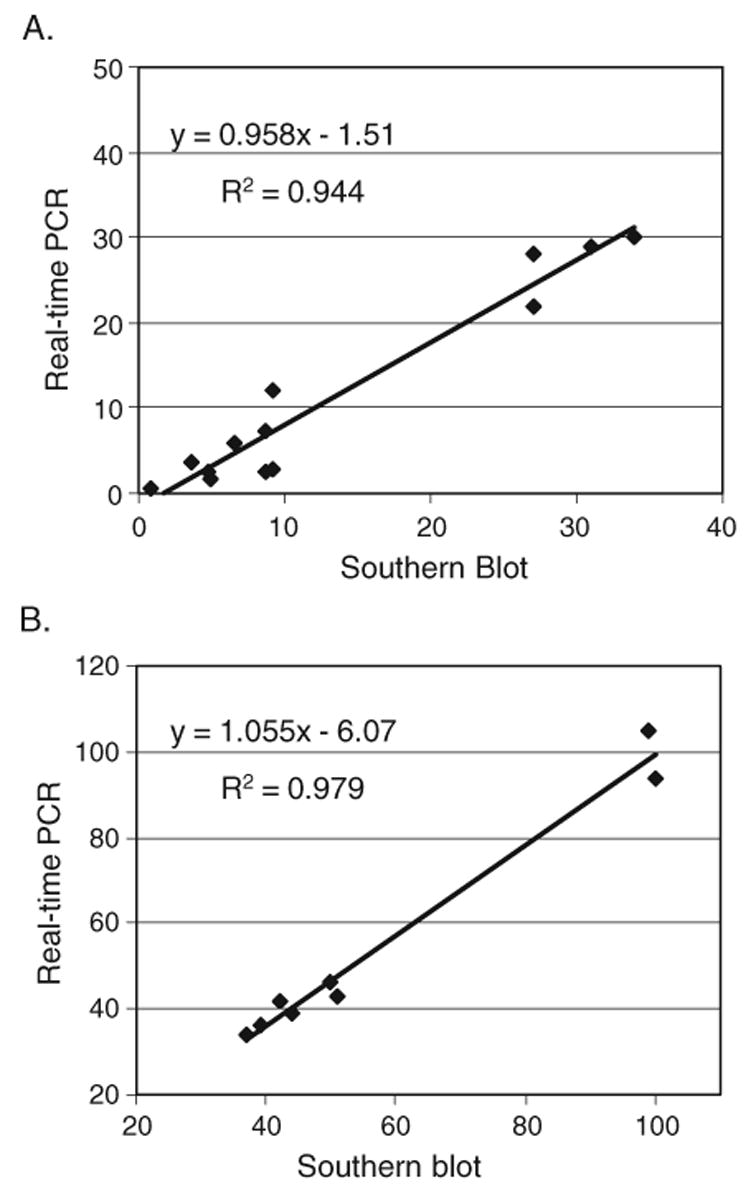
Correlation of percent germline γ and β loci remaining as determined by Southern blotting vs. real-time PCR. The percent germline DNA remaining at the TCRγ (A) and β (B) loci as determined by real-time PCR (y-axis) are plotted against results assessed by quantitative Southern blotting (x-axis). The DNA samples are the same six as described in Table 3, as well as 7 samples from purified αβ T cells (A) and 2 samples of purified γδ T cells (B). The correlation coefficients (R2) are shown for each line.
3.4. Detection of TCRβ TRECs
Since DNA that is excised during V(D)J recombination can remain intact as a TREC, we considered the possibility that TRECs might be contributing to the germline signal detected in both our Southern blots and real-time PCRs. Indeed, TRECs derived from TCRβ rearrangements have been shown to persist in the early cell populations in murine thymus by a Southern blot assay that takes advantage of a new ApaLI site generated during V(D)J recombination (Petrie et al., 2000). Therefore, we first attempted to detect β TRECs in humans by an analogous strategy. However, due to the lack of sensitivity of the method, we were unable to detect significant levels of β TRECs. Therefore, we devised a real-time PCR strategy (Fig. 3) taking advantage of the consensus sequence generated by the joining of two recombination signal sequences (RSSs) during TCR Vβ→DJβ1 rearrangement. Using one primer designed to bind to the recombined signal joint RSS heptamer/heptamer junction, and a second primer and probe designed to hybridize just upstream of the Dβ1 region of the TCRβ locus, the PCR described here will amplify TRECs with consensus signal joints generated by the rearrangement of any Vβ to any DJβ1. Unlike TRECs formed during the deletion of the δ locus that all contain the same signal joint sequence and therefore can be measured easily by real-time PCR (Hazenberg et al., 2000; Ponchel et al., 2003), TRECs formed during TCR Vβ→DJβ1 rearrangement often have bases deleted or inserted into the signal joint. As our real-time β TREC PCR does not amplify nonconsensus signal joints, we had to determine what percentage of Vβ→Dβ1 signal joints contained canonical heptamer/heptamer junctions. To do this, we cloned and sequenced signal junctions from Vβ→Dβ1 rearrangements in purified EDP thymocytes using primers 5′ to Dβ1 and 3′ to Vβ2, Vβ4, and Vβ22 (Vβ segments that are used frequently). We determined that 44% of the amplified Dβ1 signal joints contained canonical heptamer/ heptamer joins, while the majority of the remainder contained inserted bases; a minority (4.5% or 5/111) had bases deleted. Making the assumption that the remaining Vβ genes make the same percentage of consensus heptamer/heptamer joins upon rearrangement, we therefore estimate that we should be able to amplify 44% of the β TRECs made from all Vβ→Dβ1 rearrangements. Therefore, the number of TRECs detected must be multiplied by 2.3 (100÷44) in order to obtain the true number of Vβ→Dβ1 TRECs. In principle, the same type of experiments could be performed to determine the percentage of Vβ→Dβ2 β TRECS detectable by our TREC real-time PCR. However, because the percentage of TRECs appears to be so low, we made the simple assumption that the percentage of detectable Vβ→Dβ2 TRECs will be similar to that for Vβ→DJβ1 TRECs. We also made the simplifying assumption that 2/3 of TCR Vβ rearrangements utilize Dβ1 and 1/3 utilize Dβ2 based upon Southern blots with deletion probes to detect Dβ1→Jβ1 and Dβ2→Jβ2 rearrangements (unpublished data), as it is difficult to discern the true values from the literature. Therefore, we also need to multiply the number of TRECs detected by 1.5 (100÷2/3) to correct for the fact that only approximately 2/3 of Vβ rearrangements are to Dβ1. Thus, we used the formula: [2.3(1.5)(V→DJβ1 TREC copy number)] to arrive at a “corrected” value for the true number of total β TRECs in each DNA sample. These values were used to determine the contribution of β TRECs to the V-DJβtaq signals (Table 4). In DNA preparations from total thymocytes, between 6% and 11% of the V-DJβ1 real-time PCR signal could be attributed to β TRECs (for example, (3.1/36)(100)=8.5% for thymus 1). For adult peripheral blood T cells, the proportion was lower, 4–7%. Table 4 also shows the true percentages of the TCRβ locus remaining in germline configuration after correction for the presence of β TRECs.
Table 4.
Contribution of β TRECs to V-DJβ real-time PCR signals
| DNA Source | β TRECs as a % of Cβ2 signala | V-DJβ1 as a % of Cβ2 signalb | %TCR β germline remaining corrected for TRECs |
|---|---|---|---|
| Thymus 1 | 3.1 | 36 | 33 |
| Thymus 2 | 3.0 | 46 | 43 |
| Thymus 3 | 3.7 | 34 | 30 |
| T cells 1 | 2.3 | 42 | 40 |
| T cells 2 | 1.9 | 43 | 41 |
| T cells 3 | 2.6 | 39 | 36 |
| CD4 ISP 1 | 30 | 91 | 61 |
| CD4 ISP 2 | 41 | 78 | 37 |
[(copies β TRECs)/(copies Cβ2)]–3.4–100.
[(copies V-DJβ1)/(copies Cβ2)]–100.
To more clearly demonstrate the ability of our real-time PCR to detect TCR Vβ TRECs, we performed the assay on highly purified populations of CD4 ISP thymocytes, a population that is undergoing active TCR V→DJβ rearrangements (Blom et al., 1999) and should have higher percentages of TRECs. These experiments revealed that approximately 30–40% of the V-DJβtaq germ-line signal could be attributed to TRECs (Table 4). Thus, in populations of cells undergoing TCR β gene rearrangements, there can be significant levels of TRECs that need to be taken into account when assessing the extent of gene rearrangements.
4. Discussion
Knowing when each TCR locus begins and completes its gene rearrangements will help to better define the developmental stages of thymocytes and give insight into the role these rearrangements play in the αβ vs. γδ T cell lineage decision. Analyzing the status of each locus in mature thymocytes and Tcells will give an historical perspective on the developmental pathway those cells followed. However, the established quantitative Southern blotting method (Petrie et al., 1995) to analyze the gene rearrangement status in early and rare thymocyte populations (i.e., double negative thymocytes, γδ T cells) is technically challenging, if not impossible, because of the amount of DNA required. A typical Southern blot as shown in Fig. 4 requires 15 μg of genomic DNA for the detection of a residual germline signal in samples with extensive gene rearrangements. Therefore, we developed real-time PCR assays to accomplish the same goals. In contrast to Southern blotting, only 5 and 15 ng of DNA were used in each real-time PCR assay, with the standard curve having as little as 1 ng. This low DNA requirement allows for multiple sample replicates for more accurate statistical analysis as well as the ability to analyze samples with small numbers of cells. Data in Fig. 5 demonstrate that real-time PCR gives results that are comparable to those obtained with the conventional quantitative Southern blotting method.
Real-time PCR assays are far less technically challenging than Southern blotting. Restriction digestion of genomic DNA is one of the most difficult steps in generating a Southern blot that will yield valid quantitative data. If the genomic DNA is not completely digested, the specific probes will bind to multiple fragment sizes, thus reducing the detectable signal and preventing accurate quantitation. There are also many more technical steps in a Southern blot (electrophoretic fragment separation, transfer to nylon membrane, cross linking, labeling the probe with 32P, efficient hybridization, adequate washing, etc.), all of which will cause a failed experiment if not performed correctly. The difficulty of setting up a real-time PCR assay, however, is comparable to that of conventional PCR. The most serious drawbacks are the cost of reagents, which can be remedied by making reaction mixes from scratch (Luthra et al., 1998), and access to an appropriate instrument.
Quantitation of the remaining germline signal is also much less challenging with real-time PCR than with Southern blots, which requires a manual assessment of the signal area and background correction to calculate the results. This adds a degree of error that is not found when using Sequence Detector to choose a threshold at which to read the CT of each sample in real-time PCR. Ultimately, both methods use the same concept to calculate the results, but there is less room for human error in the real-time PCR method. There are also obvious advantages of real-time PCR over conventional PCR (and even semi-quantitative PCR) for assessing the gene rearrangement status in a given population. Since there is not just one final signal as in conventional PCR, a point at which amplification is linear can be used to quantitate unrearranged DNA in each sample.
Attempts to quantitate the TCRβ TREC contribution to the germline signal using Southern blotting were unsuccessful due to a lack of sensitivity. This prompted the design of a real-time PCR assay for β TREC detection based on published methods of Hazenberg et al. (2000) and Ponchel et al. (2003). In unfractionated thymocytes and mature T-cell populations, few cells still harbor β TRECs as shown in Table 4. This is because cells with successful TCR β rearrangements divide actively after passing β-selection (Anderson and Perlmutter, 1995). Since TREC DNA is not replicated during cell division, it is diluted in populations of dividing cells. However, in CD4 ISP, a population of cells undergoing TCRβ rearrangements, the presence of β TRECs contributes significantly to the germline signal (Table 4). We did not consider TCRγ TRECs in our analysis of the extent of TCRγ gene rearrangements in unfractionated thymocytes or peripheral blood T cells. There was not much γ locus remaining in germline configuration to begin with and the majority of cells had passed through so many developmental stages since the γ locus began rearrangement that it is unlikely that many γ TRECs would survive. However, a method to detect TCRγ and δ TRECs would be necessary when analyzing the earliest thymocyte populations for the status of γ and δ rearrangements. The establishment of our TCRβ TREC assay has set the stage for the development of analogous methods for the accurate assessment of TCRγ and δ rearrangements.
As shown in these studies, real-time PCR is accurate and efficient for the assessment of the overall extent of TCR gene rearrangements in populations of cells. Similar methods could certainly be designed for the analysis of immunoglobulin gene rearrangements. Because the DNA requirements are minimal, these new methods will facilitate the analysis of rare populations of cells such as those that occur transiently during development or are present in embryos, patients with immunodeficiency diseases, and leukemia or lymphoma patients with minimal residual disease.
Acknowledgments
This work was supported by Grants AI45864 (L.F.T.), HD36044 (L.F.T.), and F32 HD08709 (M.L.J.) from the National Institutes of Health. J.L. Chain is supported by Training Grant T32 AI07633. The authors acknowledge the expert assistance of Viji Dandapani and Jacob Bass for cell sorting and the critical comments of Dr. Patrick Wilson. L.F.T. holds the Putnam City Schools Chair in Cancer Research.
Abbreviations
- TCR
T-cell receptor
- PCR
polymerase chain reaction
- TREC
T-cell receptor excision circle
- RAG
recombination activating gene
- V
variable
- D
diversity
- J
joining
- ISP
immature single positive
- EDP
early double positive
- DN
double negative
- DMEM
Dulbecco’s modification of Eagle’s medium
- FCS
fetal calf serum
- BSA
bovine serum albumin
- TBE
Tris borate EDTA
- EDTA
ethylenediamine tetraacetic acid
- SDS
sodium dodecyl sulfate
- CT
threshold cycle
- TE
Tris EDTA
- S.D.
standard deviation
References
- Anderson SJ, Perlmutter RM. A signaling pathway governing early thymocyte maturation. Immunol. Today. 1995;16:99. doi: 10.1016/0167-5699(95)80096-4. [DOI] [PubMed] [Google Scholar]
- Asnafi V, Beldjord K, Boulanger E, Comba B, Le Tutour P, Estienne MH, Davi F, Landman-Parker J, Quartier P, Buzyn A, Delabesse E, Valensi F, Macintyre E. Analysis of TCR, pTα, and RAG-1 in T-acute lymphoblastic leukemias improves understanding of early human T-lymphoid lineage commitment. Blood. 2003;101:2693. doi: 10.1182/blood-2002-08-2438. [DOI] [PubMed] [Google Scholar]
- Bassing CH, Swat W, Alt FW. The mechanism of regulation of chromosomal V(D)J recombination. Cell. 2002;109:S45. doi: 10.1016/s0092-8674(02)00675-x. [DOI] [PubMed] [Google Scholar]
- Blom B, Verschuren MCM, Heemskerk MHM, Bakker AQ, Van Gastel-Mol EJ, Wolvers-Tettero ILM, van Dongen JJM, Spits H. TCR gene rearrangements and expression of the pre-T cell receptor complex during human T-cell differentiation. Blood. 1999;93:3033. [PubMed] [Google Scholar]
- Bruggemann M, van der Velden VH, Raff T, Droese J, Ritgen M, Pott C, Wijkhuijs AJ, Gokbuget N, Hoelzer D, van Wering ER, van Dongen JJ, Kneba M. Rearranged T-cell receptor beta genes represent powerful targets for quantification of minimal residual disease in childhood and adult T-cell acute lymphoblastic leukemia. Leukemia. 2004;18:709. doi: 10.1038/sj.leu.2403263. [DOI] [PubMed] [Google Scholar]
- Burtrum DB, Kim S, Dudley EC, Hayday AC, Petrie HT. TCR gene recombination and αβ-γδ lineage divergence—productive TCR-β rearrangement is neither exclusive nor preclusive of γδ cell development. J Immunol. 1996;157:4293. [PubMed] [Google Scholar]
- Donovan JW, Ladetto M, Zou G, Neuberg D, Poor C, Bowers D, Gribben JG. Immunoglobulin heavy-chain consensus probes for real-time PCR quantification of residual disease in acute lymphoblastic leukemia. Blood. 2000;95:2651. [PubMed] [Google Scholar]
- Gallard A, Foucras G, Coureau C, Guery JC. Tracking T cell clonotypes in complex T lymphocyte populations by real-time quantitative PCR using fluorogenic complementarity-determining region-3-specific probes. J. Immunol. Methods. 2002;270:269. doi: 10.1016/s0022-1759(02)00336-8. [DOI] [PubMed] [Google Scholar]
- Hazenberg MD, Otto SA, Stuart JWTC, Verschuren MCM, Borleffs JCC, Boucher CAB, Coutinho RA, Lange JMA, De Wit TFR, Tsegaye A, van Dongen JJM, Hamann D, de Boer RJ, Miedema F. Increased cell division but not thymic dysfunction rapidly affects the T-cell receptor excision circle content of the naive T cell population in HIV-1 infection. Nat Med. 2000;6:1036. doi: 10.1038/79549. [DOI] [PubMed] [Google Scholar]
- Hettinger K, Fischer S, Panzer S, Panzer-Grümayer ER. Multiplex PCR for TCR delta rearrangements: a rapid and specific approach for the detection and identification of immature and mature rearrangements in ALL. Br J Haematol. 1998;102:1050. doi: 10.1046/j.1365-2141.1998.00879.x. [DOI] [PubMed] [Google Scholar]
- Langerak AW, Wolvers-Tettero IL, van den Beemd MW, van Wering ER, Ludwig WD, Hahlen K, Necker A, van Dongen JJ. Immunophenotypic and immunogenotypic characteristics of TCRγδ+T cell acute lymphoblastic leukemia. Leukemia. 1999;13:206. doi: 10.1038/sj.leu.2401276. [DOI] [PubMed] [Google Scholar]
- Livák F, Petrie HT, Crispe IN, Schatz DG. In-frame TCR δ gene rearrangements play a critical role in the αβ/γδ T cell lineage decision. Immunity. 1995;2:617. doi: 10.1016/1074-7613(95)90006-3. [DOI] [PubMed] [Google Scholar]
- Livák F, Tourigny M, Schatz DG, Petrie HT. Characterization of TCR gene rearrangements during adult murine T cell development. J Immunol. 1999;162:2575. [PubMed] [Google Scholar]
- Luthra R, McBride JA, Cabanillas F, Sarris A. Novel 5′ exonuclease-based real-time PCR assay for the detection of t(14;18)(q32;q21) in patients with follicular lymphoma. Am J Pathol. 1998;153:63. doi: 10.1016/S0002-9440(10)65546-0. [DOI] [PMC free article] [PubMed] [Google Scholar]
- Margolis D, Yassai M, Hletko A, McOlash L, Gorski J. Concurrent or sequential δ and β TCR gene rearrangement during thymocyte development: individual thymi follow distinct pathways. J Immunol. 1997;159:529. [PubMed] [Google Scholar]
- Nakajima PB, Menetski JP, Roth DB, Gellert M, Bosma MJ. V-D-J rearrangements at the T cell receptor δ locus in mouse thymocytes of the αβ lineage. Immunity. 1995;3:609. doi: 10.1016/1074-7613(95)90132-9. [DOI] [PubMed] [Google Scholar]
- Petrie HT, Livák F, Burtrum D, Mazel S. T cell receptor gene recombination patterns and mechanisms: cell death, rescue, and T cell production. J Exp Med. 1995;182:121. doi: 10.1084/jem.182.1.121. [DOI] [PMC free article] [PubMed] [Google Scholar]
- Petrie HT, Tourigny M, Burtrum DB, Livák F. Precursor thymocyte proliferation and differentiation are controlled by signals unrelated to the pre-TCR. J Immunol. 2000;165:3094. doi: 10.4049/jimmunol.165.6.3094. [DOI] [PubMed] [Google Scholar]
- Ponchel F, Toomes C, Bransfield K, Leong FT, Douglas SH, Field SL, Bell SM, Combaret V, Puisieux A, Mighell AJ, Robinson PA, Inglehearn CF, Isaacs JD, Markham AF. Real-time PCR based on SYBR-Green I fluorescence: an alternative to the TaqMan assay for a relative quantification of gene rearrangements, gene amplifications and micro gene deletions. BMC Biotechnol. 2003;3:18. doi: 10.1186/1472-6750-3-18. [DOI] [PMC free article] [PubMed] [Google Scholar]
- Pongers-Willemse MJ, Verhagen OJHM, Tibbe GJM, Wijkhuijs JM, De Haas V, van Wering ER, van der Schoot CE, van Dongen JJM. Real-time PCR for quantitative detection of minimal residual disease (MRD) in childhood acute lymphoblastic leukemia (ALL) Leukemia. 1998;12:2006. doi: 10.1038/sj.leu.2401246. [DOI] [PubMed] [Google Scholar]
- Szczepanski T, Langerak AW, Willemse MJ, Wolvers-Tettero ILM, van Wering ER, van Dongen JJM. T cell receptor gamma (TCRG) gene rearrangements in T cell acute lymphoblastic leukemia reflect ‘end-stage’ recombinations: implications for minimal residual disease monitoring. Leukemia. 2000;14:1208. doi: 10.1038/sj.leu.2401765. [DOI] [PubMed] [Google Scholar]
- Valetto A, DiMartino D, Scuderi F, Lanza T, Lanciotti M, Bottini F, Dini G. Detection of T cell receptor delta gene rearrangements in childhood B and T lineage acute lymphoblastic leukaemia by Southern blot and PCR; technical comparison of two methods of analysis. Clin Lab Haematol. 2000;22:263. doi: 10.1046/j.1365-2257.2000.00317.x. [DOI] [PubMed] [Google Scholar]
- van der Velden VHJ, Jacobs DCH, Wijkhuijs AJM, Comans-Bitter WM, Willemse MJ, Hahlen K, Kamps WA, van Wering ER, van Dongen JJM. Minimal residual disease levels in bone marrow and peripheral blood are comparable in children with T cell acute lymphoblastic leukemia (ALL), but not in precursor-B-ALL. Leukemia. 2002;16:1372. doi: 10.1038/sj.leu.2402636. [DOI] [PubMed] [Google Scholar]
- West WH, Cannon GB, Kay HD, Bonnard GD, Herberman RB. Natural cytotoxic reactivity of human lymphocytes against a myeloid cell line: characterization of effector cells. J Immunol. 1977;118:355. [PubMed] [Google Scholar]
- Wilson A, de Villartay JP, MacDonald HR. T cell receptor δ gene rearrangement and T early α (TEA) expression in immature αβ lineage thymocytes: implications for αβ/γδ lineage commitment. Immunity. 1996;4:37. doi: 10.1016/s1074-7613(00)80296-4. [DOI] [PubMed] [Google Scholar]