Abstract
Mass spectrometry has been a very useful method to rapidly identify microorganisms associated with infectious diseases, detect bioterrorism threats, and discriminate among different subtypes of a pathogen. In this study, we developed a universal method for bacterial identification by matrix-assisted laser desorption ionization-time of flight mass spectrometry. The effects on the mass spectrum of different experimental conditions, including the amount of bacterial cells used and treatment procedures with different solutions, matrix species, and solvents, were examined, and an optimized protocol was developed. Several different bacterial species, including Yersinia pestis, Escherichia coli, Burkholderia cepacia, Bacillus anthracis, and Staphylococcus aureus, which covered the gram-negative and -positive species and spore-producing and non-spore-producing species, were analyzed to evaluate the utility of the protocol. The results showed that five different species and different strains of the same species (9 strains of S. aureus and 10 strains of E. coli) could be discriminated clearly by their peak profiles in a mass range of 1,000 to 20,000 Da. This protocol is simple, rapid, and easy to perform; has excellent reproducibility; and is suitable for the construction of a mass spectrum fingerprinting database, which helps in fast bacterial identification via database searching.
Rapid discrimination of pathogenic and nonpathogenic species is very important in health care, biological warfare and bioterrorism defense, bioengineering, and the pharmaceutical industry. Mass spectrometry (MS), a rapid and sensitive method, has been widely used for identification and typing of microorganisms (10). In 1975, Anhalt and Fenselau first used MS to characterize bacteria (1). Pyrolysis, laser desorption ionization, plasma desorption, and fast atom bombardment MS were then developed for identification of microorganisms. However, because of the ionization techniques in these methods, they provided limited information about organisms. Some techniques required tedious sample preparation prior to analysis (4, 8, 11, 12, 18, 24). Electrospray ionization and matrix-assisted laser desorption ionization (MALDI) had some advantages over the ionization techniques mentioned above, which included sensitivity, high throughput capability, and the ability to analyze a high mass range.
Identification of microorganisms by MALDI-time of flight (TOF) MS has been successful. In 1994, Cain reported the use of off-line chromatography combined with MALDI-TOF MS to differentiate bacteria on the basis of the analysis of proteins (3). Recent studies have demonstrated that bacteria from different species and strains could be rapidly identified and distinguished by MALDI-TOF MS (2, 5-7, 9, 13, 16, 20, 23). Du et al. reported the use of MALDI-TOF MS to differentiate methicillin-resistant Staphylococcus aureus and methicillin-susceptible S. aureus (7). Wahl et al. correctly identified different microorganisms in microbial mixtures at the genus level and even to the strain level with automated data analysis algorithms (21). Bacteria could be identified by characteristic biomarkers acquired from MALDI spectra in these studies.
However, different investigators used various ways to process samples for analysis by MALDI-TOF MS. It is necessary to establish a universal sample preparation method for various microorganisms in order to facilitate uniformity among testing laboratories. A universal technique should be reproducible and provide enough peaks in MALDI spectra to build a database that contains the characteristic profiles of various bacteria for rapid and accurate database searching. For example, Smole et al. obtained spectra in a mass range of 2,000 to 25,000 Da, including >50 peaks for 10 different species from the gram-negative Enterobacteriaceae family, but gram-positive bacteria need to be incubated with lysozyme prior to analysis to get significant peaks (>50) in the range of 2,000 to 14,000 Da (19). Jackson et al. and Vargha et al. optimized the experimental parameters of MALDI-TOF MS analysis to differentiate methicillin-resistant S. aureus and Arthrobacter isolates at the strain level, respectively, but this method was not applied to other species (14, 20). In this study, three different sample preparation methods were tested for analyzing different bacteria directly by MALDI-TOF MS. Different sample solvents, sample concentrations, sample application methods, matrices, and matrix solvents were tested for their effects on the results obtained. A universal sample preparation protocol for characterization of bacteria by MALDI-TOF MS was developed in this study for analyzing gram-positive bacteria (including those with or without spore-producing ability) and gram-negative bacteria.
MATERIALS AND METHODS
Chemicals.
The matrices α-cyano-4-hydroxycinnamic acid (CHCA) and 5-chloro-2-mecaptobenzothiazole (CMBT) were purchased from Aldrich Chemie GmbH (Steinheim, Germany). The matrix solution was prepared by dissolving 14 mg of CHCA or 3 mg of CMBT in 1 ml of different solvents; after a short centrifugation at 12,000 rpm, the supernatant solutions were used. The sample solvents for bacterial treatment and the matrix solvents for MALDI analysis are shown in Table 1. Trifluoroacetic acid (TFA) and 18-crown-6 ether were purchased from Acros Organics. The working matrix solution was freshly prepared for each batch of samples. Lysozyme and trypsin were purchased from Sigma. The standard peptide mixture used for internal mass calibration has been described previously, and it was dissolved in 0.1% TFA and stored at −20°C (7).
TABLE 1.
Sample solvents used for treatment of bacteria and matrix solvents used for MALDI analysis
| Solvent type and composition | Label |
|---|---|
| Sample solvent | |
| 0.1% TFA | I |
| Chloroform-methanol (1:1) | II |
| 2-Propanol-acetonitrile (1:1) | III |
| Formic acid-2-propanol-water (1:2:3) | IV |
| Chloroform-2-propanol (1:1) | V |
| Matrix solvent | |
| Acetonitrile-methanol-water (1:1:1) with 0.1% | |
| formic acid and 0.01 M 18-crown-6 | A |
| Acetonitrile-ethanol-water (1:1:1) with 0.1% | |
| formic acid and 0.01 M 18-crown-6 | B |
| 2-Propanol-water (1:1) | C |
| Acetonitrile-water (1:2) containing 0.1% TFA | D |
| Acetonitrile-water (2:1) containing 0.1% TFA | E |
Bacterial strains and culture conditions.
The bacteria used in this study included the gram-positive bacteria Bacillus anthracis and S. aureus and the gram-negative bacteria Yersinia pestis, Escherichia coli, and Burkholderia cepacia (Table 2). Columbia blood agar (CBA) was purchased from Difco Laboratories (Detroit, MI). CBA plates were made by adding 5% defibrinated horse blood to CBA at 45°C and stored at 4°C until use. B. anthracis, S. aureus, and E. coli were cultured on CBA at 37°C for 24 h. Y. pestis and B. cepacia were incubated on CBA at 28°C for 48 h (7).
TABLE 2.
Bacterial strains used for MALDI-TOF MS analysis
| Species and strain(s) | Characteristic(s)b | Source or reference |
|---|---|---|
| Bacillus anthracis A.16R | Laboratory collection | |
| Staphylococcus aureus | ||
| 658, 659, 665, | nuc+mecA− | 7 |
| 666, 668, | ||
| 669, 670, | ||
| 671, 673 | ||
| 678 | nuc+mecA+ | |
| Yersinia pestis EV76 | Laboratory collection | |
| Escherichia coli | ||
| JM109 | Laboratory collection | |
| M408, 44823 | ST+ | Children's Hospital of Shanxi Province |
| M408-3 | ST+ LT+ | |
| 44813 | ST+ LT+ | |
| 44814 | LT+ O78:H11 | |
| 44815 | ST+ LT+ | |
| 44816 | ST+ O6:H16 | |
| 44822 | LT+ | |
| M408-1, 44817 | ST− LT− | |
| Burkholderia cepacia 855a | Army General Hospital No. 301 |
Identified by biochemical tests and fatty acid analysis.
ST, heat-stable enterotoxin; LT, heat-labile enterotoxin.
Sample preparation. (i) Direct analysis method.
Several colonies of bacteria were collected, spotted onto a target plate with a sterilized toothpick, and left to air dry at ambient temperature. An aliquot of 1 μl of different matrix solutions, as described in Materials and Methods, was overlaid on each sample well and allowed to dry for several minutes before analysis.
(ii) Solvent treatment method.
Two solvent treatment methods were investigated. The first one used a single solvent to treat bacteria. A small quantity (4 to 5 mg) of cells was harvested with a sterile loop and washed twice with 200 μl of solvent I, II, III, IV, or V (Table 1). The pellet of bacteria was then resuspended in 30 μl of the same solvent and vortexed for 1 min. The second method used two different sample solvents to treat bacteria. First, bacteria were washed twice with 0.1% TFA (solvent I). The pellet was then resuspended in 200 μl of solvent II, III, IV, or V; vortexed for 1 min; and centrifuged at 6,000 × g for 5 min. The pellet was then resuspended in 30 μl of 0.1% TFA.
(iii) Enzyme treatment method.
Bacterial cells (4 to 5 mg) were harvested and washed three times with deionized water. The pellet was resuspended in 30 μl of water and then mixed and incubated with lysozyme for 30 min or trypsin for 2 h at 37°C. Termination of digestion was accomplished by addition of 0.1% TFA, and the pellet was treated with 0.1% TFA.
(iv) Optimization of bacterial quantities and sample application methods.
Different quantities of bacterial cells, ranging from 0.8 to 16 mg, were tested in order to find the optimal quantity that yielded the best spectrum.
Several sample application methods were also investigated to enhance MALDI sample spot homogeneity. In the first one, a 1-μl mixture of sample and matrix was applied to the target plate and dried in air. The second was a seed layer method in which the dilute matrix was first deposited on the sample probe to form a seed layer and then a 0.5-μl drop of a mixture of analyte solution and CHCA in matrix solvent A (1:1) (Table 1) was overlaid onto the seed layer and allowed to dry at ambient temperature (17). The third was a two-layer method in which the first layer was formed by applying 1 μl of 14 mg/ml CHCA in acetone to the MALDI target and dried very quickly in air. For the second-layer solution, 1 μl of a mixture of sample and CHCA solution (1:1) was placed on top of the first matrix layer and dried in air (22). The fourth was a dried-droplet method in which 1 μl of turbid sample solution was first placed on the target plate and allowed to air dry and then 1 μl of a saturated solution of CHCA was overlaid onto each of the dried analytes (15). After drying, the samples were ready to be analyzed by MALDI-TOF MS.
MALDI analysis.
All of the samples were analyzed with a linear MALDI-TOF mass spectrometer (Micromass UK Ltd.) equipped with a nitrogen laser light, and data acquisition and processing were performed with the Microbelynx software system (version V3.5). The mass spectrometer was operated in linear mode at a 15-kV accelerating voltage with an ion flight path of 0.68 m. The data acquisition mass range was m/z 1,000 to 20,000 Da. The instrument was externally calibrated with a mixture of seven peptides and proteins described in Materials and Methods.
RESULTS
Sample preparation.
By the simplest approach, direct analysis of bacteria, B. anthracis and Y. pestis could be discriminated according to the peaks at m/z 4,327 and 4,349 specific for Y. pestis. However, the signals were poor and unstable and all of the peaks fell into a narrow m/z range of 1,000 to 6,000 Da (data not shown). Five different matrix solvents were used in the direct analysis, and none of them could produce high-quality signals.
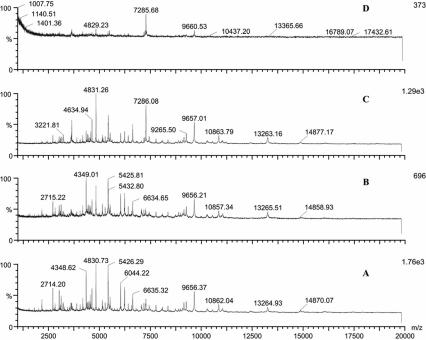
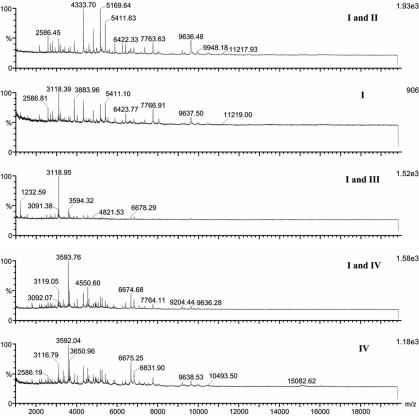
Different sample solvents, matrices, and matrix solvents were compared for their effects on the results obtained. Of the five matrix solvents, matrix solvent A steadily gave the most-informative spectra. Figure 1 shows representative spectra of Y. pestis with CHCA as the matrix in different matrix solvents, and solvent A consistently gave more peaks than the others in repeated analyses (Fig. 1A). Matrix CHCA provided more signals compared to CMBT in the analysis of both B. anthracis and Y. pestis (data not shown). Consequently, CHCA prepared in matrix solvent A was used in the following studies. Because the objective was to produce a universal method of sample preparation, we investigated how to achieve uniformity among bacteria further. Figure 2 demonstrates the MALDI mass spectra of B. anthracis obtained with different sample solvents. A combination of solvents I and II resulted in the best signal for B. anthracis; however, a combination of solvents I and III gave better results for Y. pestis (data not shown). Although many common peaks were present in the five spectra when different sample solvents were used for B. anthracis sample treatment (Fig. 2), the peak numbers, the relative intensities of peaks, and the m/z ranges were different. Similar effects on the spectra of those sample solvents were also observed when other bacterial samples were examined.
FIG. 1.
MALDI mass spectra of Y. pestis analyzed with CHCA in different solvents as the matrix (matrix solvent E gave no useful signal, and the data are not shown here). Bacterial samples were treated with the solvent TFA (0.1%) combined with the solvent chloroform-methanol (1:1). A, acetonitrile-methanol-water (1:1:1) with 0.1% formic acid and 0.01 M 18-crown-6; B, acetonitrile-ethanol-water (1:1:1) with 0.1% formic acid and 0.01 M 18-crown-6; C, 2-propanol-water (1:1); D, acetonitrile-water (1:2) containing 0.1% TFA.
FIG. 2.
MALDI mass spectra of B. anthracis treated with different sample solvents. The matrix solution was CHCA dissolved in acetonitrile-methanol-water (1:1:1) with 0.1% formic acid and 0.01 M 18-crown-6. The other solvent treatments, including II, III, V, and a combination of I and V, gave no signal (data not shown). I, 0.1% TFA; II, chloroform-methanol (1:1); III, 2-propanol-acetonitrile (1:1); IV, formic acid-2-propanol-water (1:2:3).
Lysozyme and trypsin can disrupt bacterial cell structures and release more cellular proteins; therefore, more proteins were expected to be detected under this condition. Samples were treated with 1 mg/ml lysozyme or trypsin prior to solvent treatment in order to test their effects on spectral quality, but the results were unsatisfactory (data not shown). It is possible that adding protein to samples at a concentration needed for enzymatic action increased the background signals.
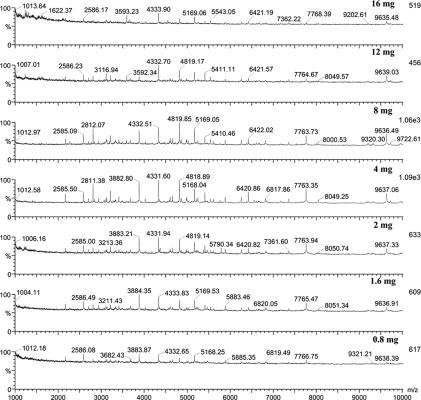
We observed that the bacterial quantities used in experiments influence the peak numbers and the intensity of signals obtained from MALDI analysis. When using different amounts of bacteria ranging from 0.8 to 16 mg, 4 mg of bacterial cells suspended in 30 μl of 0.1% TFA gave the best signals in analyzing both B. anthracis (Fig. 3) and Y. pestis with CHCA.
FIG. 3.
MALDI-TOF mass spectra of different quantities of B. anthracis (1,000 to 10,000 Da). Bacteria were treated with 0.1% TFA combined with the solvent chloroform-methanol (1:1). The matrix solution was CHCA dissolved in acetonitrile-methanol-water (1:1:1) with 0.1% formic acid and 0.01 M 18-crown-6. The best result was obtained with 4 mg of bacterial cells.
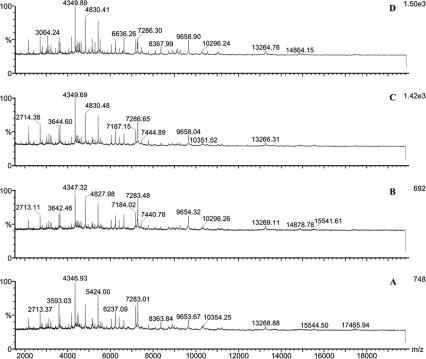
Various sample application methods were tried in order to improve homogeneity (Fig. 4). By visual examination, it was found that the dried-droplet method dramatically enhanced the homogeneity of the MALDI samples, in part because the bacterial suspension was finer and went into solution better. In addition, MALDI spectra obtained by using the dried-droplet method had better reproducibility than the other application methods when different spots on the same sample were analyzed.
FIG. 4.
Comparison of different sample application methods for analysis of Y. pestis. Bacteria were treated with the solvent TFA (0.1%) combined with the solvent chloroform-methanol (1:1). The matrix solution was CHCA dissolved in acetonitrile-methanol-water (1:1:1) with 0.1% formic acid and 0.01 M 18-crown-6. A, sample and matrix solutions were mixed (1:1), and 2 μl of the mixture was added to the target plate; B, seed layer method; C, two-layer method; D, dried-droplet method. The dried-droplet method gave the optimal result.
The protocol of sample preparation for bacterial identification by MALDI-TOF MS is summarized as follows. Bacteria cells (4 to 5 mg) were removed from colonies on the agar surface and washed with 200 μl of 0.1% TFA. The pellet was resuspended in 200 μl of chloroform-methanol (1:1), vortexed for 1 min, and centrifuged at 6,000 × g for 5 min. The pellet was then resuspended in 30 μl of 0.1% TFA. The dried-droplet method was used; i.e., 1 μl of sample solution was applied to the target plate and air dried, and then 1 μl of matrix solution (14 mg of CHCA dissolved in 1 ml of a mixture of acetonitrile-methanol-water [1:1:1] with 0.1% formic acid and 0.01 M 18-crown-6) was spotted onto the first formed layer, air dried, and finally analyzed by MALDI-TOF MS.
Reproducibility of the method.
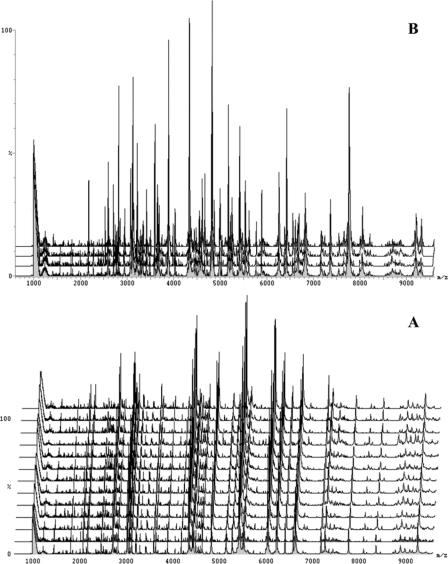
MALDI mass spectra of the same bacterial cells could be quite reproducible when samples were treated in the same way and recorded with the same instrumental operating conditions (Fig. 5). A fingerprint database obtained by MALDI-TOF MS could be established to identify unknown bacteria via database searching if reproducibility were achieved. The spectra in Fig. 5A were obtained from the different sample spots of the same sample of Y. pestis, and the 12 replicate spectra were compared for reproducibility. Bacterial samples from three batches were independently cultivated, and the protocol summarized above was used to perform the analysis. The spectra in Fig. 5B are the results of analysis for B. anthracis in three different batches. The MALDI-TOF MS profiles of these three spectra showed consistent peaks, indicating that a stable spectrum could be generated with this protocol.
FIG. 5.
Reproducibility of MALDI-TOF analysis by the protocol developed in this study. A, 12 replicate spectra obtained from different spots of the same sample of Y. pestis; B, MALDI-TOF spectra of three different analysis batches of B. anthracis. Samples were prepared under the same experimental conditions; i.e., bacteria were grown under standard conditions and then treated with solvent I and solvent II with CHCA in matrix solvent A as the matrix, and the dried-droplet method was used.
Applicability of the method.
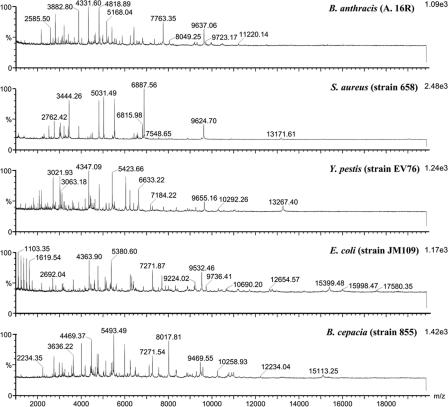
In order to test if the protocol is applicable to more bacterial species with different characteristics, S. aureus 658, B. cepacia 855, and E. coli JM109 were also analyzed. Of the five bacterial species tested, B. anthracis is gram positive and spore producing; S. aureus is gram positive and non-spore producing; E. coli, Y. pestis, and B. cepacia are gram negative; and B. cepacia has a high extracellular-polysaccharide content. It was found that these five species could be readily distinguished from each other by peaks with different m/z values (Fig. 6), and all of their mass spectra were represented by more than 20 m/z values with high sensitivity.
FIG. 6.
MALDI-TOF MS spectra of different bacterial species. Samples were prepared under the same experimental conditions; i.e., bacteria were grown under standard conditions and then treated with solvent I and solvent II, CHCA in matrix solvent A was used as the matrix, and the dried-droplet method was used.
In addition, 10 strains of E. coli and 9 strains of S. aureus were analyzed to evaluate the ability of the method to distinguish among strains of the same species. The unique fingerprints of different strains could be discriminated from each other by different m/z values (Tables 3 and 4; m/z values of >10,000 Da are not listed). This feature demonstrated that a database containing a large number of bacteria could be built for identifying bacteria rapidly at both the species and strain levels. Many peaks were common to 10 strains of E. coli, including m/z 1,101, 2,183, 2,690, 5,381, 7,158, and 7,274, with only modest intensity variations. It was also found that six of the values (m/z = 1,103, 1,232, 1,361, 1,490, 1,619, and 1,748) were spaced 129 Da apart for E. coli JM109, which is similar to the result reported by Claydon et al. (5). Seven peaks, including m/z 2,515, 3,208, 3,408, 3,443, 4,811, 6,887, and 9,624, were common to all of the S. aureus isolates tested.
TABLE 3.
m/z values of 10 E. coli isolates (1,000 to 10,000 Da)
|
m/z valuea of E. coli isolate:
| |||||||||
|---|---|---|---|---|---|---|---|---|---|
| M-408-1 | M-408-3 | M-408 | 44822 | 44813 | 44815 | 44823 | 44814 | 44817 | 44816 |
| 1,102 | 1,102 | 1,102 | 1,101 | 1,102 | 1,101 | 1,101 | 1,103 | 1,102 | 1,101 |
| 1,231 | 1,231 | 1,231 | 1,231 | 1,232 | 1,230 | 1,231 | 1,231 | 1,231 | |
| 1,278 | |||||||||
| 2,137 | |||||||||
| 2,183 | 2,182 | 2,184 | 2,183 | 2,183 | 2,182 | 2,183 | 2,183 | 2,183 | 2,182 |
| 2,384 | 2,383 | ||||||||
| 2,468 | |||||||||
| 2,549 | 2,548 | 2,548 | 2,548 | 2,548 | 2,548 | ||||
| 2,692 | 2,690 | 2,691 | 2,690 | 2,690 | 2,690 | 2,690 | 2,692 | 2,691 | 2,690 |
| 2,789 | |||||||||
| 2,833 | 2,834 | ||||||||
| 3,129 | 3,127 | 3,128 | 3,127 | 3,126 | |||||
| 3,158 | 3,159 | 3,157 | |||||||
| 3,180 | 3,179 | 3,178 | |||||||
| 3,238 | |||||||||
| 3,246 | |||||||||
| 3,434 | 3,433 | 3,432 | 3,433 | ||||||
| 3,579 | 3,578 | 3,581 | |||||||
| 3,638 | 3,637 | 3,636 | 3,637 | 3,637 | 3,638 | ||||
| 4,175 | |||||||||
| 4,185 | |||||||||
| 4,365 | 4,364 | 4,364 | 4,364 | 4,364 | 4,365 | 4,364 | 4,364 | ||
| 4,532 | 4,532 | 4,532 | |||||||
| 4,615 | 4,614 | 4,614 | 4,612 | 4,612 | 4,614 | ||||
| 4,769 | 4,768 | 4,768 | 4,767 | 4,767 | 4,769 | 4,769 | 4,767 | ||
| 4,777 | 4,776 | 4,776 | |||||||
| 4,857 | |||||||||
| 4,870 | 4,870 | 4,870 | 4,871 | 4,871 | |||||
| 5,097 | |||||||||
| 5,150 | 5,148 | 5,150 | 5,148 | ||||||
| 5,233 | 5,233 | ||||||||
| 5,327 | |||||||||
| 5,382 | 5,381 | 5,381 | 5,381 | 5,382 | 5,380 | 5,379 | 5,382 | 5,381 | 5,381 |
| 5,612 | |||||||||
| 6,256 | 6,255 | 6,255 | 6,256 | 6,254 | 6,253 | 6,257 | 6,255 | 6,254 | |
| 6,317 | 6,315 | 6,316 | 6,316 | 6,314 | 6,315 | 6,317 | 6,316 | 6,315 | |
| 6,328 | |||||||||
| 6,411 | |||||||||
| 6,857 | |||||||||
| 7,160 | 7,156 | 7,159 | 7,159 | 7,159 | 7,157 | 7,158 | 7,160 | 7,158 | 7,156 |
| 7,274 | 7,274 | 7,273 | 7,273 | 7,274 | 7,272 | 7,273 | 7,273 | 7,274 | 7,272 |
| 7,654 | |||||||||
| 7,705 | 7,705 | 7,704 | 7,704 | 7,703 | |||||
| 7,871 | 7,870 | ||||||||
| 8,327 | |||||||||
| 8,350 | |||||||||
| 9,063 | 9,065 | 9,064 | |||||||
| 9,222 | 9,224 | 9,224 | 9,224 | ||||||
| 9,534 | 9,536 | 9,533 | 9,532 | 9,534 | 9,534 | ||||
| 9,712 | 9,708 | ||||||||
| 9,739 | 9,739 | 9,739 | 9,740 | 9,741 | |||||
The underlined values represent peaks shared by all 10 E. coli isolates.
TABLE 4.
m/z values of nine isolates of S. aureus (1,000 to 10,000 Da)
|
m/z valuea of S. aureus isolate:
| ||||||||
|---|---|---|---|---|---|---|---|---|
| 659 | 665 | 666 | 668 | 669 | 670 | 671 | 673 | 678 |
| 1,020 | ||||||||
| 1,113 | 1,113 | 1,114 | ||||||
| 1,317 | 1,319 | 1,318 | ||||||
| 1,456 | 1,456 | |||||||
| 1,700 | 1,700 | 1,700 | 1,700 | |||||
| 1,774 | ||||||||
| 1,791 | 1,793 | 1,792 | 1,792 | 1,792 | ||||
| 1,937 | ||||||||
| 2,093 | 2,092 | |||||||
| 2,201 | 2,201 | 2,200 | 2,200 | |||||
| 2,296 | 2,295 | 2,295 | 2,295 | 2,296 | 2,296 | |||
| 2,305 | 2,306 | |||||||
| 2,516 | 2,515 | 2,516 | 2,516 | 2,515 | 2,516 | 2,515 | ||
| 2,635 | 2,635 | 2,635 | 2,636 | |||||
| 2,752 | ||||||||
| 2,762 | 2,762 | 2,761 | 2,762 | 2,762 | 2,761 | |||
| 2,768 | ||||||||
| 2,776 | ||||||||
| 3,039 | 3,036 | 3,038 | 3,040 | 3,036 | ||||
| 3,055 | 3,053 | |||||||
| 3,211 | 3,209 | 3,209 | 3,209 | 3,208 | 3,209 | 3,210 | 3,209 | 3,208 |
| 3,288 | ||||||||
| 3,408 | 3,408 | 3,407 | 3,408 | 3,408 | 3,408 | 3,408 | 3,408 | |
| 3,443 | 3,443 | 3,443 | 3,444 | 3,444 | 3,444 | 3,444 | 3,444 | 3,441 |
| 3,493 | ||||||||
| 3,874 | 3,875 | 3,874 | 3,875 | |||||
| 3,891 | 3,889 | 3,891 | 3,889 | |||||
| 4,074 | 4,075 | |||||||
| 4,301 | 4,303 | 4,304 | 4,303 | |||||
| 4,394 | 4,391 | |||||||
| 4,443 | 4,444 | 4,446 | 4,445 | |||||
| 4,496 | 4,495 | |||||||
| 4,510 | 4,510 | |||||||
| 4,810 | 4,810 | 4,811 | 4,813 | 4,812 | 4,812 | 4,813 | 4,813 | 4,813 |
| 5,030 | 5,031 | 5,029 | 5,032 | 5,031 | 5,031 | 5,031 | 5,030 | 5,031 |
| 5,417 | ||||||||
| 5,434 | 5,437 | 5,436 | 5,437 | 5,437 | 5,436 | |||
| 5,453 | ||||||||
| 5,465 | ||||||||
| 5,504 | ||||||||
| 5,521 | 5,524 | 5,524 | 5,524 | 5,524 | 5,524 | |||
| 5,538 | 5,540 | 5,548 | ||||||
| 5,766 | 5,765 | |||||||
| 6,078 | 6,081 | 6,079 | 6,080 | 6,079 | 6,081 | 6,079 | ||
| 6,352 | 6,354 | |||||||
| 6,420 | 6,423 | 6,420 | 6,422 | 6,422 | ||||
| 6,548 | 6,552 | 6,551 | 6,550 | 6,551 | ||||
| 6,572 | ||||||||
| 6,579 | 6,579 | 6,579 | ||||||
| 6,590 | 6,588 | 6,589 | ||||||
| 6,699 | ||||||||
| 6,814 | 6,816 | 6,814 | 6,815 | 6,816 | 6,816 | |||
| 6,885 | 6,887 | 6,885 | 6,887 | 6,887 | 6,887 | 6,887 | 6,887 | 6,887 |
| 6,909 | 6,910 | |||||||
| 6,925 | 6,926 | 6,925 | ||||||
| 6,988 | 6,985 | 6,987 | 6,987 | |||||
| 8,877 | ||||||||
| 8,888 | ||||||||
| 9,532 | 9,531 | 9,530 | ||||||
| 9,609 | ||||||||
| 9,624 | 9,625 | 9,621 | 9,624 | 9,624 | 9,624 | 9,623 | 9,624 | 9,624 |
The underlined values represent peaks shared by all nine S. aureus isolates.
DISCUSSION
Several different protocols were investigated in our study. Different bacterial quantities, sample solvents, matrices, matrix solvents, and sample application methods were evaluated for their effects on the MALDI-TOF MS signals of bacteria. The combination of TFA and chloroform-methanol (1:1) for treating bacteria gave more and stronger signals compared with the other sample solvents. This combination helped to remove impurities, thus reducing a suppression effect for the ionization process. TFA helped improve cell wall lysis. However, the matrix solution containing TFA gave poor or no signals, which was possibly caused by the strong acidity of TFA. The acidity of the matrix solvent used can influence the ionization of the matrix; thus, that step had a negative impact on the acquisition of MALDI signals. In this study, the better MALDI spectra were acquired when acid-containing sample solvents (I and II) were used to treat bacteria (Fig. 2). Both CHCA and CMBT were used to test the effect of bacterial quantities on MALDI spectra, and 16 mg of bacterial cells gave the best signals with CMBT (data not shown). CHCA has higher chemical activity than CMBT on the basis of their chemical structures and is thus prone to react with other reagents. Therefore, CHCA has a greater ionization effect and is more sensitive to impurities present in bacterial samples than is CMBT. Therefore, it is not surprising that the bacterial cells that can give signals when CMBT is used as a matrix cannot be successfully analyzed with CHCA.
It is necessary that a universal method for identification of bacteria have good reproducibility. The results show that the reproducibility of the MALDI-TOF MS method described here was excellent because analysis of different spots of the same sample and the same samples in three independent batches of samples gave similar results.
The other key factor that influences the usefulness of MALDI-TOF MS analysis is specificity of identification. The results showed that the protocol we developed can be used to analyze both gram-positive bacteria (including spore-producing B. anthracis and non-spore-producing S. aureus) and gram-negative bacteria such as Y. pestis, E. coli, and B. cepacia that have high extracellular-polysaccharide contents (Fig. 6). The five species were easily distinguished from each other according to the characteristic peaks of MALDI spectra. This protocol was further used to analyze different strains of the same species, including 10 strains of E. coli and 9 strains of S. aureus, to test the discriminative ability of the analysis method. The unique fingerprint of each strain provided a specific profile for discrimination based on m/z values. There were peaks common to the E. coli and S. aureus strains analyzed; thus, these common signals could be used as species biomarkers. Both the species and strain biomarkers indicated a specific bacterium, and the overall fingerprints of the mass spectra could provide more detailed useful information for the successful identification of specific bacteria at both the species and strain levels. These features will facilitate the reliable and rapid detection of pathogens by MALDI-TOF MS analysis, especially as databases are built. MALDI-TOF MS might be a useful adjunct to other methods, such as DNA-based ones, when there is some concern over the ability to discriminate between strains.
Acknowledgments
We thank Junmin Zhang from Army General Hospital No. 301 and Qingyi Zhu from the Children's Hospital of Shanxi Province for providing bacterial isolates.
Footnotes
Published ahead of print on 2 February 2007.
REFERENCES
- 1.Anhalt, J. P., and C. Fenselau. 1975. Identification of bacteria using mass spectrometry. Anal. Chem. 47:219-225. [Google Scholar]
- 2.Bright, J. J., M. A. Claydon, M. Soufian, and D. B. Gordon. 2002. Rapid typing of bacteria using matrix-assisted laser desorption ionisation time-of-flight mass spectrometry and pattern recognition software. J. Microbiol. Methods 48:127-138. [DOI] [PubMed] [Google Scholar]
- 3.Cain, T. C., D. M. Lubman, and W. J. Webber, Jr. 1994. Differentiation of bacteria using protein profiles from MALDI-TOF/MS. Rapid Commun. Mass Spectrom. 8:1026-1030. [Google Scholar]
- 4.Caroff, M., C. Deprun, and D. Karibian. 1993. 252Cf plasma desorption mass spectrometry applied to the analysis of underivatized rough-type endotoxin preparations. J. Biol. Chem. 268:12321-12324. [PubMed] [Google Scholar]
- 5.Claydon, M. A., S. N. Davey, V. Edwards-Jones, and D. B. Gordon. 1996. The rapid identification of intact microorganisms using mass spectrometry. Nat. Biotechnol. 14:1584-1586. [DOI] [PubMed] [Google Scholar]
- 6.Demirev, P. A., Y. P. Ho, V. Ryzhov, and C. Fenselau. 1999. Microorganism identification by mass spectrometry and protein database searches. Anal. Chem. 71:2732-2738. [DOI] [PubMed] [Google Scholar]
- 7.Du, Z., R. Yang, Z. Guo, Y. Song, and J. Wang. 2002. Identification of Staphylococcus aureus and determination of its methicillin resistance by matrix-assisted laser desorption/ionization time-of-flight mass spectrometry. Anal. Chem. 74:5487-5491. [DOI] [PubMed] [Google Scholar]
- 8.Easterling, M. L., C. M. Colangelo, R. A. Scott, and I. J. Amster. 1998. Monitoring protein expression in whole bacteria cells with MALDI time-of-flight mass spectrometry. Anal. Chem. 70:2704-2709. [DOI] [PubMed] [Google Scholar]
- 9.Edwards-Jones, V., M. A. Claydon, D. J. Evason, J. Walker, A. J. Fox, and D. B. Gordon. 2000. Rapid discrimination between methicillin-sensitive and methicillin-resistant Staphylococcus aureus by intact cell mass spectrometry. J. Med. Microbiol. 49:295-300. [DOI] [PubMed] [Google Scholar]
- 10.Fenselau, C. C., and K. Jackson. 2003. MS and microbiology. Mod. Drug Discov. 6:37-41. [Google Scholar]
- 11.Heller, D. N., R. J. Cotter, C. Fenselau, and O. M. Uy. 1987. Profiling of bacteria by fast atom bombardment mass spectrometry. Anal. Chem. 59:2806-2809. [DOI] [PubMed] [Google Scholar]
- 12.Heller, D. N., C. Fenselau, R. J. Cotter, P. Demirev, J. K. Olthoff, J. Honovich, M. Uy, T. Tanaka, and Y. Kishimoto. 1987. Mass spectral analysis of complex lipids desorbed directly from lyophilized membranes and cells. Biochem. Biophys. Res. Commun. 142:194-199. [DOI] [PubMed] [Google Scholar]
- 13.Holland, R. D., J. G. Wilkes, F. Rafii, J. B. Sutherland, C. C. Persons, K. J. Voorhees, and J. O. Lay, Jr. 1996. Rapid identification of intact whole bacteria based on spectral patterns using matrix-assisted laser desorption/ionization with time-of-flight mass spectrometry. Rapid Commun. Mass Spectrom. 10:1227-1232. [DOI] [PubMed] [Google Scholar]
- 14.Jackson, K. A., V. Edwards-Jones, C. W. Sutton, and A. J. Fox. 2005. Optimisation of intact cell MALDI method for fingerprinting of methicillin-resistant Staphylococcus aureus. J. Microbiol. Methods 62:273-284. [DOI] [PubMed] [Google Scholar]
- 15.Karas, M., and F. Hillenkamp. 1988. Laser desorption ionization of proteins with molecular masses exceeding 10,000 daltons. Anal. Chem. 60:2299-2301. [DOI] [PubMed] [Google Scholar]
- 16.Krishnamurthy, T., P. L. Ross, and U. Rajamani. 1996. Detection of pathogenic and non-pathogenic bacteria by matrix-assisted laser desorption/ionization time-of-flight mass spectrometry. Rapid Commun. Mass Spectrom. 10:883-888. [DOI] [PubMed] [Google Scholar]
- 17.Nilsson, C. L. 1999. Fingerprinting of Helicobacter pylori strains by matrix-assisted laser desorption/ionization mass spectrometric analysis. Rapid Commun. Mass Spectrom. 13:1067-1071. [DOI] [PubMed] [Google Scholar]
- 18.Ross, M. M., R. A. Neihof, and J. E. Campana. 1986. Direct fatty acid profiling of complex lipids in intact algae by fast atom bombardment mass spectrometry. Anal. Chim. Acta 181:149-157. [Google Scholar]
- 19.Smole, S. C., L. A. King, P. E. Leopold, and R. D. Arbeit. 2002. Sample preparation of Gram-positive bacteria for identification by matrix assisted laser desorption/ionization time-of-flight. J. Microbiol. Methods 48:107-115. [DOI] [PubMed] [Google Scholar]
- 20.Vargha, M., Z. Takats, A. Konopka, and C. H. Nakatsu. 2006. Optimization of MALDI-TOF MS for strain level differentiation of Arthrobacter isolates. J. Microbiol. Methods 66:399-409. [DOI] [PubMed] [Google Scholar]
- 21.Wahl, K. L., S. C. Wunschel, K. H. Jarman, N. B. Valentine, C. E. Petersen, M. T. Kingsley, K. A. Zartolas, and A. J. Saenz. 2002. Analysis of microbial mixtures by matrix-assisted laser desorption/ionization time-of-flight mass spectrometry. Anal. Chem. 74:6191-6199. [DOI] [PubMed] [Google Scholar]
- 22.Wang, Z., L. Russon, L. Li, D. C. Roser, and S. R. Long. 1998. Investigation of spectral reproducibility in direct analysis of bacteria proteins by matrix-assisted laser desorption/ionization time-of-flight mass spectrometry. Rapid Commun. Mass Spectrom. 12:456-464. [DOI] [PubMed] [Google Scholar]
- 23.Welham, K. J., M. A. Domin, D. E. Scannell, E. Cohen, and D. S. Ashton. 1998. The characterization of microorganisms by matrix-assisted laser desorption/ionization time-of-flight mass spectrometry. Rapid Commun. Mass Spectrom. 12:176-180. [DOI] [PubMed] [Google Scholar]
- 24.Zarrouk, H., D. Karibian, S. Bodie, M. B. Perry, J. C. Richards, and M. Caroff. 1997. Structural characterization of the lipids A of three Bordetella bronchiseptica strains: variability of fatty acid substitution. J. Bacteriol. 179:3756-3760. [DOI] [PMC free article] [PubMed] [Google Scholar]


