

Abstract
Imprinting Control Regions (ICRs) often harbor tandem arrays of transcription factor binding sites, as demonstrated by the identification of multiple YY1 binding sites within the ICRs of Peg3, Nespas, and Xist/Tsix domains. In the current study, we have sought to characterize possible roles of YY1 in transcriptional control and epigenetic modification of these imprinted domains. RNA interference-based knockdown experiments in Neuro2A cells resulted in overall transcriptional up-regulation of most of the imprinted genes within the Peg3 domain and also, concomitantly, caused significant loss in the DNA methylation of Peg3-DMR (Differentially Methylated Regions). A similar overall and coordinated expression change was also observed for the imprinted genes of the Gnas domain: up-regulation of Nespas and down-regulation of Nesp and Gnasxl. YY1 knockdown also resulted in changes in the expression levels of Xist and Snrpn. These results support the idea that YY1 plays a major role, as a trans factor, for the control of these imprinted domains.
Keywords: genomic imprinting, ICRs, YY1
Introduction
A small number of mammalian genes are subject to an unusual dosage control, called genomic imprinting, in which one of two alleles of the genes is repressed in a parental-origin-specific manner. The imprinted genes are clustered in specific regions of chromosomes, and each imprinted domain is typically controlled by small genomic regions, termed Imprinting Control Regions (ICRs) [1–3]. These ICRs are usually located in CpG-rich regions near the promoters of imprinted genes and methylated differentially between the two parental alleles. These regions often show tandem repeat sequence structure [4,5] and the core sequences of these tandem repeats have been shown in several cases to correspond to transcription factor binding sites. Known transcription factors binding to repeat regions include CTCF for the ICR of the H19/Igf2 imprinted domain, and YY1 for the DMR of Peg3, Nespas, and Xist/Tsix imprinted domains [6–9]. In the H19/Igf2 imprinted domain, CTCF functions as an enhancer-blocker for controlling allele-specific expression of H19 and Igf2 [10,11]. However, the in vivo functions of YY1 for the Peg3 and other imprinted domains require further investigation.
The mammalian transcription factor YY1 is a ubiquitously expressed, multifunctional protein that can function as an activator, repressor, or initiator binding protein depending upon the sequence context of YY1-binding sites with respect to other regulator elements [reviewed by 12–14]. The protein has a DNA-binding domain at the C-terminus and other modulating domains at the N-terminus displaying repression, activation, and protein-protein interaction activities. YY1 interacts with several key components of general Pol II transcription machineries, including TBP, TAFs and TFIIB, as well as histone-modifying enzymes, including p300, HDACs and PRMT1 [reviewed by 12–14]. YY1 is evolutionarily well conserved throughout all vertebrate lineages and at least two genes similar to vertebrate YY1 are found in fly genomes. One of these YY1 homologues is involved in the Polycomb complex-mediated repression mechanism [15]. Recent studies also support a similar role of YY1 in this heritable silencing mechanism of vertebrates [16,17]. We have previously identified an unusual tandem array of multiple YY1 binding sites located within Peg3-DMR [8], and later confirmed the presence of similar clustered YY1 binding sites within the ICRs of Xist, Tsix, and Nespas [9]. The localization of these multiple YY1 binding sites within imprinting control regions is very unusual and suggests a potential role of YY1 in mammalian genomic imprinting.
In the current study, we have lowered the YY1 protein levels through RNA interference techniques and subsequently analyzed the short- and long-term effects of this YY1 knockdown on the transcription and DNA methylation of Peg3-DMR and other YY1-associated genomic regions. Our results indicate that YY1 may function as a controlling factor for the Peg3 and Gnas imprinted domains, and also that YY1 may be involved in maintaining the proper methylation status of these differentially methylated, imprinting control regions.
Result
The short-term effects of YY1 knockdown on the transcription of the Peg3 domain
Out of three siRNA constructs designed to knockdown YY1, we found one construct that consistently lowered the YY1 protein level in transiently transfected cells of both Neuro2A (Fig.1A) and NIH3T3 (data not shown). Western blot analyses indicated up to 90% reduction in the YY1 protein level in the transiently transfected cells by this YY1-siRNA construct, while both control cells with no transfection (NT) and with transfection using another siRNA construct containing a scrambled sequence (Scr) showed no change in the YY1 protein level. Two independent western blots using β-actin and p53 antibodies also confirmed the target-specific knockdown of YY1 by this siRNA construct.
Figure 1. Short-term effects of transient YY1 knockdown on transcription.
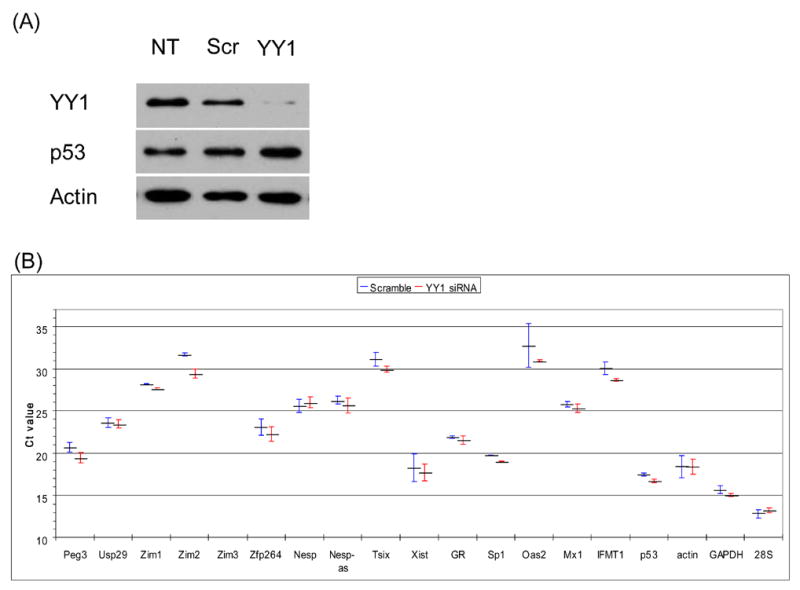
(A) Target-specific YY1 knockdown by YY1-siRNA. The protein extracts prepared from Neuro2A cells transfected with none (NT), a scramble siRNA control (Scr), and YY1-siRNA construct (YY1), were analyzed with western blotting using polyclonal antibodies against YY1, p53 and β-actin. Very low levels (~10%) of the YY1 protein was detected in the sample derived from YY1-siRNA transfected cells. (B) Short-term effects of YY1-knockdown on the transcriptional levels of various genes. Reverse transcription and following qRT-PCR were performed using two pools of total RNAs isolated from Scr-siRNA and YY1-siRNA transfected Neuro2A cells. The relative expression level of each gene, the name of which is shown on the X axis of the graph, was represented by arbitrary threshold cycle (Ct) number shown on the Y axis of the graph. The lower Ct values means the higher expression levels of the tested genes. The result set shown here is the summary of more than three independent trials, starting from transfection to qRT-PCR. The Ct value of each gene in a given trial was first normalized with ubiquitously expressing control genes (β-actin, GAPDH, and 28S), and later averaged with the values from other trials. The Ct value with standard deviation (S.D.) on the left of each gene was derived from Scr-siRNA transfected cells, while the right value was from YY1-siRNA transfected cells.
We analyzed the short-term (transient) effects of the YY1 knockdown on the transcription of the endogenous loci that are known to be associated with YY1 binding sites [9]. For this series of tests, total RNA was first isolated from two different pools of cells that had each been transiently transfected with the Scr- and YY1-siRNA constructs, respectively, and used to generate cDNA for real time quantitative RT-PCR. In this qRT-PCR scheme, the relative abundance of a given mRNA between two types of cells was measured by the difference in the arbitrary Ct (threshold cycle) values. As shown in Fig.1B, the set of 19 genes analyzed in this assay showed a broad range of averaged Ct values, indicating a wide range of expression levels among the individual genes in Neuro2A cells. The internal control genes that were used for the normalization of two different amounts of cDNA templates showed higher expression levels (β-actin, GAPDH, 28S). In contrast, the three genes that were included to monitor Interferon response showed much lower expression levels (Oas2, Mix1, IFMT1), confirming no Interferon response in our siRNA transfection experiments [18,19]. The imprinted genes in the Peg3 domain (Fig.2C; Peg3, Usp29, Zim1, Zim2, Zim3, Zfp264) also showed a wide range of expression levels in Neuro2A cells. Peg3, also known as Pw1 [20], showed the highest expression level, whereas Zim3 expression was not detectible at all. Comparison of Ct values of these genes revealed up-regulation of Peg3, Zim1, and Zim2 in the YY1-siRNA transfected cells. By contrast, the Ct value difference of Usp29 and Zfp264 may not be significant since two Ct values overlap within error ranges. We also tested the effects of YY1 knockdown on the expression levels of other YY1-associated genes, such as the genes in the Gnas and Xist/Tsix domains as well as other non-imprinted genes including Sp1 and GR (Glucocorticoid Receptor). Except for slight up-regulation in Sp1, most genes were not affected by transient YY1 knockdown. Overall, our transient knockdown experiments hinted one possibility that lowering the YY1 protein level may have an immediate impact, specifically, up-regulation, on the transcription of several genes in the Peg3 imprinted domain.
Figure 2. Long-term effects of YY1 knockdown on transcription.
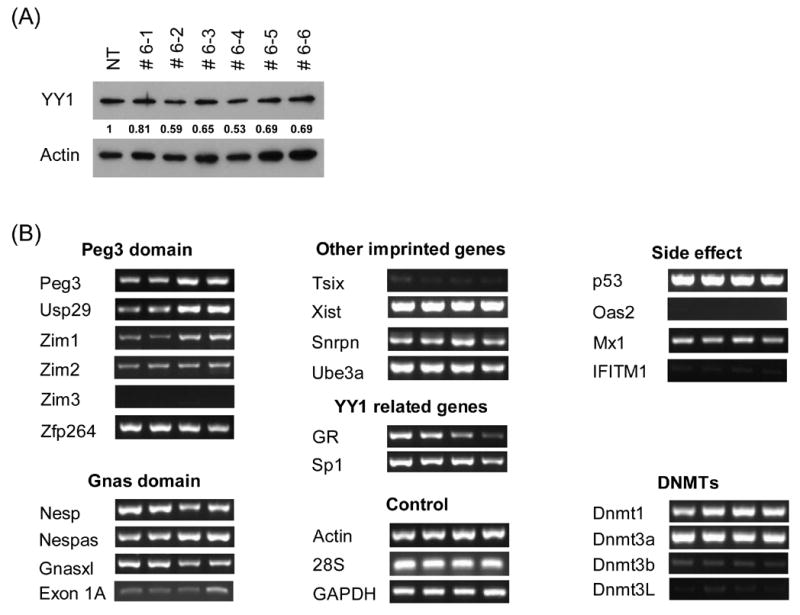
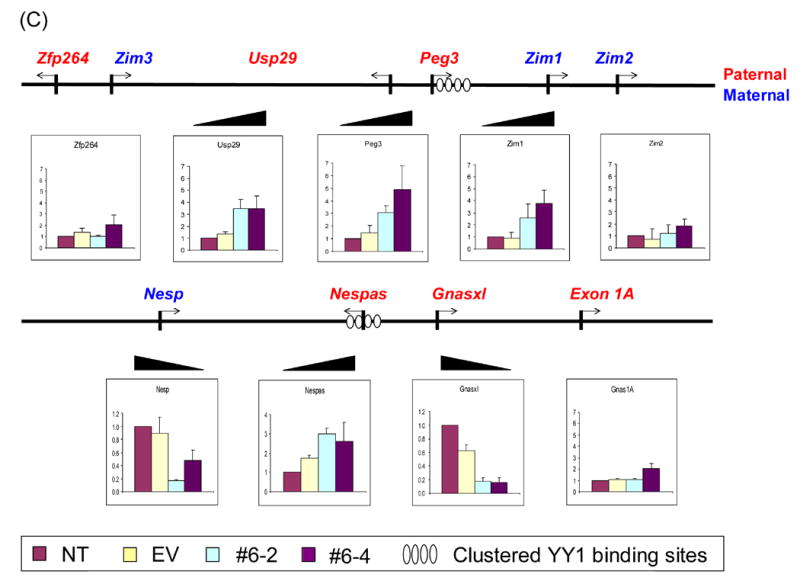
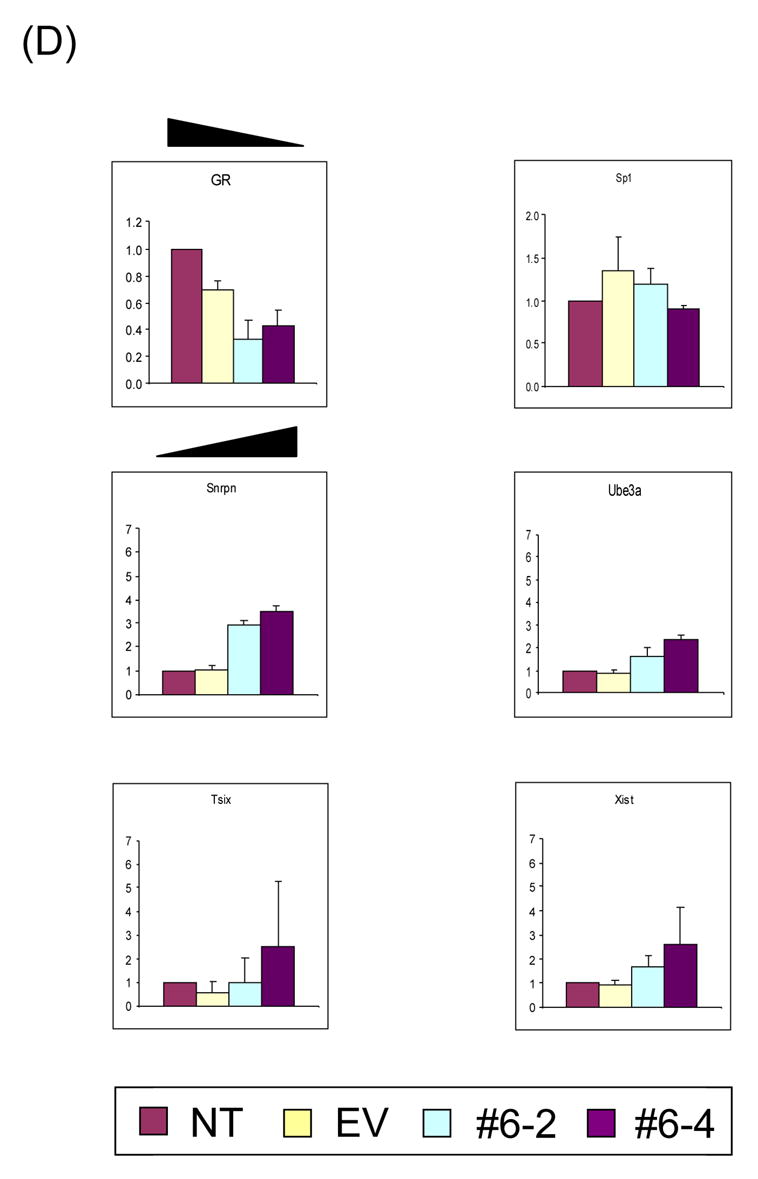
(A) Stable transfectants with YY1 knockdown. To derive stable transfectants with YY1 knockdown, a commercial vector pcDNA3.1/His/lacZ vector (Invitrogen) was modified by subcloning the YY1-targeting RNA portion into the 3′-UTR of the β-Gal gene in this vector. This vector along with another control vector lacking the YY1-targeting portion (Empty Vector, EV) were transfected into Neuro2A cells and selected with G418 (500 μg/ml). Six isolated single cells (#6–1 through −6) were analyzed with western blotting using polyclonal antibodies against YY1 and β-actin. The density of individual bands on the developed films have been first measured using the Gel Doc system (Bio-Rad), and later the normalized band densities relative to those of β-actin were subsequently calculated and used for determining the levels of YY1 knockdown. The lowest levels of YY1 were detected in two isolated cells, #6–2 and #6–4, as compared to the YY1 levels of NT (No Transfection) and EV. (B) Long-term effect on transcriptional levels of genes by YY1 knockdown. Long-term effect by YY1 knockdown were measured first by RT-PCR with fixed number of cycles ranging from 30 to 35. The expression levels of each gene were compared among 4 different cells: Lane 1, No Transfection; Lane 2, transfection with the EV vector lacking the YY1-targeting region; Lane 3, stable transfectant #6–2; Lane 4, stable transfectant #6–4. All the tested genes were grouped together based on the chromosomal location (Peg3 and Gnas domain), their association with YY1 (YY1 related genes), and also their purposes for our experiments (Control and Side Effect). We also included the analyses of DNA methyl transferases (DNMTs) to test the YY1 knockdown effects on the DNA methylation of several loci as shown in Fig.3. (C) Quantitative measurement of expression level changes in the Peg3 and Gnas domains. The initial observations drawn from fixed number of RT-PCR analyses shown above (Fig.2B) were analyzed further using quantitative RT-PCR techniques. The upper diagram shows the genomic layout of the Peg3 domain with the clustered YY1 binding site indicated by ovals. The lower diagram is for the Gnas domain. Each gene was analyzed similarly as RT-PCR using 4 different cells: NT, EV, #6–2, and #6–4. The expression level of each gene was first normalized with 3 different control genes ( β-actin, GAPDH, 28S), and later compared with the normalized level of the NT sample. The fold differences compared to the NT sample were presented for each gene. These qRT-PCR results were derived from three independent trials (n=3), starting from RNA isolation to qRT-PCR. (D) Quantitative measurement of expression level changes in other genes. The initial observations (Fig.2B) were analyzed further using qRT-PCR for GR, Sp1, Snrpn, Ube3a, Tsix, and Xist. Student’s t-test was performed to measure the statistical significance of all the observations drawn from the above results. In most cases, the P values were much smaller than 0.05, meeting statistical significance. However, some data points have P values greater than 0.05, such as the data set for Tsix and the #6–4 data set for Xist, and thus the observations regarding these loci need to be further investigated.
The long-term effects of YY1 knockdown on the transcription of imprinted domains
Using a similar RNAi strategy as described above, we also analyzed the long-term effects of YY1 knockdown on the transcription of the genes located within the Peg3- and other YY1-associated imprinted domains. For this analysis, an inverted DNA sequence derived from mouse YY1 was incorporated into the 3′-UTR of the ß-galactosidase gene in the pcDNA3.1/His/lacZ vector (Invitrogen). This scheme allowed us to easily monitor the expression of the YY1-targeting RNA portion by in situ ß-galactosidase staining. This construct along with a control pcDNA3.1/His/lacZ vector without the YY1-targeting portion (EV: empty vector) were transfected individually to Nuero2A cells to derive stable cell lines using G418 selection. Out of 6 stable single cell lines isolated, two cells (#6–2 and #6–4) showed the lowest levels of the YY1 protein (Fig.2A), and thus were selected for our analyses. Total RNA was first isolated from 4 different types of cells: two control cells, NT (No Transfection) and EV (Empty Vector), and two YY1 knockdown cells, #6–2 and #6–4. These isolated RNAs were used to compare the expression levels of a given gene among the different cells using 1) RT-PCR with fixed numbers of cycles, 30 to 35 cycles, (Fig.2B) and 2) quantitative RT-PCR (Fig.2C&D).
In the Peg3 imprinted domain, the expression of most of the resident genes except for Zim3 was detectible in the Neuro2A-derived stable cells, and also the expression levels of Peg3, Usp29, and Zim1 differed in two YY1 knockdown cells relative to the control cell lines. Another series of independent qRT-PCR analyses further confirmed that the expression levels of these three genes in the YY1 knockdown cell lines were higher than those of the control cell set, ranging from 3 to 5-fold (Fig.2C). This increase of expression levels in Peg3, Usp29, and Zim1 is consistent with the slight up-regulation of Peg3, Zim1, and Zim2 that was observed from the transient YY1 knockdown experiments (Fig.1B). It is interesting that, in both cases, more than one gene was affected similarly by YY1 knockdown.
In the Gnas domain, however, stable YY1 knockdown had opposite effects among the resident genes: whereas Nespas expression was increased (3-fold), decreased expression of Nesp (3 to 4-fold) and Gnasxl (5-fold) was observed in the YY1 knockdown cell lines (Fig.2B&C). Given the frequent detection of co-regulation between sense and antisense gene pairs in imprinted domains, the up- and down-regulation of Nespas/Nesp may represent two connected outcomes. By contrast, the expression levels of alternative transcript, Exon1A, were relatively low with no obvious difference among the cells except for the slight increase observed in the #6–4 cell.
In contrast to genes in the Peg3 and Gnas imprinted domains, the knockdown effects in stable cells were somewhat less obvious for other YY1-related genes, such as Xist and Snrpn, the latter of which is another YY1-involved imprinted gene identified independently by others [21]. Despite the fact that we detected no obvious difference by RT-PCR, qRT-PCR analyses revealed that Xist expression levels were slightly increased by 1.5 to 2 fold in the YY1 knockdown cells (Fig.2D). Likewise, the expression levels of Snrpn were also increased by 3 fold, which agrees well with the independent result derived from the studies of YY1-deleted mouse [22]. The expression change of GR in YY1 knockdown cells is readily noticeable by both RT-PCR and qRT-PCR, but other YY1-related, non-imprinted genes did not show any major change. Expression levels of many other genes were not affected by YY1 knockdown, including several DNA methyl transferases, CTCF, and macroH2A1 (data not shown). Taken together, long-term YY1 knockdown resulted in changed expression levels for the imprinted genes in the Peg3 and Gnas domains in a somewhat coordinated manner. The observed coordinated response may be an indication that YY1 is involved in the overall regulation of these imprinted domains, possibly through ICRs.
The long-term effects of YY1 knockdown on DNA methylation of imprinted domains
We have also investigated the DNA methylation status of Peg3, Nespas, and Xist DMRs to analyze potential long-term effects caused by YY1 knockdown. As shown in Fig.3A, genomic DNAs from 4 different Neuro2A cells were digested first with BamHI (Lane B), and later individually with methylation-insensitive MspI (Lane B+M) and methylation-sensitive HpaII (Lane B+H). Hybridizations with the two probes covering the promoter and YY1 binding regions of Peg3-DMR, respectively, showed different band patterns between the control cells versus YY1 knockdown cells. In YY1-knockdown cells, the sizes of methylated DNA fragments become smaller (Lane B+H), indicating DNA methylation loss in these cells. These initial results were further analyzed by performing bisulfite sequencing (Fig.3B). We have performed independently another southern blot using the restriction enzyme NarI, the recognition site of which overlaps with the sequence of YY1 binding sites (GGCGCCATCTT) that are located within Peg3-DMR. These results indicated that the CpG sites of the YY1 binding sites also lost DNA methylation in the YY1-knockdown Neuro2A cells (data not shown). These results again confirm the loss of methylation in Peg3-DMR. These results are also consistent with the up-regulation of Peg3 and Usp29 that we have observed in stable YY1 knockdown experiments (Fig.2C).
Figure 3. Long-term effects on the DNA methylation status of the DMRs of Peg3 (A), Nespas (C), and Xist (D).
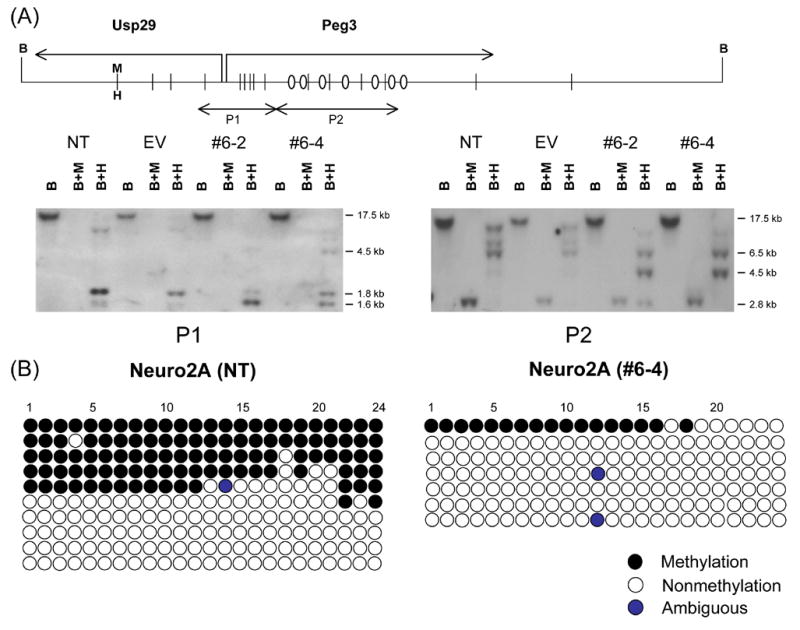
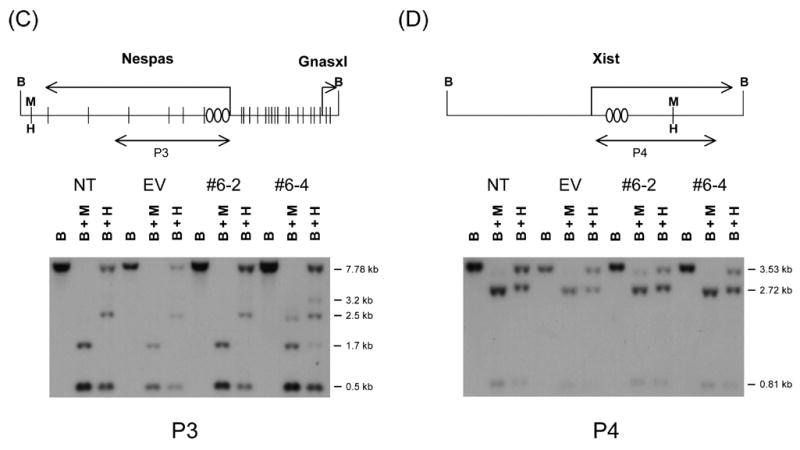
The schematic diagram for each DMR is shown on the upper panel, while the results derived from methylation analyses using southern blot and bisulfite sequencing approaches are shown on the lower panel. The schematic diagram shows the relative position of each DMR to BamHI sites (B) and two isoschizomer sites (MspI, methylation-insensitive; HpaII, methylation-sensitive). The diagram also indicates the genomic regions that have been used as probes for southern blotting, which are marked by double-headed arrows with P1 through 4. The ovals in the diagram represent YY1 binding sites. For the methylation analyses, four different genomic DNAs were isolated from the cells of NT, EV, #6–2, and #6–4. These DNAs were first digested with BamHI (Lane B), and later with MspI (Lane B+M) or HpaII (Lane B+H). (B) Two different DNAs from NT and #6–4 were also analyzed with the bisulfite sequencing method for the methylation analysis of the promoter region of Peg3. Each row represents one individual DNA strand derived from this bisilfite conversion reaction, while the 24 circles in each row represent individual CpG sites located within this 430-bp promoter region. Ten different clones were successfully sequenced for the NT sample whereas 7 clones for the #6–4 sample.
We also performed a similar set of methylation analyses on the DMR of Nespas, which is associated with multiple YY1 binding sites (Fig.3C). In the Nespas-DMR, one of the knockdown cells, #6–4, showed slightly different patterns as compared to those of two control cells, but the significance of this difference is uncertain. Overall, the methylation levels of Nespas-DMR did not appear to be affected by YY1 knockdown in Neuro2A cells.
By contrast, the Xist locus appears to have reduced levels of DNA methylation in YY1 knockdown cells (Fig.3D). In the two control cells, two different-size DNA fragments representing methylated and unmethylated DNA fragments were detected at a similar ratio in the BamHI/HpaII double digestion (Lane B+H). These two bands are thought to represent the two different X chromosomes of female origin Neuro2A cells, active and inactive X chromosomes. In the two knockdown cells, the smaller-size DNA fragment derived from unmethylated DNAs is more dominant, indicating that this particular CpG site has lost its DNA methylation in both YY1-knockdown cell lines. This is consistent with the detection of slight up-regulation of Xist in the two YY1-knockdown cells (Fig.2D). In sum, our DNA methylation analyses indicated that long-term YY1 knockdown results in hypomethylation in the DMRs of Peg3 and Xist, and this change is consistent with the transcriptional up-regulation observed in these two domains.
Discussion
RNAi-based YY1 knockdown experiments demonstrated that lowering YY1 protein levels caused global and somewhat coordinated changes in the expression levels of the genes located in the Peg3 and Gnas domains. The transcriptional up-regulation observed in the Peg3 domain was also accompanied with changes in the DNA methylation level of Peg3-DMR, suggesting a possible role of YY1 in maintaining the proper methylation status of this DMR sequence.
Our recent identification of multiple YY1 binding sites within the ICRs of Peg3, Nespas, and Xist/Tsix suggests that YY1 plays a role for the imprinting control of these domains [9]. Given the co-localization of YY1 binding sites in these differentially methylated regions, it is likely that YY1 plays a role in maintaining and/or establishing the allele-specific methylation of these regions. Consistently, our data showed that stable knockdown of YY1 resulted in hypomethylation in the DMRs of Peg3 and Xist (Fig.3). Similar observations have been made in the studies of CTCF binding sites in H19-ICR [10,11]. In this case, both ablation of CTCF binding sites within the H19-ICR and CTCF knockdown in mice resulted in hypermethylation of the H19-ICR, suggesting that CTCF may function as a protector for the unmethylated, maternal allele of the H19-ICR. This is somewhat opposite to the hypomethylation observed from YY1 knockdown stable cells in our experiments (Fig.3). In the case of Peg3-DMR, YY1 may be required for maintaining the methylated status of the inactive maternal allele. One likely scenario would be that YY1 recruits histone-modifying enzymes, such as HDACs, which are, in turn, required for DNA methylation [reviewed by 23]. This is plausible given the numerous interaction partners of YY1 that are involved in epigenetic modifications [reviewed by 13,14].
In the YY1-knockdown cells, the Peg3 and Gnas domains showed somewhat global and coordinated responses against lowering the YY1 protein levels (Fig.2C). In both domains, YY1 knockdown affected not a single gene but several genes in each domain. In the Peg3 domain, although the YY1 binding sites are located right next to the bidirectional promoter of Peg3 and Usp29, the impact of YY1 knockdown was also observed in Zim2 (transient experiments, Fig.1) and Zim1 (stable experiments, Fig.2). The transcription of all the affected genes in this domain was similarly up-regulated, and this up-regulation was also accompanied with hypomethylation in Peg3-DMR (Fig.3A). In the Gnas domain, multiple YY1 binding sites are located in the 1st intron of Nespas, but expression changes were detected in three genes, Nespas, Nesp, and Gnasxl (Fig.2C). In particular, the up- and down-regulation of Nespas and Nesp, respectively, is an expected outcome based on the antisense/sense relationship of the two genes, but only if YY1 is directly involved in the regulation of these two genes. The observed expression changes of the Nespas/Nesp pair, therefore, confirm that YY1 is indeed functionally involved in the regulation of the two genes. According to the results derived from mutant mice lacking the Nespas-DMR, which coincides exactly with the multiple YY1 binding region [24], deletion of this DMR affected the transcription and imprinting of all the genes in this domain. In this case, the absence of Nespas expression in the mutant mice resulted in the up-regulation of Nesp. This situation appears to be opposite to that represented in YY1-knockdown cells where Nespas is up-regulated and Nesp is down-regulated. Nevertheless, the observed responses in both experiments provide a consistent outcome, a coordinated response between Nespas and Nesp. Along with the overall up-regulation observed from the Peg3 domain, this coordinated response supports the idea that YY1 indeed plays a major role in the regulation of these two imprinted domains.
Materials and Methods
YY1 knockdown using RNA interference techniques
The sequences of siRNA constructs used for this study are as follows: YY1 siRNA, sense strand, 5′-GATCCCCGAGAGAACTCACCTCCTGATTCAAGAGATCAGGAGGTGAGTTCTC TCTTTTTGGAAA-3′; YY1 siRNA, antisense strand, 5′- AGCTTTTCCAAAAAGAGAGAACTCACCTCCTGATCTCTTGAATCAGGAGGTG AGTTCTCTCGGG-3′; Scramble siRNA, sense strand, 5′-GATCCCCAGGAGAAATAGGGGGACACTTCAAGAGAGTGTCCCCCTATTTCTC CTTTTTTGGAAA-3′; Scramble siRNA, antisense strand, 5′-AGCTTTTCCAAAAAAGGAGAAATAGGGGGACACTCTCTTGAAGTGTCCCCCT ATTTCTCCTGGG-3′. Duplex oligonucleotides were subcloned into the BglII and HindIII sites of pSUPER vector (OligoEngine). To make the stable YY1 knockdown cell lines, we first generated one inverted DNA fragment using a DNA fragment derived from the transcribed region of mouse YY1 (GenBank accession number: NM_009537, position: 1222–1607), and later this inverted fragment was subcloned into the 3′-UTR of the pcDNA3.1/His/lacZ vector (Invitrogen). These RNAi vectors were amplified in E. coli Sure 2 strain (Stratagene), which allows the accurate replication of inverted repeat-containing DNAs. These constructs were purified using the Hispeed plasmid midi kit (Qiagen), and transfected into cells using the GeneJuice transfection reagent according to the manufacturer’s protocol (Novagen). For stable transfection experiments, transfected cells were selected by adding G418 (500 μg/ml; Calbiochem) to the culture medium.
Western blot
For our western blot analysis, the cells were lysed 48 h after transfection using the lysis buffer (0.25M Tris-HCl, pH 7.8 + 0.1% NP40) for 30 min at 4 °C and cellular debris was removed by centrifugation for 10 min. Protein concentrations were determined by the Bradford assay kit (Pierce). Thirty micrograms of lysate was separated on 10% SDS-PAGE gels, transferred to the PVDF membrane (Hybond-P; Amersham) using Mini Trans-Blot transfer Cell (Bio-Rad). Membranes were blocked for 1 h in Tris Buffered Saline (TBS) containing 5% skim milk and 0.05% Tween-100 (TBS-T), and incubated at 4 °C overnight with anti-YY1 (sc-1703), anti-p53 (sc-6243) or anti-β-Actin (sc-1615) antibodies (SantaCruz Biotech). These blots were incubated for an additional 1 h with the secondary antibody linked to horseradish peroxidase (Sigma). The blots were developed using the Western blot detection system according to the manufacturer’s protocol (Intron Biotech).
RT-PCR and quantitative PCR
Total RNAs were first purified from transfected cells using Trizol as described by the manufacturer (Invitrogen); secondly, first-strand cDNA was reverse transcribed using the SuperScript First-Strand Synthesis System (Invitrogen); and finally PCR amplifications were performed with a series of specific primer pairs using Maxime PCR premix kit (Intron Biotech). Also, quantitative real time PCR was performed with iQ SYBR green supermix (Bio-Rad) using the icycler iQTM multicolor real-time detection system (Bio-Rad). All qPCR were carried out for 40 cycles under the standard PCR conditions. We analyzed the results of quantitative real time PCR based on the threshold cycle (Ct) value. A Δ Ct was first calculated by subtracting the averaged Ct value of three internal controls from the averaged Ct value of a target gene, and later Δ Δ Ct value was calculated by subtracting the Δ Ct value for the targeted gene of YY1 knockdown sample from the Δ Ct value for that of the control. Fold differences were determined by raising 2 to the Δ Δ Ct power [25]. The primer sequences and PCR conditions are available upon request.
Southern blot and bisulfite sequencing
Genomic DNAs were purified using DNAzol (Invitrogen), and 5 μg of each genomic DNA was first digested with BamHI and later with either MspI or HpaII. These double-digested DNAs were separated on a 0.8% agarose gel, and transferred by capillary blotting onto the Hybond nylon membranes (Amersham). Membranes were hybridized with the 32P-labeled probes as indicated in the figures and analyzed by autoradiography. The probes used for this study are as follows: a 1.3-kb fragment corresponding to the Peg3 promoter, a 2.3-kb fragment for Peg3 YY1 binding region, a 1.95-kb fragment for Nespas YY1 binding region, and a 1.88-kb fragment of Xist YY1 binding region. The methylation status of the promoter region of mouse Peg3 (GenBank accession number AC020961; 106803–107240) was also analyzed using the bisulfite sequencing method [26]. The DNAs isolated from NT and #6–4 were first digested with BamHI, purified with Phenol/Chloroform extraction, and precipitated with ethanol. For the bisulfite conversion reaction, these DNAs were treated with the EZ DNA methylation kit (Zymo Research). The resultant single-stranded DNAs were used as templates for the PCR reaction using specific primers that were designed for the C-to-T converted DNAs. The sequences for these primers are as follow: Peg3 Promoter F (5′-AGAGGGTGTTGTAGAGTAGTTAGGTG-3′) and Peg3 Promoter R (5′-CATCCCTTCACACCCACATCCCATCC-3′). The PCR products were subcloned into the TOPO TA cloning vector (Invitrogen) for sequencing.
Acknowledgments
We thank Dr. Prescott Deininger for critical reading of our manuscript. This research was supported by National Institutes of Health R01 GM66225, National Science Foundation EPS-0346411 and the State of Louisiana Board of Regents Support Fund (J.K).
Footnotes
Publisher's Disclaimer: This is a PDF file of an unedited manuscript that has been accepted for publication. As a service to our customers we are providing this early version of the manuscript. The manuscript will undergo copyediting, typesetting, and review of the resulting proof before it is published in its final citable form. Please note that during the production process errorsmaybe discovered which could affect the content, and all legal disclaimers that apply to the journal pertain.
References
- 1.Bartolomei MS, Tilghman SM. Genomic imprinting in mammals. Annu Rev Genet. 1997;31:493–525. doi: 10.1146/annurev.genet.31.1.493. [DOI] [PubMed] [Google Scholar]
- 2.Brannan CI, Bartolomei MS. Mechanisms of genomic imprinting. Curr Opin Genet Dev. 1999;9:164–170. doi: 10.1016/S0959-437X(99)80025-2. [DOI] [PubMed] [Google Scholar]
- 3.Spahn L, Barlow DP. An ICE pattern crystallizers. Nat Genet. 2003;35:11–12. doi: 10.1038/ng0903-11. [DOI] [PMC free article] [PubMed] [Google Scholar]
- 4.Constancia M, Pickard B, Kelsey G, Reik W. Imprinting mechanisms. Genome Res. 1998;8:881–900. doi: 10.1101/gr.8.9.881. [DOI] [PubMed] [Google Scholar]
- 5.Reik W, Walter J. Imprinting mechanisms in mammals. Curr Opin Genet Dev. 1998;8:154–164. doi: 10.1016/s0959-437x(98)80136-6. [DOI] [PubMed] [Google Scholar]
- 6.Bell AC, Felsenfeld G. Methylation of a CTCF-dependent boundary controls imprinted expression of the Igf2 gene. Nature. 2000;405:482–485. doi: 10.1038/35013100. [DOI] [PubMed] [Google Scholar]
- 7.Hark AT, Schoenherr CJ, Katz DJ, Ingram RS, Levorse JM, Tilghman SM. CTCF mediates methylation-sensitive enhancer-blocking activity at the H19/Igf2 locus. Nature. 2000;405:486–489. doi: 10.1038/35013106. [DOI] [PubMed] [Google Scholar]
- 8.Kim J, Kollhoff A, Bergmann A, Stubbs L. Methylation-sensitive binding of transcription factor YY1 to an insulator sequence within the paternally expressed imprinted gene, Peg3. Hum Mol Genet. 2003;12:233–245. doi: 10.1093/hmg/ddg028. [DOI] [PubMed] [Google Scholar]
- 9.Kim JD, et al. Identification of clustered YY1 binding sites in imprinting control regions. Genome Res. 2006;16:901–911. doi: 10.1101/gr.5091406. [DOI] [PMC free article] [PubMed] [Google Scholar]
- 10.Schoenherr CJ, Levorse JM, Tilghman SM. CTCF maintains differential methylation at the Igf2/H19 locus. Nat Genet. 2003;33:66–69. doi: 10.1038/ng1057. [DOI] [PubMed] [Google Scholar]
- 11.Fedoriw AM, Stein P, Svoboda P, Schultz RM, Bartolomei MS. Transgenic RNAi reveals essential function for CTCF in H19 gene imprinting. Science. 2004;303:238–240. doi: 10.1126/science.1090934. [DOI] [PubMed] [Google Scholar]
- 12.Shi Y, Lee JS, Galvin KM. Everything you ever wanted to know about Yin Yang 1. Biochim Biophys Acta. 1997;1334:F49–F66. doi: 10.1016/s0304-419x(96)00044-3. [DOI] [PubMed] [Google Scholar]
- 13.Thomas MJ, Seto E. Unlocking the mechanisms of transcription factor YY1: are chromatin modifying enzymes the key? Gene. 1999;236:197–208. doi: 10.1016/s0378-1119(99)00261-9. [DOI] [PubMed] [Google Scholar]
- 14.Gordon S, Akoryan G, Garban H, Bonavida B. Transcription factor YY1: structure, function, and therapeutic implications in cancer biology. Oncogene. 2006;25:1125–1142. doi: 10.1038/sj.onc.1209080. [DOI] [PubMed] [Google Scholar]
- 15.Brown JL, Mucci D, Whiteley M, Dirksen ML, Kassis JA. The Drosophila Polycomb group gene pleiohomeotic encodes a DNA binding protein with homology to the transcription factor YY1. Mol Cell. 1998;1:1057–1064. doi: 10.1016/s1097-2765(00)80106-9. [DOI] [PubMed] [Google Scholar]
- 16.Satijn DPE, Hamer KM, Blaawen JD, Otte AP. The polycomb group protein EED interact with YY1, and both proteins induce neural tissue in Xenopus embryos. Mol Cell Biol. 2001;21:1360–1369. doi: 10.1128/MCB.21.4.1360-1369.2001. [DOI] [PMC free article] [PubMed] [Google Scholar]
- 17.Caretti G, Di Padova M, Micales B, Lyons GE, Sartorelli V. The Polycomb Ezh2 methyltransferase regulates muscle gene expression and skeletal muscle differentiation. Genes Dev. 2004;18:2627–2638. doi: 10.1101/gad.1241904. [DOI] [PMC free article] [PubMed] [Google Scholar]
- 18.Khabar KS, et al. Effect of deficiency of the double-stranded RNA-dependent protein kinase, PKR, on antiviral resistance in the presence or absence of ribonuclease L: HSV-1 replication is particularly sensitive to deficiency of the major IFN-mediated enzymes. J Interferon Cytokine Res. 2000;20:653–659. doi: 10.1089/107999000414835. [DOI] [PubMed] [Google Scholar]
- 19.Sledz CA, Holko M, de Veer MJ, Silverman RH, Williams BRG. Activation of the interferon system by short-interfering RNAs. Nat Cell Biol. 2003;5:834–839. doi: 10.1038/ncb1038. [DOI] [PubMed] [Google Scholar]
- 20.Relainx F, et al. Pw1, a novel zinc finger gene implicated in the myogenic and neuroal lineages. Dev Biol. 1996;177:383–396. doi: 10.1006/dbio.1996.0172. [DOI] [PubMed] [Google Scholar]
- 21.Rodriguez-Jato S, Nicholls RD, Driscoll DJ, Yang TP. Characterization of cis- and trans-acting elements in the imprinted human SNURF-SNRPN locus. Nucleic Acids Res. 2005;33:4740–4753. doi: 10.1093/nar/gki786. [DOI] [PMC free article] [PubMed] [Google Scholar]
- 22.Affar EB, Gay F, Shi Y, Liu H, Huarte M, Wu S, Collins T, Li E, Shi Y. Essential dosage-dependent functions of the transcription factor yin yang 1 in late embryonic development and cell cycle progression. Mol Cell Biol. 2006;26:3565–3581. doi: 10.1128/MCB.26.9.3565-3581.2006. [DOI] [PMC free article] [PubMed] [Google Scholar]
- 23.Jaenisch R, Bird A. Epigenetic regulation of gene expression: how the genome integrates intrinsic and environmental signals. Nat Genet. 2003:245–254. doi: 10.1038/ng1089. Supp. [DOI] [PubMed] [Google Scholar]
- 24.Williamson CM, et al. Identification of an imprinting control region affecting the expression of all transcripts in the Gnas cluster. Nat Genet. 2006;38:350–355. doi: 10.1038/ng1731. [DOI] [PubMed] [Google Scholar]
- 25.Winer J, Jung CK, Shackel I, Williams PM. Development and validation of real-time quantitative reverse transcriptase-polymerase chain reaction for monitoring gene expression in cardiac myocytes in vitro. Anal Biochem. 1999;270:41–49. doi: 10.1006/abio.1999.4085. [DOI] [PubMed] [Google Scholar]
- 26.Frommer M, et al. A genomic sequencing protocol that yields a positive display of 5′-methylcytosine residues in individual DNA strands. Proc Natl Acad Sci USA. 1992;89:1827–1831. doi: 10.1073/pnas.89.5.1827. [DOI] [PMC free article] [PubMed] [Google Scholar]