

Abstract
Walking on a rotating platform for 15 minutes causes healthy subjects to involuntarily turn when walking without vision. This adaptive response, called podokinetic after-rotation (PKAR), uses the same kinematic patterns as voluntary turning suggesting that PKAR and voluntary turning share common mechanisms. The purpose of this study is to determine whether people with Parkinson disease (PD), a condition that produces substantial disability from turning difficulties, can adapt to the rotating platform. Initial testing of people with PD revealed that most were unable to step on the rotating platform for 15 continuous minutes. We thus tested a less intense version of the paradigm in eight healthy people. On one day, subjects walked on the platform for 15 continuous minutes; on another day, they walked on the platform for three 5 minutes intervals separated by 5 minute rests. After both sessions, subjects rested for 5 min. then walked in place for 30 min. without vision, while we recorded rotational velocity of PKAR. Continuous and interval protocols effectively elicited robust PKAR. We then tested eight subjects with PD and matched controls using the 5 min. interval protocol and recorded PKAR responses for 10 min. There were no significant differences between the PD and control groups. We conclude that PD subjects can adapt to the rotating platform and develop PKAR from interval training. Future studies are needed to determine whether the rotating platform may act as a rehabilitative tool to reinforce motor patterns for turning and alleviate turning difficulties in people with PD.
Keywords: adaptation, locomotion, turning, Parkinson disease, PKAR
1. INTRODUCTION
Parkinson disease (PD) is a neurodegenerative condition that produces substantial disability in nearly one million affected people in the United States (Strickland and Bertoni, 2004). Difficulty turning is especially problematic and increases risk for falls in PD (Giladi et al., 1992, Nieuwboer et al., 1998, Charlett et al., 1998, Bloem et al., 2001, Stack and Ashburn, 1999). These falls confer an eight fold greater risk for hip fracture compared to falls during straight walking (Cumming and Klineberg, 1994). Moreover, turning frequently triggers freezing, a sudden interruption of ongoing movement, possibly further increasing fall risk (Giladi et al., 1992, Lamberti et al., 1997, Schaafsma et al., 2003, Bloem et al., 2004).
Gordon et al. (1995) demonstrated that the somatosensory system involved in directional control of locomotor trajectory through foot contact with the floor, the podokinetic (PK) system, is adaptable in healthy individuals. Fifteen minutes of PK stimulation that consists of stepping in-place on the axis of a rotating platform produces a robust after-effect called podokinetic after-rotation (PKAR). During PKAR, subjects involuntarily turn relative to space when asked to step in-place or walk in a straight line without vision (Gordon et al., 1995, Weber et al., 1998). PKAR may be controlled by a centrally stored memory of the relationship between somatosensory afferents and locomotor efferents. PKAR and voluntary turning have similarities in transverse plane kinematics in that both employ a movement strategy that initiates the turn with the head first, followed by the trunk then the feet (Earhart and Hong, 2006). If the ability to adapt to PK stimulation is present in people with PD then the rotating platform may potentially serve as a helpful rehabilitative tool for turning difficulties.
Several studies have shown that people with PD retain the ability to adapt and modify motor output. For instance, subjects with PD can adapt to prisms that alter visual input (Stern et al., 1988, Fernandez-Ruiz et al., 2003), adapt handwriting size in response to visual feedback that displays gain (Contreras-Vidal et al., 2002) and modify cadence appropriately with changes in walking speed (Morris et al., 1994). These results suggest that people with PD not only retain ability for motor adaptation but also that such adaptive strategies may provide functional benefit. Patients with PD also respond better to external rather than internally generated cues to trigger voluntary movement (Horstink et al., 1990, Bagley et al., 1991, Majsak et al., 1998, Marchese et al., 2000, Siegert et al., 2002). Treadmill training is beneficial in improving gait parameters and reducing the number of falls in people with PD (Pohl et al., 2003, Frenkel-Toledo et al., 2005, Protas et al., 2005). Additionally, training on the treadmill with body weight support has been shown to have both immediate and long-term effects on improving gait (Miyai et al., 2000 & 2002). However, no one has reported the capability of people with PD to adapt locomotor trajectory in response to stepping on a rotating platform.
The primary aim of this pilot study was to determine whether people with PD retain the ability to adapt to PK stimulation and demonstrate PKAR after walking on the rotating platform. In designing a PK stimulation protocol appropriate for those with PD, who may have difficulty completing a long, continuous PK stimulation session, we also needed to determine whether multiple short interval exposures to PK stimulation elicit robust PKAR as effectively as a single long exposure to PK stimulation.
2. RESULTS
2.1 Study 1: Continuous vs. interval PK stimulation
PKAR following 5 minute intervals of PK stimulation was similar to that following 15 minutes of continuous PK stimulation. Velocity profiles during 30 minutes of PKAR response for one young control subject following continuous and interval PK stimulation are shown in Figure 1a. Figure 1b shows group data for continuous and interval protocols.
Figure 1.
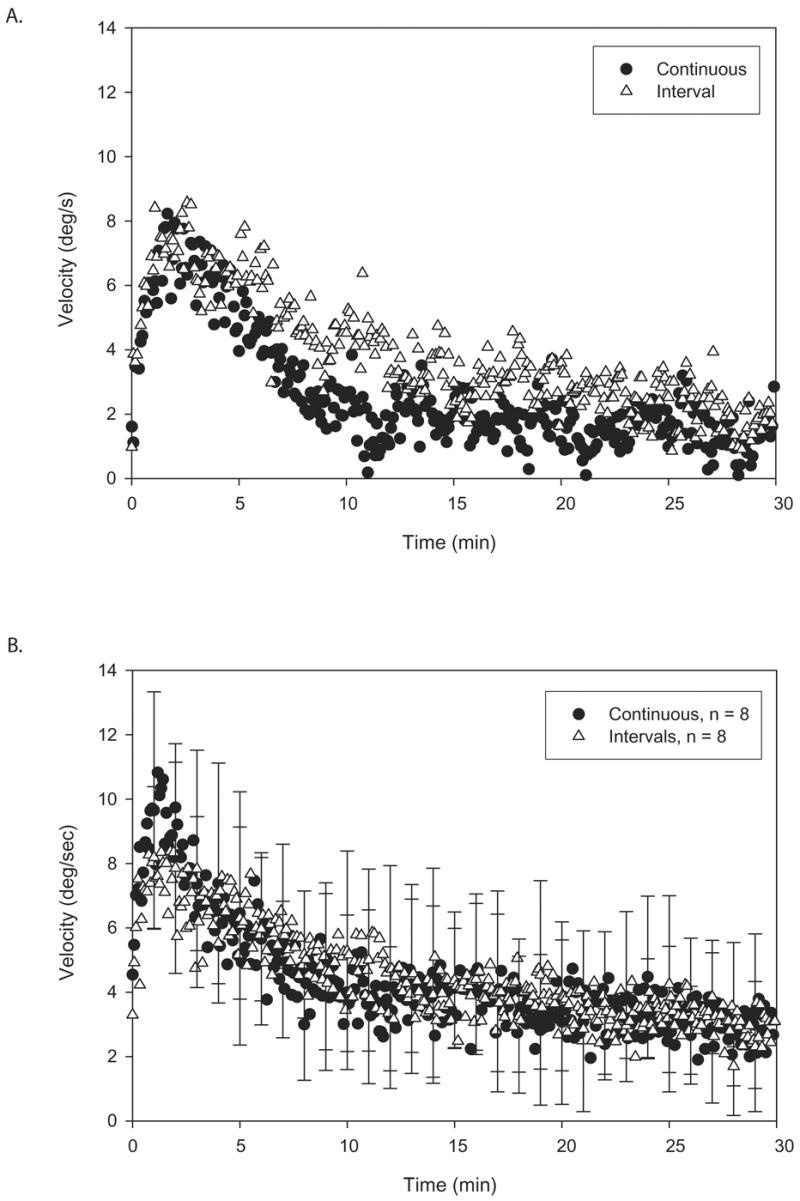
A. Illustration of individual plots of a young control subject’s trunk angular velocities during 30 minutes of PKAR after long continuous PK stimulation (filled circles) versus PK stimulation in short intervals (open triangles). Note the similarities between the two plots. B. Illustration of group plots of mean trunk angular velocities during 30 minutes of PKAR after long continuous PK stimulation (filled circles) versus PK stimulation is short intervals (open triangles). Standard deviation (SD) is marked at every minute. Note the overlap of the curves for the two conditions. Both protocols elicited robust PKAR responses.
Interval and continuous stimulation produced similar PKAR responses (Table 1). The maximum velocity calculated from the initial 2 minutes was greater for the continuous protocol compared to the interval protocol (p = 0.03) whereas the other variables were not significantly different due to high variability. Regardless, interval PK stimulation produced robust PKAR as effectively as continuous PK stimulation. Also, comparison of curve fit parameters from the initial 10 minutes of data vs. the full 30 minutes of data did not reveal any significant differences.
TABLE 1.
Interval vs. Continuous
| Interval | Continuous | |||
|---|---|---|---|---|
| 0–2 min | 0–2 min | |||
|
Maximum velocity
Rise time constant |
8.34 ± 1.02
0.2 ± 0.08 |
9.78 ± 1.05 *
0.16 ± 0.07 |
||
|
Asymptote initial velocity Decay time constant |
2–10 min | 2–30 min | 2–10 min | 2–30 min |
| −5.23 ± 5.52
11.21 ± 7.85 23.04 ± 9.38 |
0.9 ± 1.43
8.07 ± 0.93 18.51 ± 5.74 |
−0.26 ± 1.92
16.58 ± 4.40 12.75 ± 4.87 |
3.01 ± 0.84
7.94 ± 1.13 7.92 ± 2.58 |
|
All values are average ± SE
= p< .05, paired t-test of maximum velocity for interval vs. continuous; all other comparisons were nonsignificant. For interval testing comparing 2–10 min vs. 2–30 min: Asymptote: p=0.34; Initial velocity: p=0.69; Decay time constant: p=0.74. For continuous testing comparing 2–10 min vs. 2–30 min: Asymptote: p=0.17; Initial velocity: p=0.09; Decay time constant: p=0.44
2.2 Study 2: PD vs. controls
PKAR responses of subjects with PD were similar to those of control subjects, as demonstrated by the similarity of the PKAR curves from a typical subject with PD and a matched control (Figure 2a) as well as the similarities of composite curves for the two groups (Figure 2b). The lack of difference between the two groups is also reflected by similar values obtained from the parameter estimations (Table 2). Although the means of the groups do not overlap, statistical tests of curve fit parameters revealed no differences due to high variability.
Figure 2.
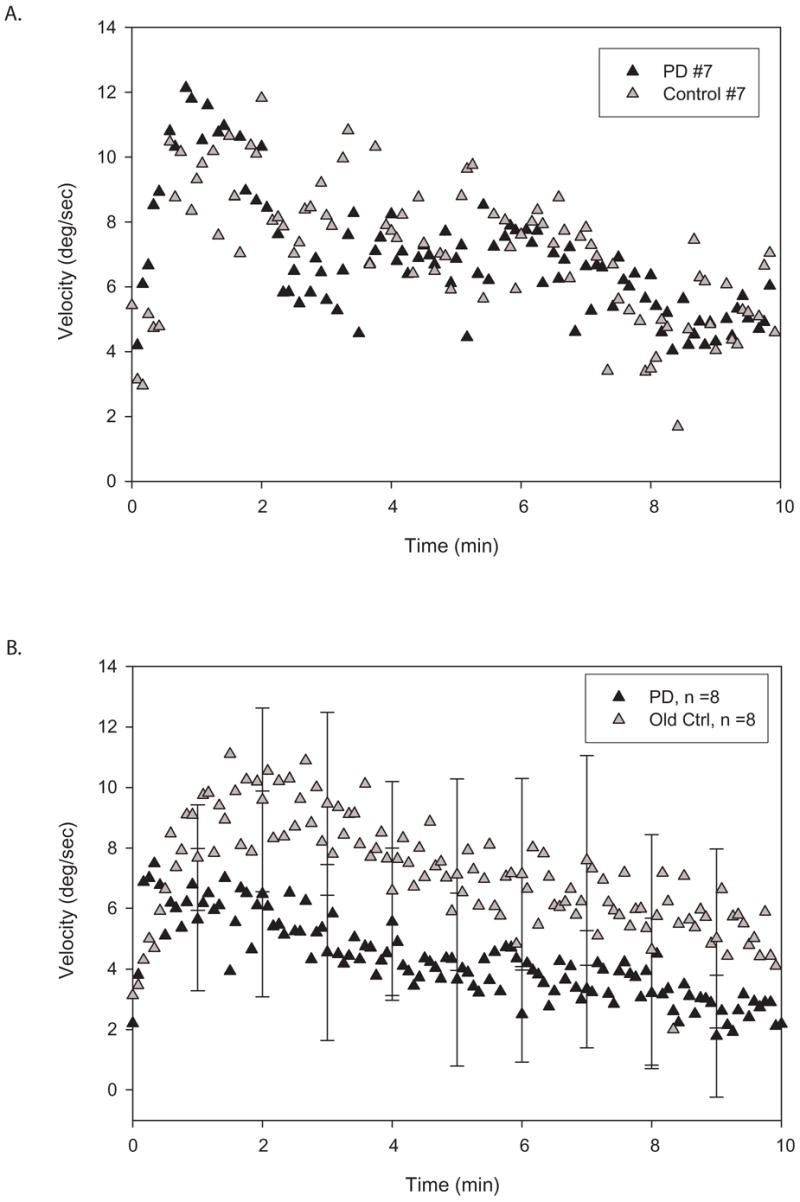
A. Illustration of individual plots of trunk angular velocities from a subject with PD (black triangles) and a matched control subject (gray triangles) during 10 minutes of PKAR after PK stimulation in short intervals. Note the similarities of the two curves. B. Illustration of group plots of mean trunk angular velocities during 10 minutes of PKAR in PD (black triangles) versus control (gray triangles) groups after PK stimulation in short intervals. SD is marked at every minute. The shape of the curves are very similar and there is substantial overlap of the error bars. Both groups showed robust PKAR responses.
Table 2.
Control vs. PD
| Control | PD | |
|---|---|---|
| 0–2 min | 0–2 min | |
|
Maximum velocity
Rise time constant |
10.73 ± 1.85
0.38 ± 0.08 |
10.5 ± 2.72
0.72 ± 0.44 |
|
Asymptote Initial velocity Decay time constant |
2–10 min | 2–10 min |
| −0.86 ± 3.26
15.68 ± 3.58 13.00 ± 5.03 |
−5.36 ± 4.12
16.5 ± 4.97 24.63 ± 12.14 |
All values are average ± SE
2.3 Young vs. old
PKAR responses were similar in healthy young compared to healthy old subjects. Velocity profiles reflect these similarities from an individual young and an individual old control (Figure 3a) as well as for the two groups (Figure 3b). Once again, curve fit values illustrate the similarities between groups (Table 3). There were no significant differences between the young and old control subjects due to high variability. Note that interval protocol data for the first 10 minutes were used from study 1 for this comparison because that was the protocol used for study 2.
Figure 3.
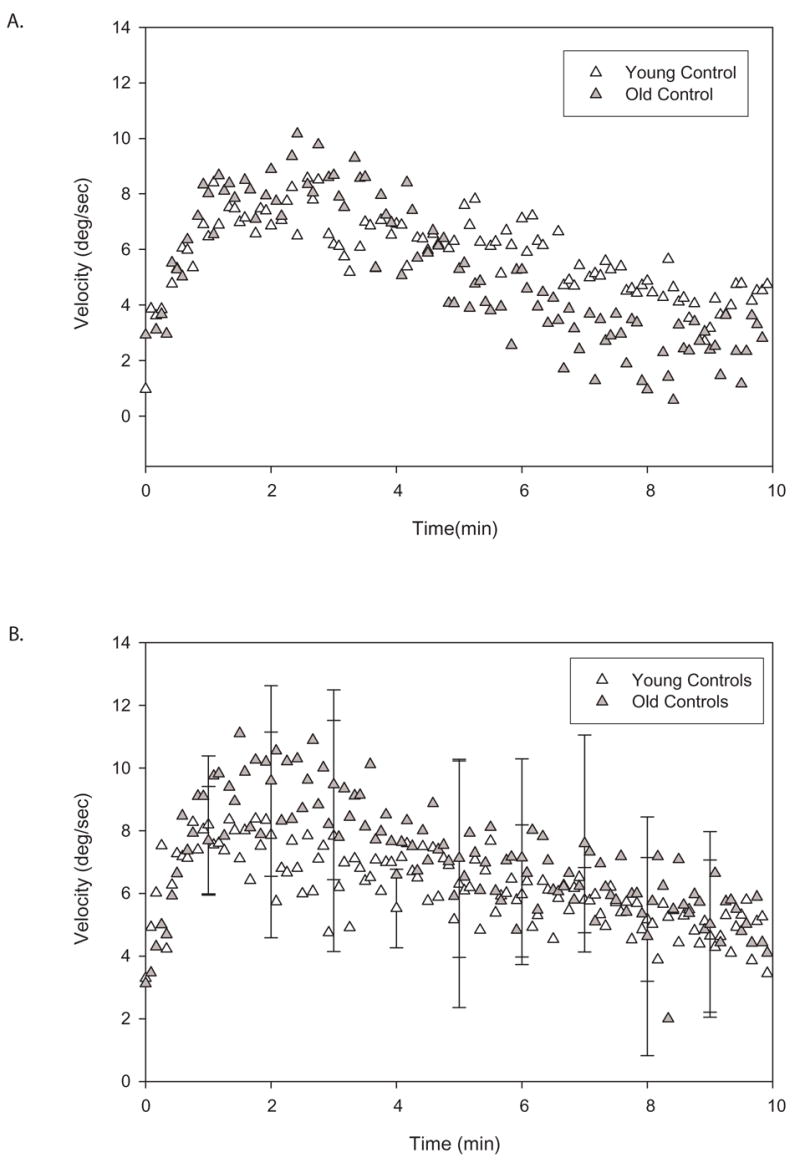
A. Illustration of individual plots of trunk angular velocities during 10 minutes of PKAR in a young (open triangles) and an old (gray triangles) control subjects after PK stimulation in intervals. Note the similarities of the two curves. B. Illustration of group plots of mean trunk angular velocities during 10 minutes of PKAR in young (open triangles) versus old (gray triangles) controls after PK stimulation in short intervals. SD is marked at every minute. There is substantial amount of overlap in the two curves. PKAR does not appear to be age-dependent.
Table 3.
Young vs. Old
| Young | Old | |
|---|---|---|
| 0–2 min | 0–2 min | |
|
Maximum velocity
Rise time constant |
8.34 ± 1.02
0.20 ± 0.08 |
10.73 ± 1.85
0.38 ± 0.08 |
|
Asymptote Initial velocity Decay time constant |
2–10 min | 2–10 min |
| −5.23 ± 5.52
11.21 ± 7.85 23.04 ± 9.38 |
−0.86 ± 3.26
15.68 ± 3.58 13.00 ± 5.03 |
All values are average ± SE
3. DISCUSSION
We found that PKAR responses to PK stimulation were similar in subjects with PD and matched controls. Interval compared to continuous stimulation did not produce substantially different PK responses. Finally, we did not find any difference between young and old control subjects’ PKAR responses.
3.1 PKAR in PD
Do patients with PD retain the ability to adapt locomotor trajectory in response to PK stimulation as do healthy individuals?
Our results agree with other studies indicating that people with PD retain the ability to modify movements in response to external cues and can adapt motor output in different situations (Stern et al., 1988, Fernandez-Ruiz et al., 2003, Contreras-Vidal et al., 2002, Morris et al., 1994, Zijlstra et al., 1998, Dietz et al., 1995). This is the first study that examines the capability of people with PD to adapt locomotor trajectory in response to stepping on a rotating platform, a task that requires generation of motor patterns for turning during walking. Based on our results, we conclude that subjects with mild PD are able to adapt locomotor trajectory in response to walking on a rotating platform and demonstrate similar PKAR velocity profiles as their age- and gender-matched controls. However, our sample only includes patients in the early stages of PD and patients with more advanced PD may demonstrate different responses. Additionally, the auditory cueing of the metronome may have helped subjects with PD step better, but its use was necessary as previous work has shown that cadence must be controlled since it influences PKAR (Earhart and Horak, 2004).
3.2 Neural Substrates of PKAR
Where is PK adaptation being stored?
Jurgens et al. (1999) propose that PKAR is due to adaptation of the somatosensory channel to long-lasting unidirectional stimulation which may occur at the peripheral or central level. Studies that demonstrated transfer of podokinetic adaptation, i.e. from stepping to hopping or forward to backward walking, suggest that this adaptation is being stored centrally (Earhart et al., 2001, Earhart et al., 2002c). Gordon et al. (2003) demonstrated use of optokinetic stimulation to induce PKAR and suggest that the storage site may be at the level of the brainstem oculomotor system.
Previous studies also have demonstrated that the cerebellum is important for regulating the magnitude of PKAR but is probably not the storage site for PKAR since other characteristics, i.e. decay time constant and asymptote, remained the same in people with cerebellar degeneration as in healthy people (Earhart et al., 2002a,b). Additionally, vestibular inputs influence the initial two minutes of PKAR to counteract podokinetic acceleration but are not required for expression of PKAR (Earhart et al., 2004).
The results of this study imply that basal ganglia abnormalities associated with PD do not preclude PKAR expression. The basal ganglia are not likely the site of storage but may possibly influence PKAR. However, this cannot be demonstrated with the high variability of our data. Our previous work and work of Gordon et al. (2003) indicate that the storage site must receive inputs from cerebellum, vestibular system, visual system and the somatosensory system, whereas the current study cannot exclude an influence of basal ganglia. Based upon known electrophysiological studies and anatomical connections between these regions and cerebellum, vestibular system, visual system, somatosensory system and the basal ganglia, putative storage sites are likely at the brainstem level and may include mesencephalic locomotor region or the medullary reticular formation (Hathout and Bhidayasiri, 2005, Matsuyama and Drew, 2000, Pahapill and Lozano, 2000).
3.3 Implications for Future Research
Continuous or Interval PK Stimulation?
The continuous and interval protocols produced similar PKAR profiles except that maximum velocity was significantly slower with interval stimulation. The effect of PK stimulation may diminish during the 5 minute rest periods between intervals of walking on the rotating platform. Interestingly, this difference in maximum velocity did not affect any other variable, so the potential importance of this difference remains unclear. Since both protocols effectively elicited PKAR responses, the less strenuous interval PK stimulation model appears more appropriate for future studies of patient populations for whom the traditional continuous protocol is difficult.
Is 10 minutes of PKAR sufficient?
Subjects in both the PD group and the older adult control group were not able to tolerate 30 minutes of stepping in place after interval PK stimulation. This may be due to decreased endurance in the elderly population. All subjects were able to complete 10 minutes of stepping in place and therefore we analyzed the data for this study by fitting the exponential decay function to PKAR data from minutes 2–10. We demonstrated the validity of this approach by finding comparable results from data analysis of 2–10 minutes with the results from all 30 minutes of data collection. Not only did the curves look similar but we also found similar curve function parameters obtained from 2–10 minutes of data with ones obtained from 2–30 minutes of data. Additionally, comparisons of PKAR responses in young control subjects from study 1 and old control subjects from study 2 revealed no differences. Therefore, we were confident in our method using only 10 minutes of data for subjects that participated in study 2 since they could not perform the full 30 minutes of PKAR after PK stimulation. We advocate the use of this 10-minute method in future studies of PKAR with populations unable to perform the full 30 minutes of PKAR.
3.4 Potential Clinical Implications
Our findings have important implications because successful rehabilitation is dependent on an individual’s potential to respond to rehabilitative strategies that adaptively modify impaired movement patterns. Given the limitations of current treatment techniques and the prevalence of gait disturbances in PD, developing new rehabilitative methods is crucial. Our results are in agreement with previous studies that demonstrated people with PD retain the ability to adapt to treadmill training and alter locomotor behavior (Pohl et al., 2003, Frenkel-Toledo et al., 2005, Protas et al., 2005). Some authors believe that the treadmill is serving as an external cue and therefore treadmill training is more effective than level ground walking (Frenkel-Toledo et al., 2005). We think that the rotating platform may serve as a training tool to reinforce turning patterns. Adaptation to the rotating platform may reinforce motor patterns of turning and help improve turning ability in patients with PD. Further studies will be needed to determine the potential therapeutic effects of the rotating platform.
4. EXPERIMENTAL PROCEDURE
4.1 Subjects
We studied 28 subjects including 12 with PD diagnosed using standard clinical criteria (Racette et al., 1999) and 16 controls. Subjects with PD were recruited from the Washington University School of Medicine’s Movement Disorders Center. Control subjects were screened to ensure that they did not have any history or evidence of neurological abnormality. All subjects gave informed consent to perform experimental procedures that were approved by the Human Studies Committee at Washington University School of Medicine. Initially, 4 subjects with PD (3 men) with a mean age of 71 (+/− 2.5) participated in our study and attempted to walk on the rotating platform for 15 continuous minutes followed by stepping in place for 30 minutes while wearing a blindfold and earplugs. None of the 4 subjects were able to complete the 15 minutes of continuous walking on the rotating platform due to fatigue. Thus we modified the protocol from continuous walking to walking in multiple short intervals. In Study 1, we examined PKAR after walking on the rotating platform for 15 continuous minutes versus three 5-minute intervals with 5-minute rests in between. For this study, we recruited eight healthy subjects (1 man) with a mean age of 24 (+/− 2.6). In study 2, we used the modified interval protocol to determine whether subjects with PD demonstrate PKAR. Eight subjects with idiopathic PD (6 men) and eight age- and gender-matched controls participated in the study. Their mean ages were 63 (+/− 4.0) for the PD group and 65 (+/− 4.2) for the control group. Movement disorders specialists at Washington University specifically selected patients with PD that had at least mild turning problems defined as turning en bloc, i.e. with less relative rotation of body segments in the transverse plane. All subjects with PD had Hoehn & Yahr scores (Hoehn and Yahr, 2001) of 2–3 and were tested on medication. Table 4 provides the subject characteristics for the PD group.
TABLE 4.
Subject Demographics
| Subject | Age | Gender | Time Since PD Diagnosis (years) | UPDRS Total Motor Subscore* | Freezing of Gait | Turn Hesitation |
|---|---|---|---|---|---|---|
| PD1 | 62 | M | 5 | 24.0 | Yes | No |
| PD2 | 74 | M | 3 | 18.5 | Yes | No |
| PD3 | 68 | M | 2 | 34.5 | No | Mild |
| PD4 | 44 | M | 8 | 19.0 | Yes | Mild |
| PD5 | 51 | M | 3 | 26.5 | No | Mild |
| PD6 | 61 | M | 6 | 30.0 | No | Mild |
| PD7 | 78 | F | 5 | 16.5 | No | Mild |
| PD8 | 68 | F | 9 | 16.0 | Yes | Mild |
UPDRS scores were obtained with subjects on medications.
4.2 Motion Analysis
Twelve reflective markers (20mm diameter) were placed on each participant; three on the head, three on the trunk and three on each foot (see Earhart and Hong, 2006 for details). Figure 4 illustrates the setup of the experiment. We used an eight camera 3-D motion capture system (Motion Analysis Corporation, Santa Rosa, CA) to record the position of each marker in space. Data were collected at 60 Hz.
Figure 4.
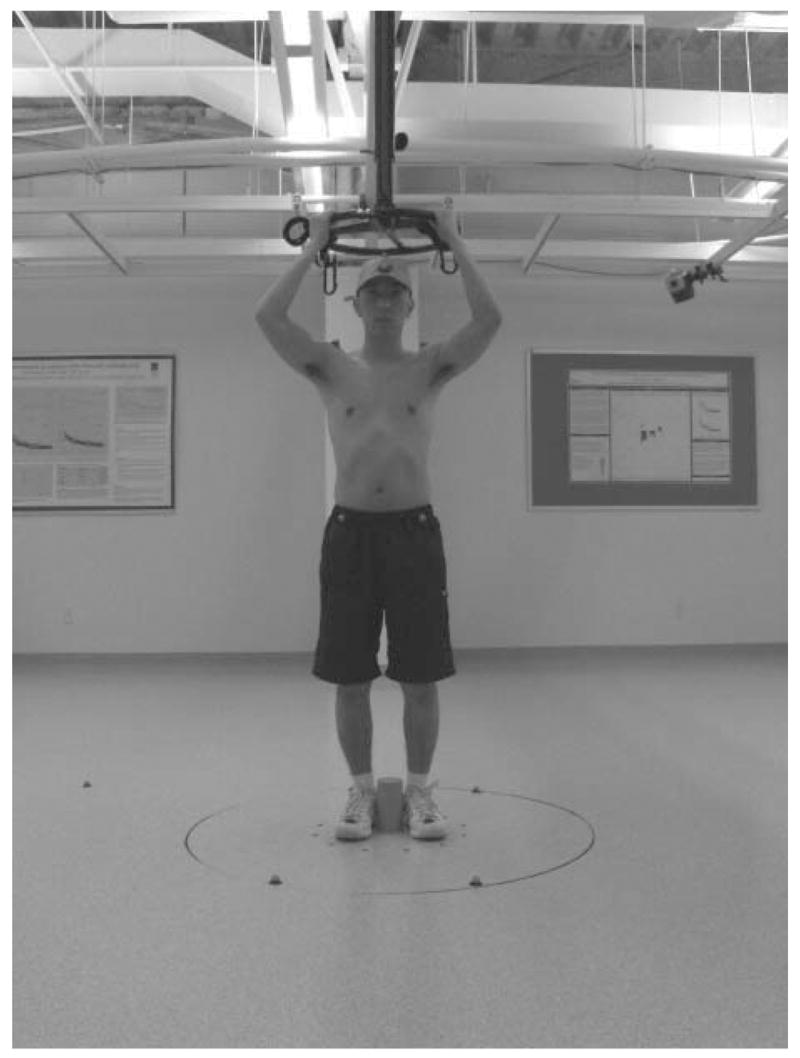
Example of experiment setup. Twelve reflective markers were placed on each participant; three on the head (center of forehead, occipital protuberance and top of head), three on the trunk (left acromion, right acromion and left scapula) and three on each foot (heel, 2nd metatarsal and lateral malleolus). The subjects stepped in the middle of the rotating platform counteracting the circular motion of the platform. They held a low-friction wheel overhead and subjects in study 2 wore a modified parachute harness for added safety.
4.3 Protocol
For study 1, young control subjects were asked to maintain a fixed orientation in space on the axis of a 122 cm diameter rotating platform (Neuro Kinetics, Inc. Pittsburgh, PA) moving at 45 deg/sec in the clockwise direction. Subjects had to counteract the circular motion of the platform by rotating their feet under the body. As the subjects were performing this task they held a low-friction wheel mounted directly over the platform on a height-adjustable post. The low friction wheel provides minimal sensory feedback to the subjects regarding their position in the transverse plane yet helps the subject maintain an upright posture. Therefore subjects were asked to hold the wheel during the 15 minutes of walking on the platform as well as during stepping in place for 30 minutes afterwards. Additionally, a 0.15m tall peg was screwed into the floor and the subjects stepped with their feet placed on either side of the peg. They were allowed to brush against the peg to prevent drifting from the starting position. Previous work has confirmed that responses are unchanged by the overhead wheel or the peg (unpublished data). Participants were tested in two different conditions on two separate days. The two conditions were: 1) walking on the rotating platform for 15 continuous minutes followed by a 5-minute rest, then stepping in place for 30 minutes with a blindfold and earplugs and 2) three repetitions of walking on the rotating platform for 5 minute-intervals and resting for 5 minutes, then stepping in place for 30 minutes with a blindfold and earplugs. During all rest periods the subjects remained seated. In both conditions, while stepping in place, subjects stepped to the beat of a metronome (2 Hz) that was affixed to the body. The metronome was used to control cadence as previous work demonstrated step rate directly affects PKAR velocity (Earhart and Horak, 2004). Although the earplugs eliminated extraneous noise that may help subjects orient themselves in space, they still allowed the metronome that was mounted close to the subject’s ear to be heard without giving feedback regarding orientation. The positions of each marker were recorded with the motion analysis system throughout the periods of PKAR. The order of the two conditions was randomized, and the two testing sessions were separated by at least 24 hours.
PD and matched control subjects for study 2 were tested in the interval protocol described above. As an additional safety precaution, subjects in study 2 wore a modified parachute harness (NeuroCom, Clackamas, OR) that was attached to a load-rated overhead beam. All subjects were able to complete three repetitions of walking on the rotating platform for 5 minutes with rests of 5 minutes between intervals, but only one PD subject was able to complete 30 minutes of stepping in place. However, everyone was able to complete 10 minutes of stepping in place.
4.4 Data Analysis
For study 1, we calculated each subject’s trunk angular velocity over 30 minutes of PKAR by taking the first derivative of trunk position relative to space as recorded with Motion Analysis. Then we plotted trunk angular velocity versus time for each person. Because the plots had an initial rising phase and then decayed over time they were fitted with both an exponential rise and an exponential decay function. All previous studies of PKAR (Weber et al., 1998, Earhart and Horak, 2004, Earhart et al., 2002a–d, Earhart et al., 2004) used an exponential decay function to fit data from minutes 2 to 30 and this method was used for study 1. However, because subjects in study 2 had only 10 minutes of PKAR data we also fitted data from study 1 with the exponential decay function using only 2 to 10 minutes of data, to permit comparisons between studies. For study 2 we fitted the decay function using 2 to 10 minutes of data. As such, plots for study 1 were fitted with three functions 1) a 2-parameter exponential rise to maximum function fitted to the first 2 minutes of the response to yield values for maximum velocity and rise time constant, 2) a 3-parameter exponential decay function fitted to the data from minutes 2 through 10 to yield values for initial velocity, asymptote and decay time constant and 3) a 3-parameter exponential decay function fitted to the data from minutes 2 through 30 to yield values for initial velocity, asymptote and decay time constant. Values calculated using each of these functions were compared across conditions with paired t-tests. Additionally, we used t-tests to compare values obtained from functions 2 and 3 within each testing condition to assess the validity of using data during 2 to 10 minutes of PKAR response in study 2, instead of 2 to 30 minutes as has been the standard for previous studies of PKAR. Group average data presented in Figures 2b, 3b, and 4b were obtained by first calculating the average of individual velocities at each time point and then plotting averages of these values. The values in Tables 1, 2 and 3 reflect averages of each curve fit parameter that were obtained by fitting individual subject plots with different curve functions. Curve functions were not applied to group average data shown in Figures 2b,3b and 4b.
For study 2 we used the methods described above, but only fit the data with functions 1 and 2. We did not have complete 30-minute data sets to fit the third function. We compared values obtained from the curve fits across groups using paired t-tests. We then conducted an additional analysis comparing the young subjects in study 1 with older control subjects in study 2. Values calculated using 2–10 minutes of PKAR response after participating in the interval protocol were compared using unpaired t-tests.
4.5 Power Analysis
Power analysis revealed an 80% chance to identify a significant (p < 0.05) difference between groups on the order of one standard deviation given a sample size of 6 subjects per group.
Acknowledgments
We thank Shannon Goebel for her assistance in data analysis. This work was supported by NIH grants 1 K01 HD048437-01 and NS41509, PODS I from the Foundation for Physical Therapy, the Greater St. Louis Chapter of the American Parkinson Disease Association (APDA), the APDA Center for Advanced PD Research at Washington University and the Barnes-Jewish Hospital Foundation (the Elliot H. Stein Family Fund and the Jack Buck Fund for PD Research).
Footnotes
Publisher's Disclaimer: This is a PDF file of an unedited manuscript that has been accepted for publication. As a service to our customers we are providing this early version of the manuscript. The manuscript will undergo copyediting, typesetting, and review of the resulting proof before it is published in its final citable form. Please note that during the production process errors may be discovered which could affect the content, and all legal disclaimers that apply to the journal pertain.
References
- Bagley S, Kelly B, Tunnicliffe N, Turnbull GI, Walker JM. The effect of visual cues on the gait of independently mobile Parkinson’s disease patients. Physiotherapy. 1991;77:415–420. [Google Scholar]
- Bloem B, Van Vugt J, Beckley D. Postural instability and falls in Parkinson’s Disease. Advances in Neurology. 2001;87:209–223. [PubMed] [Google Scholar]
- Bloem BR, Hausdorff JM, Visser JE, Giladi N. Falls and freezing of gait in Parkinson’s disease: a review of two interconnected, episodic phenomena. Mov Disord. 2004;19(8):871–84. doi: 10.1002/mds.20115. [DOI] [PubMed] [Google Scholar]
- Charlett A, Weller C, Purkiss A, Dobbs S, Dobbs R. Breadth of base whilst walking: effect of ageing and parkinsonism. Age and Ageing. 1998;27:49–54. doi: 10.1093/ageing/27.1.49. [DOI] [PubMed] [Google Scholar]
- Contreras-Vidal JL, Teulings HL, Stelmach GE, Adler CH. Adaptation to changes in vertical display gain during handwriting in Parkinson’s disease patients, elderly and young controls. Parkinsonism Relat Disord. 2002;9(2):77–84. doi: 10.1016/s1353-8020(02)00013-5. [DOI] [PubMed] [Google Scholar]
- Cumming RG, Klineberg RJ. Fall frequency and characteristics and the risk of hip fractures. J Am Ger Soc. 1994;42:774–778. doi: 10.1111/j.1532-5415.1994.tb06540.x. [DOI] [PubMed] [Google Scholar]
- Dietz V, Sijlstra W, Prokop T, Berger W. Leg muscle activation during gait in Parkinson’s disease: adaptation and interlimb coordination. Electroencephalogr Clin Neurophysiol. 1995;97(6):408–15. doi: 10.1016/0924-980x(95)00109-x. [DOI] [PubMed] [Google Scholar]
- Earhart GM, Melvill Jones G, Horak FB, Block EW, Weber KD, Fletcher WA. Forward Versus Backward Walking: Transfer of Podokinetic Adaptation. J Neurophysiol. 2001;86(4):1666–70. doi: 10.1152/jn.2001.86.4.1666. [DOI] [PubMed] [Google Scholar]
- Earhart GM, Horak FB, Melvill Jones G, Block EW, Weber KD, Suchowersky O, Fletcher WA. Is the cerebellum important for podokinetic adaptation? Ann N Y Acad Sci. 2002a;978:511–2. doi: 10.1111/j.1749-6632.2002.tb07596.x. [DOI] [PubMed] [Google Scholar]
- Earhart GM, Fletcher WA, Horak FB, Block EW, Weber KD, Suchowersky O, Melvill Jones G. Does the cerebellum play a role in podokinetic adaptation? Exp Brain Res. 2002b;146(4):538–42. doi: 10.1007/s00221-002-1238-y. [DOI] [PubMed] [Google Scholar]
- Earhart GM, Melvill Jones G, Horak FB, Block EW, Weber KD, Fletcher WA. Transfer of podokinetic adaptation from stepping to hopping. J Neurophysiol. 2002c;87(2):1142–4. doi: 10.1152/jn.00588.2001. [DOI] [PubMed] [Google Scholar]
- Earhart GM, Melvill Jones G, Horak FB, Block EW, Weber KD, Fletcher WA. Podokinetic after-rotation following unilateral and bilateral podokinetic stimulation. J Neurophysiol. 2002d;87(2):1138–41. doi: 10.1152/jn.00464.2001. [DOI] [PubMed] [Google Scholar]
- Earhart GM, Horak FB. Effects of cadence on the acquisition and expression of podokinetic after-rotation. Hum Mov Sci. 2004;23(6):823–36. doi: 10.1016/j.humov.2004.09.001. [DOI] [PubMed] [Google Scholar]
- Earhart GM, Sibley KM, Horak FB. Effects of bilateral vestibular loss on podokinetic after-rotation. Exp Brain Res. 2004;155(2):251–6. doi: 10.1007/s00221-003-1816-7. [DOI] [PubMed] [Google Scholar]
- Earhart GM, Hong M. Kinematics of Podokinetic After-Rotation: Similarities to Voluntary Turning and Potential Clinical Implications. Brain Res Bull. 2006;70:15–21. doi: 10.1016/j.brainresbull.2005.11.004. [DOI] [PubMed] [Google Scholar]
- Fernandez-Ruiz J, Diaz R, Hall-Haro C, Vergara P, Mischner J, Nunez L, Drucker-Colin R, Ochoa A, Alonso ME. Normal prism adaptation but reduced after-effect in basal ganglia disorders using a throwing task. Eur J Neurosci. 2003;18(3):689–94. doi: 10.1046/j.1460-9568.2003.02785.x. [DOI] [PubMed] [Google Scholar]
- Frenkel-Toledo S, Giladi N, Peretz C, Herman T, Gruendlinger L, Hausdorff JM. Treadmill walking as an external pacemaker to improve gait rhythm and stability in Parkinson’s disease. Mov Disord. 2005;20(9):1109–14. doi: 10.1002/mds.20507. [DOI] [PubMed] [Google Scholar]
- Giladi N, McMahon D, Przedborski S. Motor blocks in Parkinson’s Disease. Neurology. 1992;42:333–339. doi: 10.1212/wnl.42.2.333. [DOI] [PubMed] [Google Scholar]
- Gordon CR, Fletcher WA, Melvill Jones G, Block EW. Adaptive plasticity in the control of locomotor trajectory. Exp Brain Res. 1995;102:540–545. doi: 10.1007/BF00230658. [DOI] [PubMed] [Google Scholar]
- Gordon CR, Tal D, Gadoth N, Shupak A. Prolonged optokinetic stimulation generates podokinetic after rotation. Ann N Y Acad Sci. 2003;1004:297–302. doi: 10.1196/annals.1303.027. [DOI] [PubMed] [Google Scholar]
- Hathout GM, Bhidayasiri R. Midbrain ataxia: an introduction to the mesencephalic locomotor region and the pedunculopontine nucleus. AJR Am J Roentgenol. 2005;184(3):953–6. doi: 10.2214/ajr.184.3.01840953. [DOI] [PubMed] [Google Scholar]
- Hoehn MM, Yahr MD. Parkinsonism: onset, progression, and mortality. 1967. Neurology. 2001;57(Suppl 3):S11–26. [PubMed] [Google Scholar]
- Horstink MW, Berger HJ, van Spaendonck KP, van den Bercken JH, Cools AR. Bimanual simultaneous motor performance and impaired ability to shift attention in Parkinson’s disease. J Neurol Neurosurg Psychiatry. 1990;53(8):685–90. doi: 10.1136/jnnp.53.8.685. [DOI] [PMC free article] [PubMed] [Google Scholar]
- Jurgens R, Boss T, Becker W. Podokinetic after-rotation does not depend on sensory conflict. Exp Brain Res. 1999;128(4):563–7. doi: 10.1007/s002210050882. [DOI] [PubMed] [Google Scholar]
- Lamberti P, Armenise S, Castaldo V, de Mari M, Iliceto G, Tronci P, Serlenga L. Freezing gait in Parkinson’s disease. Eur Neurol. 1997;38:297–301. doi: 10.1159/000113398. [DOI] [PubMed] [Google Scholar]
- Majsak MJ, Kaminski T, Gentile AM, Flanagan JR. The reaching movements of patients with Parkinson’s disease under self-determined maximal speed and visually cued conditions. Brain. 1998;121(Pt 4):755–66. doi: 10.1093/brain/121.4.755. [DOI] [PubMed] [Google Scholar]
- Marchese R, Diverio M, Zucchi F, Lentino C, Abbruzzese G. The role of sensory cues in the rehabilitation of parkinsonian patients: a comparison of two physical therapy protocols. Mov Disord. 2000;15(5):879–83. doi: 10.1002/1531-8257(200009)15:5<879::aid-mds1018>3.0.co;2-9. [DOI] [PubMed] [Google Scholar]
- Matsuyama K, Drew T. Vestibulospinal and reticulospinal neuronal activity during locomotion in the intact cat. II. Walking on an inclined plane. J Neurophysiol. 2000;84(5):2257–76. doi: 10.1152/jn.2000.84.5.2257. [DOI] [PubMed] [Google Scholar]
- Miyai I, Fujimoto Y, Ueda Y, Yamamoto H, Nozaki S, Saito T, Kang J. Treadmill training with body weight support: its effect on Parkinson’s disease. Arch Phys Med Rehabil. 2000;81:849–52. doi: 10.1053/apmr.2000.4439. [DOI] [PubMed] [Google Scholar]
- Miyai I, Fujimoto Yamamoto H, Ueda Y, Saito T, Nozaki S, Kang J. Long-term effect of body weight-supported treadmill training in Parkinson’s disease: a randomized controlled trial. Arch Phys Med Rehabil. 2002;83:1370–3. doi: 10.1053/apmr.2002.34603. [DOI] [PubMed] [Google Scholar]
- Morris ME, Iansek R, Matyas TA, Summers JJ. Ability to modulate walking cadence remains intact in Parkinson’s disease. J Neurol Neurosurg Psychiatry. 1994;57(12):1532–4. doi: 10.1136/jnnp.57.12.1532. [DOI] [PMC free article] [PubMed] [Google Scholar]
- Nieuwboer A, De Weerdt W, Dom R, Lesaffre E. A frequency and correlation analysis of motor deficits in Parkinson patients. Disability and Rehabilitation. 1998;20:142–150. doi: 10.3109/09638289809166074. [DOI] [PubMed] [Google Scholar]
- Pahapill PA, Lozano AM. The pedunculopontine nucleus and Parkinson’s disease. Brain. 2000;123(Pt9):1767–83. doi: 10.1093/brain/123.9.1767. [DOI] [PubMed] [Google Scholar]
- Pohl M, Rockstroh G, Ruckriem S, Mrass G, Mehrholz J. Immediate effects of speed-dependent treadmill training on gait parameters in early Parkinson’s disease. Arch Phys Med Rehabil. 2003;84:1760–6. doi: 10.1016/s0003-9993(03)00433-7. [DOI] [PubMed] [Google Scholar]
- Protas EJ, Mitchell K, Williams A, Qureshy H, Caroline K, Lai EC. Gait and step training to reduce falls in Parkinson’s disease. NeuroRehabilitation. 2005;20(3):183–90. [PubMed] [Google Scholar]
- Racette BA, Rundle M, Parsian A, Perlmutter JS. Evaluation of a screening questionnaire for genetic studies of Parkinson’s disease. Am J Med Genet. 1999;88(5):539–43. [PubMed] [Google Scholar]
- Schaafsma JD, Balash U, Gurevich T, Bartels AL, Hausdorff JM, Giladi N. Characterization of freezing of gait subtypes and the response of each to levodopa in Parkinson’s disease. Eur J Neurol. 2003;10:391–398. doi: 10.1046/j.1468-1331.2003.00611.x. [DOI] [PubMed] [Google Scholar]
- Siegert RJ, Harper DN, Cameron FB, Abernethy D. Self-initiated versus externally cued reaction times in Parkinson’s disease. J Clin Exp Neuropsychol. 2002;24(2):146–53. doi: 10.1076/jcen.24.2.146.991. [DOI] [PubMed] [Google Scholar]
- Stack E, Ashburn A. Fall-events described by people with Parkinson’s Disease: implication for clinical interviewing and the research agenda. Physiotherapy Research International. 1999;4:190–200. doi: 10.1002/pri.165. [DOI] [PubMed] [Google Scholar]
- Stern Y, Mayeuz R, Hermann A, Rosen J. Prism adaptation in Parkinson’s disease. J Neurol Neurosurg Psychiatry. 1998;51(12):1584–7. doi: 10.1136/jnnp.51.12.1584. [DOI] [PMC free article] [PubMed] [Google Scholar]
- Strickland D, Bertoni JM. Parkinson’s prevalence estimated by a state registry. Mov Disord. 2004;19(3):318–23. doi: 10.1002/mds.10619. [DOI] [PubMed] [Google Scholar]
- Weber KD, Fletcher WA, Gordon CR, Melvill Jones G, Block EW. Motor learning in the “podokinetic” system and its role in spatial orientation during locomotion. Exp Brain Res. 1998;120(3):377–85. doi: 10.1007/s002210050411. [DOI] [PubMed] [Google Scholar]
- Zijlstra W, Rutgers AWF, Van Weerden TW. Voluntary and involuntary adaptation of gait in Parkinson’s disease. Gait Posture. 1998;7(1):53–63. doi: 10.1016/s0966-6362(97)00037-4. [DOI] [PubMed] [Google Scholar]