

Abstract
The objective of this study was to profile gene expression in cells of the chicken immune system. A low-density immune-specific microarray was constructed that contained genes with known functions in the chicken immune system, in addition to chicken-expressed sequence tags (ESTs) homologous with mammalian immune system genes, which were systematically characterized by bioinformatic analyses. Genes and ESTs that met the annotation criteria were amplified and placed on a microarray. The microarray contained 84 immune system gene elements. As a means of calibration, the microarray was then used to examine gene expression in chicken B cells after lipopolysaccharide stimulation. Differential gene expression was observed at 6, 12, and 24 h but not at 48 h after stimulation. The results were validated by semiquantitative polymerase chain reaction. The microarray showed a high degree of reproducibility, as demonstrated by intra- and interassay correlation coefficients of 0.97 and 0.95, respectively. Thus, the low-density microarray developed in this study may be used as a tool for monitoring gene expression in the chicken immune system.
Résumé
La présente étude avait comme objectif d’étudier l’expression génique dans les cellules du système immunitaire du poulet. Une biopuce de faible densité, spécifique du système immunitaire, a été construite et contenait des gènes avec des fonctions connues dans le système immunitaire du poulet, de même que des séquences étiquettes exprimées chez le poulet (ESTs) mais homologues à des gènes du système immunitaire des mammifères, caractérisés systématiquement par analyses bio-informatiques. Les gènes et ESTs qui rencontraient les critères d’annotation ont été amplifiés et placés sur une biopuce. La biopuce contenait 84 éléments génétiques du système immunitaire. Comme méthode de calibration, la biopuce a été utilisée pour examiner l’expression génique des cellules B de poulet après stimulation par le lipopolysaccharide. Une expression génique différentielle a été observée 6, 12, et 24 h après la stimulation mais pas après 48 h. Les résultats ont été validés par réaction d’amplification en chaîne par la polymérase semi-quantitative. La biopuce avait une excellente reproductibilité tel que démontré par les coefficients de corrélation intra- et inter-essai qui étaient respectivement de 0,97 et 0,95. Donc, la biopuce de faible densité développée au cours de cette étude peut être utilisée comme outil pour surveiller l’expression génique du système immunitaire du poulet.
(Traduit par Docteur Serge Messier)
Introduction
Functional genomic techniques such as gene sequencing, sequence annotation, and gene expression profiling have led to the discovery of genes and genetic networks that regulate physiological pathways in various organisms. The establishment of expressed sequence tag (EST) databases and genome sequencing have expedited gene discovery in recent years. In the chicken, the latest estimate of available ESTs in public databases is well over 500 000. These ESTs are from a wide range of tissues and cell types, including embryonic and adult brain, ovary, chondrocytes, small intestine, pancreas, liver, kidney, adrenal gland, heart, adipose tissue, the DT40 cell line, and T cell-enriched activated splenocytes (1). Recently, several tissue-specific chicken microarrays have been constructed with these ESTs, including those derived from chicken lymphoid tissues, and have been used to examine gene expression profiles (2–5). For example, gene expression in chicken fibroblasts after infection with herpesvirus of turkey has been investigated (5). Gene expression in peripheral blood lymphocytes from birds with or without Marek’s disease was assessed among inbred lines of birds that display susceptibility or resistance to Marek’s disease (6). In addition, genetic networks involved in B cell development were identified by profiling gene expression in chicken B cells with the use of a bursal EST-based microarray (4).
In many cases, microarrays developed for the chicken have been constructed with the use of EST libraries. However, a large number of the chicken ESTs available in various databases are not annotated or may have been erroneously annotated. Annotating chicken immune system genes is especially important because of the significant divergence of many of these genes from their mammalian orthologs (7). Moreover, the chicken genome is smaller and less diverse than mammalian genomes (8); thus, it is likely that not every mammalian orthologous gene will be identified in the chicken genome. In addition, paralogous genes belonging to the same molecular family may be erroneously annotated in the sequence of common molecular motifs and domains in databases, impairing searches conducted with BLAST, GenBank’s automated alignment-search program (www.ncbi.nlm.nih.gov/BLAST). These problems have resulted in the lack of annotation for several gene elements present in current chicken microarrays. Furthermore, these microarrays have a degree of redundancy, because each gene may be represented by more than 1 EST in the array.
To address such issues, we sought in the present study to annotate a subset of ESTs related to the chicken immune system that are stored in several DNA databases, with the goal of developing a low-density immune system microarray to profile gene expression in chicken lymphoid tissues. Low-density microarrays for studying immune system genes have previously been constructed and successfully used to profile gene expression in the immune system compartment (9,10). These low-density arrays are less costly than global microarrays, are focused on pathways of interest, and may be used to complement global profiling.
To achieve the objectives of this study, we selected several genes whose products are associated with immune and inflammatory responses, as well as housekeeping functions, for an annotation process involving BLASTn and tBLASTn. Subsequently, we assembled a low-density microarray with gene elements representing these families and used it to monitor temporal gene expression in chicken B cells stimulated with bacterial lipopolysaccharide (LPS).
Materials and methods
Bioinformatics approach
We compiled an extensive list of genes whose products are associated with immune and inflammatory responses, as well as housekeeping functions, and classified them functionally as follows: chemokines and chemokine receptors, cytokines and cytokine receptors, innate immunity molecules, adhesion molecules, cluster of differentiation molecules, immunoglobulins and T cell receptors, antigen presentation and processing molecules, apoptosis molecules, transcription and signal transduction molecules, and housekeeping and other molecules. The list was subjected to a bioinformatics approach: first, BLASTn was applied to screen GenBank for previously characterized chicken gene sequences; second, we annotated chicken EST sequences with possible functions in the immune system by using tBLASTn to compare chicken ESTs from various databases (Delaware [www.chickest.udel.edu/]; DT40 [pheasant.gsf.de/DEPARTMENT/dt40.html]; UMIST [www.chick.umist.ac.uk/]; and TIGR [www.tigr.org/tigr-scripts/tgi/]) with known human or mouse protein sequences. The EST selection criteria were based on score values and expectation (E) values. If the score values were higher than 250, the ESTs were considered to have high homology; if the score values were 100 to 250, the ESTs were considered to have medium homology (11). Sequences that did not meet the criteria (having a score value less than 100 and an E-value approaching zero) were discarded (11).
Primer design
Primers (Table I) were designed for amplification, by means of polymerase chain reaction (PCR), of the sequences identified through the bioinformatics approach. We used Vector NTI Software (Informax, Fredrick, Maryland, USA) and Primer 3 software (12) (www.genome.wi.mit.edu/cgi-bin/primer3/primer3_www.cgi) for primer design under the following parameters: amplicon length, 200 to 800 base pairs (bp); primer length, 20 to 24 nucleotides; primer melting temperature, 58°C to 65°C; guanine and cytosine content of the primer and amplicon, 40% to 60%; and difference in melting temperature between forward and reverse primers, 1°C to 2°C. All primers were designed under the same parameters to facilitate batch amplification and BLAST searches against chicken DNA sequences available in GenBank to ensure amplification specificity. Primers that met all the criteria were subsequently synthesized (Sigma-Genosys, Oakville, Ontario).
Table I.
Genes incorporated into the low-density chicken microarray
| Gene ID | Gene/EST classification | GenBank accession number | Forwardprimer | Reverseprimer | Amplicon length (bp) |
|---|---|---|---|---|---|
| Chemokines and chemokine receptors | |||||
| CXCR1 | Chicken CXCR1 | AF227961 | ATGTGTGGGGATGGTGTCCAGG | TGAGGGCAAAGAGCAGGTCGTC | 427 |
| CXCR4 | Chicken CXCR4 | AF294794 | GACGGTTTGGATCTGTCCTCTGGC | CTTCTCAGCCAACAGCTTTCGGG | 477 |
| CRL1 | Chicken chemokine receptor CRL1 | AF029369 | GGGTTTGGGGGTGATTGGGTTC | TACACGATGGCCAAGTAGCGGTCC | 494 |
| SDF-1 | Chicken stromal cell derived factor-1 | AY451855 | GATAGATCTCACCGTCGCCAGAATG | GTCGATATCTTTGTCTCTTGCCTTACTTG | 296 |
| C-orph-R-1 | Putative chemokine orphan receptor-1 | AJ444418 | CTGGATGTGCAACAACAGCGACTG | AACCGACAGAGATGAGCTCCATGC | 596 |
| Cytokines and cytokine receptors | |||||
| gp130 | Chicken gp130 | AJ011688 | ATGTTTTCTGGGTGGAGCTGGGC | AGTCAGGAAAGGTTTCCCGTGGC | 535 |
| TRAF6 | Putative IL-1 signal transducer (TRAF6) | BU362046 | TGGAGACGCAAAACACTCACATGG | GGATTGCGGTGAATTGTTGGTCTC | 445 |
| IL-1β | Chicken IL-1β | Y15006 | CAGCGAAGAGACCTTCTACGG | TAGAGCTTGTAGCCCTTGATGC | 501 |
| IL-2 | Chicken IL-2 | AJ224516 | TCTTTGGCTGTATTTCGGTAGC | CACAAAGTTGGTCAGTTCATGG | 266 |
| IL-2aR | Chicken IL-2α- receptor (CD25) | AF143806 | CCTTTTGATGTGGCTCTTGCTTGG | CATCCACATTCTTGCACGTGATGG | 491 |
| IL-15 | Chicken IL-15 | AF139097 | AGACTGGACTAACCATCTTCTTCC | GCTGTTGTGGAATTCAACTGG | 296 |
| IFN-g | Chicken IFN-g | Y07922 | ACACTGACAAGTCAAAGCCGCAC | TTTTGAAACTCGGAGGATCCACC | 204 |
| IFNAR1 | Chicken IFNαβ receptor-1 | AF082664 | CTAGCGGCTGTGCTGCTTTGTGT | GGCTCCATTTATGGACTGCAACG | 414 |
| IFNAR2 | Chicken IFNαβ receptor-2 | AF082665 | TGGAAACACTGATGGGTGGACC | TGAGTGGGTGGCAGCTTTATGG | 460 |
| c-maf | Chicken c-maf | D28598 | GAAGAGGTGATCCGGCTGAAGC | GGTTGTCGCTGCTGGATCCG | 247 |
| GATA3 | Chicken GATA3 | X56931 | CCTCAGCCCTTTTTCCAAGACCTC | GCTTTCGGTCGTGATTTGCACC | 426 |
| Osteoa | Putative osteoprotegerin | pgm2n.pk007.b12 | TTGTGATGTGCAACCAGTGCCC | CAGCCAGTTGGGTGTGAAACGAG | 551 |
| Gam-R | Chicken common γ-chain receptor | AJ419896 | TTCGCTCGTGCCCATCCTTCTC | ACCTCCTGATTCGTCCAGCTGGTG | 495 |
| TGFβR1 | Chicken TGFβ receptor 1 | pgl1n.pk002.b4 | GATTTAGGTGACACTATAG | TAATACGACTCACTATAGGG | 1–1.5 kb |
| Innate immunity molecules | |||||
| NRAMP-1a | Chicken NRAMP1 | pgm2n.pk014.h13 | GATTTAGGTGACACTATAG | TAATACGACTCACTATAGGG | 1–1.5 kb |
| TLR4 | Chicken TLR4 | AY064697 | GAGGTCATCCCCAGCACAGCTTTC | GGAGGAAAAGCTCAGGTGCCTGAG | 462 |
| Ficol-2 | Putative Ficolin 2 | BU387979 | TGCTCAGTGCATCAGCCACCAC | CAACGCGGAGTTCACAGGTTCC | 408 |
| Adhesion molecules | |||||
| ICAM-1 | Putative ICAM-1 | BX277938 | CGCTATGGCGGCCAATGAAG | TGACGTCCACCCAGTTCCATCC | 524 |
| LFA-1 | Putative LFA-1α | BQ038261 | TGGGGCTTCAGTTTGTGCTGTGG | TTCTCAGCACCACAGCAGAATCGG | 470 |
| VCAM | Putative VCAM (CD106) | BU202635 | AAGGTTCAGCCAGAGGATGC | TTGCTGTTACACAGGAGAGTGC | 421 |
| E-sel | Putative E-selectin | BG625680 | CTGGATTCTATGGGCCGGGTTG | AGGAACGGGAGCAGTTCAGAGAGC | 457 |
| Cluster of differentiation molecules | |||||
| CD3 | Chicken CD3 | M59925 | TGCGTGGCTGTGGCCAAGTT | AGTTGCCAGCTGGCTGTACTGTCC | 468 |
| CD4 | Chicken CD4 | Y12012 | ATGCCAGCTGGAGATCAACGGTAG | TGCTTGTGCCATCCTTCTTGCC | 451 |
| CD5a | Chicken CD5 | pgn1c.pk007.o18 | CATCTGCCTTCCTCATCTGC | CTTGGAGATCCTCTTCATCAGC | 449 |
| Scav-R | CD6-like member of scavenger receptor family | BU126478 | GGGACAGAAATACCTGAGCCAGGC | CCCCCAGACATTGTTGTGAAGCA | 425 |
| CD8a | Chicken CD8a | Z22726 | CAGGGACAGAGGAACACGATGGAG | TCCTTGTTGACGTGGCTGCTCTG | 419 |
| CD8b | Chicken CD8b | Z26484 | AACAGCACAGAGATTGTCTGCCCG | AGTCGATAGAAGCGGCGGATGG | 482 |
| CD11b | Putative CD11b (Mac-1α) | BU425066 | CGGGTTATCAGACCTGCTGGTTGG | GCATGCGGTGACATTGAGGCAG | 544 |
| CD18 | Chicken CD18 | X71786 | TCTGGCTGCCAGCAATGACCTG | CCAAAACCTATGCGGCGAGAGG | 496 |
| CD28 | Chicken CD28 | X67915 | ATCCTCGTGGTGCTCTGCCTCATC | ACCAAGAAGTCCCGTCACTGCCAC | 474 |
| CD40-h | Chicken CD40 homologue | AJ293700 | GCCTGGTGATGCTGTGAATTGCTC | AGCCCCTTTTCCTCACAGCTTGTC | 462 |
| CD44 | Chicken CD44 | AF153205 | GGCAACAGCTGCTGATTTCCCCA | TCGTCACATGCTCCTGTTCGGTC | 414 |
| CD45 | Chicken CD45 | L13285 | CACATTCAGTTCACCAGCTGGCC | TTCGCCTCCAGCAGAGAAGGTTC | 404 |
| CD62L | Putative CD62L | BG625680 | CTGGATTCTATGGGCCGGGTTG | AGGAACGGGAGCAGTTCAGAGAGC | 457 |
| CD63 | Putative CD63 | BU450169 | GAGGGCGGAATGAAGTGCGTGAAG | TTGGCACCACAGCAGTGGAAGTCC | 437 |
| CD82 | Putative CD82 | AJ446108 | CAGCGGGAAGGAGGATCCTGTAAG | GCACATAGTCCCACGCATCTTGC | 469 |
| CD80-h | Chicken CD80 homologue | Y08823 | GAAGCGGCTCGGTTACGGATTTC | TGGCCCACTGAGTATTGGTTGGC | 448 |
| CD107 | Chicken CD107 (LAMP-2) | U10547 | TCCACTGTGACACACAACGGAAGC | TGGTTGGAGCAGGTGAAATGGTG | 454 |
| CD119 | Putative CD119 (IFN-g receptor α) | BU465611 | CGCAGTGCCTTCACCAACAGGA | TCTCTCTCATCCAAGGCCGAACC | 404 |
| CDw137 | Putative CDw137 | BU141439 | GGAGTGCTGTGGATGCGAAGTGTG | TCTGGAGGTTCTTCCCTGGCACAG | 502 |
| CD164 | Chicken CD164 | AJ292037 | CCTTTGCTTCGCTTCAGCGCTC | AGCCTGCAGACCCAGAACAAGGAC | 556 |
| Immunoglobulins and T cell receptors | |||||
| IgMa | Chicken IgM heavy chain | pgn1c.pk016.m15 | GATTTAGGTGACACTATAG | TAATACGACTCACTATAGGG | 1–1.5 kb |
| Antigen presentation and processing molecules | |||||
| Invariant | Chicken invariant chain | AJ292038 | TGCAACCATGGCTGAGGAGCAG | GGTCTGATTTCAGCAGCAGGTGCC | 422 |
| TAP2a | Putative TAP-2 | pat.pk0066.b6.f | GGTCTTTGATTACCTGGACTGG | TCCCGTAGGCAATGTTATCC | 211 |
| Rfp-Y | Chicken Rfp-y (class 1 α-chain) | AF218784 | AAAGTGGAGGGTCTCACACG | AGCCGAAGTGTGGTAAGTGC | 406 |
| Calnexin | Putative calnexin | BU128302 | ATGTCTCCTCCTGTGAATCCACCG | TGGGTTTGGGATCTTCCTGGG | 421 |
| Calreticulin | Putative calreticulin | AJ454899 | TCTTCCGGGAGGAGTTCTTGGATG | GCGGATGTCCTTGTTGATGAGCAC | 422 |
| Apoptosis molecules | |||||
| Bcl-2-ov-R | Chicken Bcl-2-related ovarian killer protein | AF275944 | GCTCGTCCGTCTTTGCTGCA | GGCGATGTTGCGGTAGACGTT | 254 |
| Bcl-x | Chicken Bcl-x | U26645 | AGCGAGCTGGAGGAAGAGGATGAG | GACACAATGCGTCCCACCAGTACC | 419 |
| Caspase 1 | Chicken caspase 1 | AF031351 | ATGAGCAGGGCAAGATCTTCGGG | CGCCCTGCAGTGCTTGTTGTTG | 450 |
| Caspase 3 | Chicken caspase 3 | AF083029 | ATAAAAGATGGACCACGCTCAGGG | AAGTTTCCTGGCGTGTTCCTTCAG | 699 |
| Caspase 6 | Chicken caspase 6 | AF469049 | AAGGCTGCCAGATAGACGTGGGAC | TGAACTCCAAGGAAGAGCCGTGC | 557 |
| Caspase 8 | Chicken caspase 8 | AY057939 | ATGGAGTTCTCGCAGCTGCTCTTC | CGTCCGGCATTGTAGTTTCAGGAC | 424 |
| Caspase 9 | Chicken caspase 9 | AY057940 | AAGGAGCAAGCACGACAGCTGG | AGCCAGCTCGAGTCGACAGATCAG | 409 |
| Fas | Chicken Fas | AF296874 | AGTTTCAGTGGTCAGTGCTGCACG | TCTGCTGCAGCTGTGTTACCTTGG | 476 |
| Assoc-apop | Chicken association with apoptosis | U93865 | GCCCTGACAGCTGTGAACACTGTG | ATGACCTCACATCTCCCACCCTCC | 219 |
| BAK | Putative BAK | BU422799 | TCCGGAGCTACACCTTCTACC | AACATTGTCCAGATCGAGTGC | 402 |
| Granz | Putative granzyme- like molecule | BU409623 | TGGGTGTTAACAGCTGCTCATTGC | CACCTGAATCCCCTCGACATGAGT | 454 |
| FLIP | Putative FLIP | AJ392248 | CCTTACTAGGAATCCCAGACTCG | CCAGATTCTTGAATGGACACG | 253 |
| Transcription and signal transduction molecules | |||||
| erbB2 | Chicken erbB2 | AF306720 | AACAGCTTTAACCCAGAGGCCCAG | CACCAGGAAATATGCTACCGGTGC | 433 |
| c-myc | Chicken c-myc | J00889 | CCAGCAGCGACTCGGAAGAAGAAC | TGACAACCTTGGGCGCCTTCTC | 441 |
| c-fringe-1 | Chicken c-fringe-1 | U97157 | ATCGCCGTCAAAACCACCAAGAAG | CGTGGCAAACCAGAAATGCACAG | 414 |
| Bu-1 | Chicken Bu-1 | X92865 | TTGAGCCGATCATTGATGCCCG | AGCCTCCACATGGTCTCCATTGG | 476 |
| c-kit | Chicken c-kit | D13225 | AATGCTCGTCTCCCTGTGAAGTGG | CAAACATCTTCGCGTACCAGGAGG | 446 |
| BASH | Chicken BASH | AB015289 | ATGCAGACAATCGCACCAGTCACC | TGTGCATGTGCGAGTGCTCTGC | 441 |
| Grb2 | Chicken Grb2 | L19258 | GGAAAGATTCCCCGAGCAAAGGC | AAACATGCCCGTCTGTCCGTGG | 429 |
| Cbl | Chicken cbl | AF318895 | ATGTCGGCTCCGCTGAAGAAGG | CCAGCATGTGGCTGAATATCAGGG | 439 |
| ETS2 | Chicken ETS2 | X07202 | TGTACAGAGGAATGCTCAAGCGGC | GCAAGTTCCAGGAAGCGTTCCTTG | 409 |
| JAK2/3 | Putative JAK2/JAK3 homologue | BU428135 | TCCTGCTCTGCCAGTGTCTCACAG | TCGCCCACTGGTATTGCAATGG | 580 |
| STAT5 | Chicken STAT5 | AF074248 | AGGAGATGCTGTCGGAGCTGAATG | TCACCTGGAAGACCAACTCGTTGC | 450 |
| NF-kB50a | Chicken NF-kB p50 | pgn1c.pk003.j13 | GATTTAGGTGACACTATAG | TAATACGACTCACTATAGGG | 1–1.5 kb |
| Housekeeping and other molecules | |||||
| Grow-ha | Chicken growth hormone | pgp1n.pk001.l5 | GGCTCGTGGTTTTCTCCTCTCCTC | TTGTCGTAGGTGGGTCTGAGGAGC | 497 |
| HSP70 | Chicken HSP 70 | J02579 | CATCGATCTGGGCACCACGTATTC | AGTCGTTGAAGTAAGCGGGCACTG | 434 |
| SCA-2 | Chicken stem cell antigen-2 | L34554 | CATCTGCTTTTCGTGCTCGGATG | TGATGTTGCAGAGGAAGGAGTCGC | 230 |
| VAV3 | Chicken VAV3 | AY046915 | ATGGAACCGTGGAAGCAGTGCG | ACACTTTCTTCTGTGGGGAAGGGC | 404 |
| β2m | Chicken β2-microglobulin | Z48921 | ACCAAGAACGTCCTCAACTGC | CGGGATCCCACTTGTAGACC | 238 |
| β-actin | Chicken β-actin | L08165 | GCTGCGCTCGTTGTTGACAATG | AGAGGCATACAGGGACAGCACAGC | 419 |
| GAPDH | Chicken GAPDH | K01458 | AAAGTCGGAGTCAACGGATTTGGC | TTCTGTGTGGCTGTGATGGCATG | 545 |
EST — expressed sequence tag; bp — base pairs.
Clones purchased from the Delaware Biotechnology Institute, University of Delaware, Newark, Delaware, USA.
Reverse transcription (RT) and amplification of PCR fragments
Total RNA was extracted with the use of TRIzol reagent (Life Technologies, Gaithersburg, Maryland, USA) from the spleen, bursa of Fabricius, and thymus of mature White Leghorn hens euthanized by cervical dislocation at the Arkell Poultry Research Station, University of Guelph, Guelph, Ontario, according to the university’s Animal Care Committee guidelines. After treatment with 2 units (1 μL) of DNase I and 1 μL of 10X DNase I buffer, 10 μg of total RNA was incubated at 37°C for 30 min and then DNase inactivated with 5 μL of DNase Inactivation Reagent (DNA-free; Ambion, Austin, Texas, USA) to remove contaminating DNA. The RNA quality was verified on a 1% 3-morpholinopropanesulfonic acid, 3-(N-morpholino)propanesulfonic acid (MOPS)-formaldehyde gel. Subsequently, RT was carried out with the use of 1 μg of template RNA, the cDNA synthesis conditions being 23°C for 10 min, 42°C for 15 min, 99°C for 5 min, and 5°C for 5 min with the use of random hexamers (GeneAmp RNA PCR Kit; Applied Biosystems Canada, Streetsville, Ontario). The conditions for RT-PCR amplification of genes and ESTs were as follows: 45 cycles at 94°C for 1 min, annealing of gene-specific primers at temperatures described below for 30 s, and extension for 2 min at 72°C, followed by a final extension at 72°C for 10 min. Two protocols were used to optimize the PCR conditions. The 1st used a range of annealing temperatures concentrations of 1 to 3 mM. Not all genes (50°C to 65°C) and MgCl2 were amplified under these conditions; therefore, in a 2nd protocol, splenocytes cultured in 24-well plates in Roswell Park Memorial Institute tissue culture medium containing 10% fetal bovine serum, 2% chicken serum, 0.146 g of l-glutamine, 1.6 mM of 2-mercapto-ethanol, 200 U/mL of penicillin, 80 μg/mL of streptomycin, 25 mg of gentamicin, and 250 μg of amphotericin B were stimulated with con-canavalin A (Sigma-Aldrich Canada, Oakville, Ontario), 10 μg/mL, for 2, 4, 6, 24, and 48 h. Stimulation was followed by RNA extraction and cDNA synthesis. For a subset of genes that could not be amplified by either method, clones (indicated in Table I) were purchased from the Delaware Biotechnology Institute, University of Delaware (Newark, Delaware, USA).
Cloning of PCR fragments
Amplified PCR products were cloned into a uracil adenine vector (pDrive cloning vector; Qiagen, Mississauga, Ontario). The procedure included overnight ligation (at 10°C) of 13 to 65 ng of the PCR product into 50 ng of the vector, followed by electroporation into the bacterial host DH5α. Plasmid DNA from bacterial isolates was screened for correct size inserts by overnight digestion with EcoRI at 37°C. Plasmid DNA from positive clones was then column-purified (QIAprep Miniprep Plasmid Purification Kit; Qiagen), and the insert was amplified with the use of gene-specific primers, as above, and a 1:200 dilution of plasmid DNA. The PCR products were purified with use of the MinElute PCR Purification Kit (Qiagen); amplicon quality and size were confirmed on agarose gel before microarray spotting. The amplicon concentration was measured spectrophoto-metrically at a 260/280 nm ratio.
Spotting the microarray
All spot elements were printed in duplicate and replicated with 3 subgrids, each containing 186 spots in a 16 × 12 pattern. In total, 576 spot elements were contained within each microarray. Each array contained spots for PCR products, positive controls (housekeeping genes and β-actin serial dilutions [1/2, 1/4, and 1/8] of the original spotting concentration of 100 to 150 ng/μL), and negative controls (Rhodococcus equi VapA plasmid and dimethyl sulfoxide [DMSO]). The spot diameter was 90 to 100 μM and the center-to-center spot distance 250 and 300 μm between columns and rows, respectively. Each element contained 0.06 to 0.09 ng of PCR product at a concentration of 100 to 150 ng/μL in spotting buffer (100% DMSO). The PCR products were spotted on aminosilane-coated slides (GAPS II; Corning Life Sciences, Corning, Maine, USA) by means of the Virtek ChipWriter Professional Arrayer (Virtek Vision International, Waterloo, Ontario). Slides were printed at the Microarray Facility, University of Guelph.
Microarray hybridization and data analysis
With the use of TRIzol reagent, total RNA was extracted from a Reticuloendotheliosis virus (REV)-transformed B21 chicken B cell line established by Haeri et al (13) 6, 12, 24, and 48 h after stimulation with a bacterial LPS cocktail (10 μg/mL: 1 part Escherichia coli O55: B5 and Salmonella Enteritidis and 2 parts S. Typhimurium SL1181, Re mutant [Sigma-Aldrich Canada]), as well as from unstimulated B cells at each time point. With 20 μg of total RNA as a template, we generated cyanine-labeled cDNA probes (Cy3 and Cy5) using a Micromax Direct Labelling Kit (PerkinElmer, Woodbridge, Ontario). Four independent cell-culture experiments were carried out to compare the stimulated and unstimulated B cells at each time point, with the use of 16 microarrays in total. In 2 experiments, unstimulated samples of B cells were labeled with Cy3 and stimulated samples with Cy5, and in the remaining experiments the opposite labeling was performed to account for any bias inherent to the fluorescent dyes. The labeled probes were hybridized to the microarrays for 16 h at 65°C. The slides were washed in sodium citrate–sodium chloride buffer (SSC) diluted from 20X (3 M sodium chloride and 0.3 M sodium citrate, pH 7.0) and dried by centrifugation (500 × g for 2 min). The washes were performed sequentially in 0.5X SSC (with 0.1% sodium dodecyl sulfate [SDS]), 0.06% SSC (with 0.1% SDS), and 0.06% SSC alone at room temperature. Images were acquired with a ScanArray Express instrument (PerkinElmer) and analyzed with the ScanArray Express software, version 3.0.
Mean spot intensity and median background intensity were normalized by means of locally weighted regression and smoothing scatter plots (LOWESS) (14) by R (www.r-project.org/). The efficiency of LOWESS normalization was evaluated by checking the Cy5 intensity — Cy3 intensity plot for data from each array before and after LOWESS normalization. The normalized natural log intensities were then analyzed with a mixed-model approach by SAS (SAS 9.1.3, Windows Pro; SAS Institute, Cary, North Carolina, USA). The mixed model used to identify significantly differentially expressed genes was as follows: Yijklmn = μ + Li + Tj + Dk + Rl + Sm + L*Tij + eijklmn, where Yijklmn represents each normalized signal intensity, μ is an overall mean value, Li is the main effect of treatment i, Tj is the main effect of time point j, Dk is the main effect of dye k, Rl is the random effect of replicate l, Sm is the random effect of slide m, L*Tij is the interaction between treatment and time point, and eijklmn is a stochastic error (assumed to be normally distributed with mean 0 and variance σ2). The criteria for differential expression were established to include statistical significance reported at P ≤ 0.05 and a signal/noise ratio ≥ 2.
We assessed intra- and interassay reproducibility by plotting LOWESS normalized values of signal intensity for each gene and then calculating the correlation coefficient between data sets. Intra-assay variability was assessed by dividing 1 source of RNA, labeling 1 portion with Cy3 and the 2nd with Cy5, and hybridizing both to the same microarray. The LOWESS normalized median intensity of the Cy3 channel was plotted against that of the Cy5 channel. The correlation coefficient of the 2 median intensities was calculated to evaluate the degree of linear relatedness. The interassay variability was determined by dividing 1 source of RNA, labeling each portion with Cy3, and hybridizing the 2 samples onto different arrays. The LOWESS normalized median intensity of the Cy3 channel of 1 slide was plotted against that of the other slide, and the correlation between the 2 median intensities was calculated.
Semiquantitative PCR
A subset of genes showing differential expression during microarray analysis was selected for validation by semiquantitative PCR. The expression of genes for leukocyte-function-associated antigen 1 (LFA-1), heat-shock protein 70 (HSP70), CD164, caspase 3, Toll-like receptor 4 (TLR4), and invariant chain was compared with that for β-actin as follows. Total RNA was extracted from unstimulated and LPS-stimulated B cells at the 6-h point and reverse-transcribed into cDNA, as described above. Using gene-specific primers, we conducted RT-PCR amplification under the following conditions: 35 cycles at 94°C for 1 min, annealing temperature of 55°C for 30 s, and extension for 2 min at 72°C, followed by a final extension at 72°C for 10 min. The number of cycles was determined by examining the dynamic range of PCR reactions from 25 to 40 cycles (data not shown). The PCR products from the stimulated cells were analysed by agarose gel electrophoresis, and the relative band density of the LPS-stimulated and unstimulated cells at 6 h was compared with that of β-actin with the use of GeneTools (version 3.00.22; Synoptics, Cambridge, England).
Results
To annotate chicken ESTs that had some sequence homology with mammalian immune system genes, we used a bioinformatics approach. Members of certain chicken gene families, such as transcription and signal transduction molecules, had the highest acceptance rates owing to sequence conservation. In contrast, some gene families, including chemokines, chemokine receptors, cytokines, and cytokine receptors, diverged greatly from their mammalian counterparts and, as a result, had the highest rejection rates owing to failure to achieve the minimum annotation requirements (score values less than 100 and E-values approaching zero). For example, 50% of chemokine and chemokine receptor sequences were rejected, whereas 100% of the sequences related to antigen presentation and processing molecules were accepted for microarray production (Figure 1). In total, 84 gene elements, including 12 EST clones from the University of Delaware, were PCR-amplified and purified for microarray spotting.
Figure 1.

Number of genes and expressed sequence tags (ESTs) investigated before (grey bars) and remaining after (white bars) the bioinformatics annotation approach, those remaining being considered acceptable for the microarray. Genes and ESTs assigned to functional categories may be interpreted as a part of more than 1 family.
To determine intra-assay variability in gene expression profiles, we divided RNA, labeling 1 portion with Cy3 and the other with Cy5, and then hybridized both portions to a single array. The LOWESS normalized median intensity of the Cy3 channel was plotted against that of the Cy5 channel for all genes on the micro-array (Figure 2A). The correlation coefficient was 0.97, indicating good reproducibility between labeling with Cy3 or Cy5 across the microarray. To determine interassay variability, we divided RNA into 2 aliquots, labeled both with Cy3, and hybridized them onto different microarrays. The LOWESS normalized median intensities of the Cy3 channel of 1 slide were plotted against those of the Cy3 channel of another slide (Figure 2B). The correlation coefficient was 0.95, indicating good reproducibility between slides.
Figure 2.

Variability of gene expression profiles, based on LOWESS normalized median signal intensities. (A) Within-array variation plot, where the X and Y axes represent the median intensity of cyanine-labeled cDNA probes from the same source of RNA but labeled with Cy3 (X) or Cy5 (Y) and hybridized to the same microarray. (B) Between-array variation plot, where the X and Y axes represent the median intensity of Cy3-labeled probes from the same RNA source but hybridized to a different array.
We used a signal/noise ratio of 2 or greater to distinguish fluorescence due to hybridization from background fluorescence. Spots that did not meet this criterion were excluded from analysis. Between 27% and 59% of the genes were turned on at any given time, regardless of whether the B cells were treated with LPS. For each time point aside from 48 h, we observed statistically significant differences (P ≤ 0.05) between the gene expression profile of LPS-stimulated and unstimulated cells: at 6 h, 6 (7%) of 84 genes were significantly differentially regulated, and at both 12 and 24 h, 2 (2%) of 84 genes were differentially expressed (Table II). Expression of housekeeping genes, including those encoding β-actin and glyceraldehyde 3-phosphate dehydrogenase (GAPDH) did not change over time or after treatment with LPS. The negative control spots, VapA DNA, pDrive vector, and DMSO, did not hybridize. Importantly, spots representing genes known not to be expressed in B cells, such as CD3, CD8α, and CD8β, did not have a detectable signal (signal/noise ratio less than 2).
Table II.
Statistically significant changes in gene expression in B cells in response to stimulation with lipopolysaccharide for various times
| Gene category and ID | Time (h) | P-valuea | Average ratio | Fold changeb |
|---|---|---|---|---|
| Adhesion molecules | ||||
| LFA-1 | 6 | 0.018402 | 2.040038 | 2.04 |
| ICAM-1 | 24 | 0.030809 | 1.336307 | 1.33 |
| Invariant | 6 | 0.049729 | 1.134045 | 1.13 |
| TAP2 | 12 | 0.013891 | 0.792727 | −1.26 |
| Apoptosis molecules | ||||
| Caspase 3 | 6 | 0.04422 | 1.232248 | 1.23 |
| Cluster of differentiation molecules | ||||
| CD164 | 6 | 0.00000126 | 1.957402 | 1.95 |
| Cytokines and cytokine receptors | ||||
| TGF-βR1 | 12 | 0.019326 | 0.828287 | −1.20 |
| HSP70 | 6 | 0.014048 | 1.299446 | 1.29 |
| β2m | 24 | 0.01294 | 0.67667 | −1.47 |
| Innate immunity molecules | ||||
| TLR4 | 6 | 0.004582 | 1.609084 | 1.60 |
Calculated with use of a mixed model, as described in the text.
The minus signs indicate downregulation; the remaining genes were upregulated.
From the microarray results, we selected 6 genes (LFA-1, HSP70, CD164, caspase 3, TLR4, and invariant chain) that displayed significant differential expression 6 h after stimulation. In a representative experiment, upregulation of all 6 genes in B cells after stimulation with LPS was confirmed by semiquantitative RT-PCR (Figures 3A and 3B).
Figure 3A.
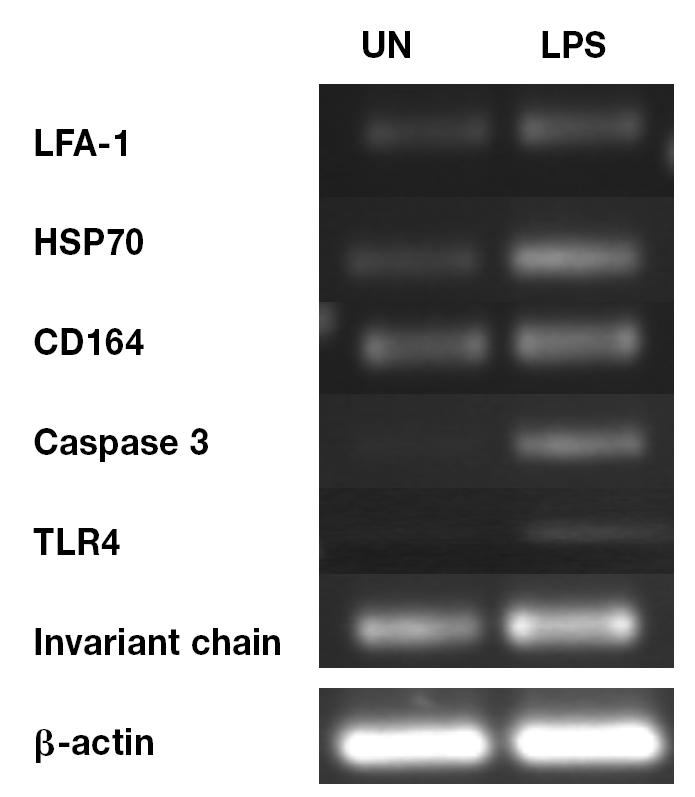
Validation of microarray data by semiquantitative reverse transcription polymerase chain reaction (RT-PCR) of RNA extracted from unstimulated B cells cultured for 6 h (UN) and B cells stimulated with lipopolysaccharide (LPS) for 6 h, followed by agarose gel electrophoresis, for comparison of the amplified gene for β-actin with those for leukocyte-function-associated antigen 1 (LFA-1), heat-shock protein 70 (HSP70), CD164, caspase 3, Toll-like receptor 4 (TLR4), and invariant chain.
Figure 3B.

Ratio of the raw volume fluorescence of the β-actin gene and each target gene in the unstimulated (white bars) and the LPS-stimulated (black bars) B cells, determined from the relative band density on the gel.
Discussion
We developed a chicken immune-specific microarray containing 84 gene elements associated with immune and inflammatory responses in the chicken and used the microarray to profile gene expression in chicken B cells in response to LPS. We validated the results by RT-PCR and assessed their reproducibility.
As a 1st step in constructing the microarray, we identified chicken genes that encode immune molecules in sequence databases. The chicken genome has recently been sequenced, but many of the genes have yet to be annotated (8). However, cross-species annotation has provided opportunities for gene discovery. For example, one-third of human genes were matched to chicken ESTs by means of BLAST, confirming previous comparative mapping studies that had noted some conservation between chicken and human genomes (15). Similarly, Tirunagaru et al (11), screening 5251 chicken EST clones for homology with known sequences, found that 25% of these clones matched previously characterized chicken genes and that 39% were homologous to genes in other species; only 11% did not have homologous hits. A recent analysis of chicken EST databases revealed that an in silico approach may serve as a useful discovery tool for immune system genes in the chicken (7), and we adapted this approach to annotate several previously unannotated chicken ESTs for inclusion in our microarray. Our criteria for annotating genes and ESTs were similar to those used by Tirunagaru et al (11) but more stringent than those used for chicken gene annotation in other studies (1,7). More stringent criteria exclude or minimize the possibility of inaccurate annotation. Although chicken genes that bear low homology with mammalian orthologs may be overlooked by a stringent approach, we wanted to increase confidence in the accuracy of our process.
Commonly with microarray data, differential gene expression is determined by the relative fold-change of fluorescence intensity between treated and untreated groups. The arbitrary criterion in the microarray field for considering up- or downregulation of a gene is 2-fold or greater (5,6,16). Setting arbitrary values for relative fold-change in gene expression may result in false discovery rates, because slight expression changes that might be biologically important are sometimes overlooked (17). Mixed models have been used for analysis of gene expression data (18), the main advantage being the ability to control various parameters that could affect gene expression, such as variation in quality of microarray slides, probes, and labelling reactions between replicates. It is more statistically powerful to view these factors as random variables among other fixed effects such as treatment, time point, and dose (18,19). Therefore, we used a mixed model to assess the statistical significance of temporal gene-expression changes in LPS-stimulated B cells compared with unstimulated cells.
Reportedly, there is substantial variability in microarray data; as a result, replicating experiments is critical for minimizing false-discovery rates (20). Although there is no prescribed replicate number, at least for in vitro experiments, misclassification can be avoided by using 3 replicates (20). We conducted 4 independent cell-culture experiments. Assessing the quality of gene expression data from microarrays can be difficult owing to the multifactorial nature of the assay (21). Although biologic variation can be dealt with by increasing the number of replicates, technical error should be minimized to ensure that the data are not confounded by unnecessary variation. For example, within-array and between-array technical variation can be larger than individual-to-individual variation (21). Microarray data may be evaluated for variability by correlating signal intensity ratios between and within slides (1,22). Therefore, to further substantiate data from the current study, we determined both within-array and between-array reproducibility. The correlation of signal intensity from hybridized RNA was 0.97 in the “self-versus-self” test and 0.95 in the between-array test, agreeing with other examples of reproducible microarray data (correlation coefficients of 0.88, 0.93, and 0.972) (1,22).
The chicken immune microarray was used to assess temporal gene expression in B cells after stimulation with LPS. To enhance the likelihood of stimulation, we used a cocktail of LPS from 3 strains, namely E. coli O55:B5, S. Enteritidis, and S. Typhimurium SL1181, Re Mutant, all of which have previously shown stimulatory effects on chicken cells (23–25). Microarray technology has been successfully used for expression profiling of LPS-responsive genes in several cell types, including B cells, hepatocytes, macrophages, neutrophils, and endothelial cells (26,27), coinciding with the results in our study. The LPS stimulation of chicken B cells resulted in changes in gene expression across time, most being observed after 6 h of stimulation. The observed time-dependency of gene expression in response to LPS is in agreement with previous findings (27).
Genes belonging to 7 out of 10 families described in this study were represented in the differential gene expression data. However, there was not 1 family in particular whose members were predominantly regulated in response to LPS. Of the 10 genes displaying differential expression after LPS stimulation, 7 were induced and 3 were repressed. In agreement with our findings, previous studies examining gene expression in human and chicken macrophages after stimulation with LPS have reported induction and repression of approximately 70% and 30%, respectively, of the genes represented on high-density microarrays (28,29). For technical validation of the microarray data, we selected a subset of genes that displayed enhanced expression 6 h after stimulation and confirmed the data by semiquantitative RT-PCR.
Expression of the TLR4 gene was induced after stimulation with LPS, which is known to exert its functions via binding to a complex of molecules, including LPS binding protein (LBP), CD14, and TLR4 (30). Chicken heterophils respond to LPS even in the absence of LBP (31). However, the response is significantly increased when the cell culture medium is supplemented with chicken serum, which contains LBP (31). Since the B cells used in the present study constitutively expressed TLR4 and were kept in a chicken serum-supplemented medium, these cells should have been optimally stimulated by LPS. Induction of the TLR4 gene in response to LPS, peaking 2 to 8 h after stimulation, has previously been observed (32), in association with PU.1, a transcription factor that belongs to the Ets family (32).
We also found induction of HSP70 after B cell stimulation with LPS. Previously it was shown that members of the HSP family are induced after LPS stimulation (33) and that heat shock proteins may act as TLR ligands (34). Through biochemical analyses, HSP70 has been shown to form a complex receptor in conjunction with HSP90, chemokine receptor CXCR4, and growth differentiation factor 5 (GDF5) that could bind LPS (35).
Stimulation with LPS also induced upregulation of adhesion molecule LFA-1 and its ligand, intercellular adhesion molecule (ICAM)-1, 6 h after stimulation. Both molecules have been implicated in B cell activation, as indicated by B cell aggregation in culture. In murine B cells, LPS stimulation caused an increase in cell aggregation that was largely facilitated by LFA-1. Activation of B cells with LPS induced a stronger avidity between LFA-1 and ICAM-1 in vitro than was identified without stimulation (36). More recently, the interaction between LFA-1 and ICAM-1 has been associated with the formation of mature B cell synapses after cellular activation (37). Thus, the upregulation of these adhesion molecules in the current study may be an indication of B cell activation induced by LPS.
In our study, transforming growth factor (TGF)-β receptor(R)-1 was downregulated 1.2 fold in response to LPS at 12 h. We suggest that this is related to a lack of TGF-β1 regulation in the culture. This growth factor has a regulatory effect, inhibiting B and T cell function. In chickens, TGF-β1 has been shown to reduce secondary antibody production and B cell proliferation (induced by LPS) by more than 90% (38). In order for this substance to have such substantial effects on cell proliferation, the receptor must be tightly regulated. The downregulation of TGF-βR1 observed in the present study indicates a cellular process biased towards cell activation and proliferation, preventing the immunosuppressive effects of TGF-β1 by down-regulating the necessary receptor.
In accordance with the data obtained in other species (39), we detected significant induction of the invariant chain gene after LPS stimulation, which was confirmed by RT-PCR. Invariant chain is a monomorphic protein that is involved in antigen processing and presentation by binding to the newly synthesized major histocompatibility complex (MHC) class II molecules to protect them from binding to low-affinity peptides in the endoplasmic reticulum (40). In addition, it has been suggested that invariant chain may play a role in differentiation of B cells (40). Therefore, it is plausible that LPS stimulation results in activation of the chicken MHC class II antigen presentation pathway, as marked by enhanced expression of the invariant chain gene.
According to the RT-PCR data, the caspase-3 gene was induced more than 4-fold in LPS-stimulated B cells. Members of the caspase family are involved in the induction of apoptosis. Caspase-3 activation in the chicken correlates with apoptosis of B cells (41). Although LPS is a known activating ligand for B cells, it is possible that stimulation by LPS results in induction of apoptosis due to activation-induced cell death or via other mechanisms. For example, LPS has been shown to induce apoptosis in lymphocytes by activation of caspase-11 in a caspase-3- and caspase-7-dependent manner (42).
Another gene whose differential expression was confirmed by RT-PCR in this study was CD164, or endolyn. The expression pattern of this molecule in the lymphoid tissues of the chicken has not been studied. Furthermore, little is known about the potential role of this molecule in response to LPS.
These examples of gene regulation and function are merely a glimpse into the cellular regulation affected by LPS stimulation. By inferring function to the genes showing differential expression, one can further validate the microarray results obtained from gene profiling of chicken B cells. The ability to analyse and profile gene expression in the immune system of the chicken will provide opportunities for future studies in chicken immunology.
Acknowledgments
We acknowledge the financial support of the Food Systems Biotechnology Centre, Natural Sciences and Engineering Research Council of Canada–Agriculture and Agri-Food Canada Partnerships Program, the Canada Foundation for Innovation, the Ontario Innovation Trust, the Ontario Ministry of Agriculture and Food, and the Poultry Industry Council.
References
- 1.Burnside J, Neiman P, Tang J, et al. Development of a cDNA array for chicken gene expression analysis. BMC Genomics. 2005;6:13. doi: 10.1186/1471-2164-6-13. [DOI] [PMC free article] [PubMed] [Google Scholar]
- 2.Neiman PE, Ruddell A, Jasoni C, et al. Analysis of gene expression during myc oncogene-induced lymphomagenesis in the bursa of Fabricius. Proc Natl Acad Sci U S A. 2001;98:6378–6383. doi: 10.1073/pnas.111144898. [DOI] [PMC free article] [PubMed] [Google Scholar]
- 3.Cogburn LA, Wang X, Carre W, et al. Systems-wide chicken DNA microarrays, gene expression profiling, and discovery of functional genes. Poultry Sci. 2003;82:939–951. doi: 10.1093/ps/82.6.939. [DOI] [PubMed] [Google Scholar]
- 4.Koskela K, Kohonen P, Nieminen P, Buerstedde JM, Lassila O. Insight into lymphoid development by gene expression profiling of avian B cells. Immunogenetics. 2003;55:412–422. doi: 10.1007/s00251-003-0592-7. [DOI] [PubMed] [Google Scholar]
- 5.Karaca G, Anobile J, Downs D, Burnside J, Schmidt CJ. Herpesvirus of turkeys: microarray analysis of host gene responses to infection. Virology. 2004;318:102–111. doi: 10.1016/j.virol.2003.09.025. [DOI] [PubMed] [Google Scholar]
- 6.Liu H, Cheng HH, Tirunagaru V, Sofer L, Burnside J. A strategy to identify positional candidate genes conferring Marek’s disease resistance by integrating DNA microarrays and genetic mapping. Anim Genet. 2001;32:351–359. doi: 10.1046/j.1365-2052.2001.00798.x. [DOI] [PubMed] [Google Scholar]
- 7.Smith J, Speed D, Law AS, Glass EJ, Burt DW. In-silico identification of chicken immune related genes. Immunogenetics. 2004;56:122–133. doi: 10.1007/s00251-004-0669-y. [DOI] [PubMed] [Google Scholar]
- 8.International Chicken Genome Sequencing Consortium. Sequence and comparative analysis of the chicken genome provide unique perspectives on vertebrate evolution. Nature. 2004;432:695–716. doi: 10.1038/nature03154. [DOI] [PubMed] [Google Scholar]
- 9.Tao W, Mallard B, Karrow N, Bridle B. Construction and application of a bovine immune–endocrine cDNA microarray. Vet Immunol Immunopathol. 2004;101:1–17. doi: 10.1016/j.vetimm.2003.10.011. [DOI] [PubMed] [Google Scholar]
- 10.Ledger TN, Pinton P, Bourges D, Roumi P, Salmon H, Oswald IP. Development of a macroarray to specifically analyze immunological gene expression in swine. Clin Diagn Lab Immunol. 2004;11:691–698. doi: 10.1128/CDLI.11.4.691-698.2004. [DOI] [PMC free article] [PubMed] [Google Scholar]
- 11.Tirunagaru VG, Sofer L, Cui J, Burnside J. An expressed sequence tag database of T-cell-enriched activated chicken splenocytes: sequence analysis of 5251 clones. Genomics. 2000;66:144–151. doi: 10.1006/geno.2000.6189. [DOI] [PubMed] [Google Scholar]
- 12.Rozen S, Skaletsky HJ. Primers on the WWW for general users and for biologist programmers. In: Krawetz S, Misener S, eds. Bioinformatics Methods and Protocols: Methods in Molecular Biology. Totowa, New Jersey: Humana Press, 2000:365. [DOI] [PubMed]
- 13.Haeri M, Read LR, Wilkie BN, Sharif S. Identification of peptides associated with chicken major histocompatibility complex class II molecules of B21 and B19 haplotypes. Immunogenetics. 2005;56:854–859. doi: 10.1007/s00251-004-0760-4. [DOI] [PubMed] [Google Scholar]
- 14.Cleveland WS, Grosse E, Shyu WM. Local regression models. In: Chambers JM, Hastie TJ, eds. Statistical Models. Pacific Grove, California: Wadsworth & Brook/Cole, 1992:chapter 8.
- 15.Wu XL, Griffin KB, Garcia MD, et al. Census of orthologous genes and self-organizing maps of biologically relevant transcriptional patterns in chickens (Gallus gallus) Gene. 2004;340:213–225. doi: 10.1016/j.gene.2004.06.038. [DOI] [PubMed] [Google Scholar]
- 16.Morgan RW, Sofer L, Anderson AS, Bernberg EL, Cui J, Burnside J. Induction of host gene expression following infection of chicken embryo fibroblasts with oncogenic Marek’s disease virus. J Virol. 2001;75:533–539. doi: 10.1128/JVI.75.1.533-539.2001. [DOI] [PMC free article] [PubMed] [Google Scholar]
- 17.Yao B, Rakhade SN, Li Q, et al. Accuracy of cDNA microarray methods to detect small gene expression changes induced by neuregulin on breast epithelial cells. BMC Bioinformatics. 2004;5:99. doi: 10.1186/1471-2105-5-99. [DOI] [PMC free article] [PubMed] [Google Scholar]
- 18.Tempelman RJ. Assessing statistical precision, power, and robustness of alternative experimental designs for two color micro-array platforms based on mixed effects models. Vet Immunol Immunopathol. 2005;105:175–186. doi: 10.1016/j.vetimm.2005.02.002. [DOI] [PubMed] [Google Scholar]
- 19.Yang Y, Hoh J, Broger C, et al. Statistical methods for analyzing microarray feature data with replications. J Comp Biol. 2003;10:157–169. doi: 10.1089/106652703321825946. [DOI] [PubMed] [Google Scholar]
- 20.Lee ML, Kuo FC, Whitmore GA, Sklar J. Importance of replication in microarray gene expression studies: statistical methods and evidence from repetitive cDNA hybridizations. Proc Natl Acad Sci U S A. 2000;97:9834–9839. doi: 10.1073/pnas.97.18.9834. [DOI] [PMC free article] [PubMed] [Google Scholar]
- 21.Chen JJ, Delongchamp RR, Tsai CA, et al. Analysis of variance components in gene expression data. Bioinformatics. 2004;20:1436–1446. doi: 10.1093/bioinformatics/bth118. [DOI] [PubMed] [Google Scholar]
- 22.Donaldson L, Vuocolo T, Gray C, et al. Construction and validation of a bovine innate immune microarray. BMC Genomics. 2005;6:135. doi: 10.1186/1471-2164-6-135. [DOI] [PMC free article] [PubMed] [Google Scholar]
- 23.Parmentier HK, De Vries Reilingh G, Nieuwland MGB. Kinetic and immunohistochemical characteristics of mitogen-induced cutaneous hypersensitivity in chickens selected for antibody responsiveness. Vet Immunol Immunopathol. 1998;66:367–376. doi: 10.1016/s0165-2427(98)00200-1. [DOI] [PubMed] [Google Scholar]
- 24.Farnell MB, He H, Kogut MH. Differential activation of signal transduction pathways mediating oxidative burst by chicken heterophils in response to stimulation with lipopolysaccharide and lipoteichoic acid. Inflammation. 2003;27:225–231. doi: 10.1023/a:1025088514676. [DOI] [PubMed] [Google Scholar]
- 25.Abdalla SA, Horiuchi H, Furusawa S, Matsuda H. Molecular study on chicken tumor necrosis factor receptor-II and tumor necrosis factor receptor-associated factor-5. Vet Immunol Immunopathol. 2004;98:31–41. doi: 10.1016/j.vetimm.2003.10.004. [DOI] [PubMed] [Google Scholar]
- 26.Liu S, Gallo DJ, Green AM, et al. Role of toll-like receptors in changes in gene expression and NF-kappa B activation in mouse hepatocytes stimulated with lipopolysaccharide. Infect Immun. 2002;70:3433–3442. doi: 10.1128/IAI.70.7.3433-3442.2002. [DOI] [PMC free article] [PubMed] [Google Scholar]
- 27.Zhu X, Hart R, Chang MS, et al. Analysis of the major patterns of B cell gene expression changes in response to short-term stimulation with 33 single ligands. J Immunol. 2004;173:7141–7149. doi: 10.4049/jimmunol.173.12.7141. [DOI] [PubMed] [Google Scholar]
- 28.Nau GJ, Richmond JF, Schlesinger A, Jennings EG, Lander ES, Young RA. Human macrophage activation programs induced by bacterial pathogens. Proc Natl Acad Sci U S A. 2002;99:1503–1508. doi: 10.1073/pnas.022649799. [DOI] [PMC free article] [PubMed] [Google Scholar]
- 29.Bliss TW, Dohms JE, Emara MG, Keeler CL., Jr Gene expression profiling of avian macrophage activation. Vet Immunol Immunopathol. 2005;105:289–299. doi: 10.1016/j.vetimm.2005.02.013. [DOI] [PubMed] [Google Scholar]
- 30.Guha M, Mackman N. LPS induction of gene expression in human monocytes. Cell Signal. 2001;13:85–94. doi: 10.1016/s0898-6568(00)00149-2. [DOI] [PubMed] [Google Scholar]
- 31.Kogut MH, He H, Kaiser P. Lipopolysaccharide binding protein/CD14/TLR4-dependent recognition of salmonella LPS induces the functional activation of chicken heterophils and up-regulation of pro-inflammatory cytokine and chemokine gene expression in these cells. Anim Biotechnol. 2005;16:165–181. doi: 10.1080/10495390500264896. [DOI] [PubMed] [Google Scholar]
- 32.Pedchenko TV, Park GY, Joo M, Blackwell TS, Christman JW. Inducible binding of PU.1 and interacting proteins to the Toll-like receptor 4 promoter during endotoxemia. Am J Physiol Lung Cell Mol Physiol. 2005;289:L429–L437. doi: 10.1152/ajplung.00046.2005. [DOI] [PubMed] [Google Scholar]
- 33.Hirsh MI, Hashiguchi N, Chen Y, Yip L, Junger WG. Surface expression of HSP72 by LPS-stimulated neutrophils facilitates γδ T cell-mediated killing. Eur J Immunol. 2006;36:712–721. doi: 10.1002/eji.200535422. [DOI] [PubMed] [Google Scholar]
- 34.Cohen-Sfady M, Nussbaum G, Pevsner-Fischer M, et al. Heat shock protein 60 activates B cells via the TLR4-MyD88 pathway. J Immunol. 2005;175:3594–3602. doi: 10.4049/jimmunol.175.6.3594. [DOI] [PubMed] [Google Scholar]
- 35.Triantafilou M, Triantafilou K. Lipopolysaccharide recognition: CD14, TLRs and the LPS-activation cluster. Trends Immunol. 2002;23:301–304. doi: 10.1016/s1471-4906(02)02233-0. [DOI] [PubMed] [Google Scholar]
- 36.Greicius G, Tamosiunas V, Severinson E. Assessment of the role of leucocyte function-associated antigen-1 in homotypic adhesion of activated B lymphocytes. Scand J Immunol. 1998;48:642–650. doi: 10.1046/j.1365-3083.1998.00442.x. [DOI] [PubMed] [Google Scholar]
- 37.Carrasco YR, Fleire SJ, Cameron T, Dustin ML, Batista FD. LFA-1/ICAM-1 interaction lowers the threshold of B cell activation by facilitating B cell adhesion and synapse formation. Immunity. 2004;20:589–599. doi: 10.1016/s1074-7613(04)00105-0. [DOI] [PubMed] [Google Scholar]
- 38.Quere P, Thorbecke GJ. Multiple suppressive effects of transforming growth factor β 1 on the immune response in chickens. Cell Immunol. 1990;129:468–477. doi: 10.1016/0008-8749(90)90221-c. [DOI] [PubMed] [Google Scholar]
- 39.Goetz FW, Iliev DB, McCauley LAR, et al. Analysis of genes isolated from lipopolysaccharide-stimulated rainbow trout (Oncorhynchus mykiss) macrophages. Mol Immunol. 2004;41:1199–1210. doi: 10.1016/j.molimm.2004.06.005. [DOI] [PubMed] [Google Scholar]
- 40.Matza D, Kerem A, Shachar I. Invariant chain, a chain of command. Trends Immunol. 2003;24:264–268. doi: 10.1016/s1471-4906(03)00073-5. [DOI] [PubMed] [Google Scholar]
- 41.Compton MM, Wickliffe JK. Multiparametric assessment of bursal lymphocyte apoptosis. Dev Comp Immunol. 1999;23:487–500. doi: 10.1016/s0145-305x(99)00034-8. [DOI] [PubMed] [Google Scholar]
- 42.Kang SJ, Wang S, Kuida K, Yuan J. Distinct downstream pathways of caspase-11 in regulating apoptosis and cytokine maturation during septic shock response. Cell Death Diff. 2002;9:1115–1125. doi: 10.1038/sj.cdd.4401087. [DOI] [PubMed] [Google Scholar]