Abstract
Proteomics has recently demonstrated utility in understanding cellular processes on the molecular level as a component of systems biology approaches and for identifying potential biomarkers of various disease states. The large amount of data generated by utilizing high efficiency (e.g., chromatographic) separations coupled to high mass accuracy mass spectrometry for high-throughput proteomics analyses presents challenges related to data processing, analysis, and display. This review focuses on recent advances in nanoLC-FTICR-MS-based proteomics approaches and the accompanying data processing tools that have been developed to display and interpret the large volumes of data being produced.
Keywords: FTICR-MS, Proteomics, AMT tag, SPICAT, QCET, PhIST
Introduction
The increasing availability of fully or partially sequenced genomes has introduced a new era of biological research. In particular, one area of growing importance is systems biology in which systems-level approaches are employed to understand complex biological systems. At its finest level, this holistic approach can be used to study the roles and interconnectivities of biological macromolecules and other chemical species within a given system and their relationship to the biological function of that system. A systems level understanding of organisms is anticipated to increasingly impact biomedical research, drug discovery, nutrition science, and clinical practices.
The ability to broadly measure biological macromolecules, especially proteins, in a high-throughput manner is essential for delineating complex cellular networks and pathways and the response of these pathways to biological stressors (e.g., varying growth conditions, disease state, or other physiological perturbations). While the genome of an organism may be considered static, the expression of that genome as gene products — the most important products being proteins — is constantly changing due to the influence of environmental and physiological conditions. For example, both mRNAs and proteins can be expressed, modified, and degraded at substantially different rates. Thus, measuring the changes in protein expression in response to cellular stressors provides important information on the underlying processes. This information can lead to a better understanding of disease processes in humans, which can aid in the development of novel drug therapies. In this regard there is broad interest in identifying proteins as potential biomarkers for a range of diagnostic and clinical applications. By detecting abundance changes that robustly reflect the onset of physiological changes,these protein biomarkers can indicate a predisposition to or the presence of a disease state. Exploration of a proteome — the entire complement of proteins expressed by a cell under a specific set of conditions at a specific time — depends not only on establishing robust high-throughput methods for sample analysis, but also on finding solutions to the subsequent challenge of extracting the desired information from the vast quantities of data that are commonly produced in both systems biology and candidate biomarker discovery efforts.
Significant technological advances in proteomics approaches and instrumentation, as well as in related (bio)informatics data analysis, have been achieved over the past decade and have been comprehensively reviewed elsewhere (Aebersold & Goodlett, 2001, Aebersold & Mann, 2003, Ferguson & Smith, 2003, Godovac-Zimmerman & Brown, 2001). One of the most powerful of the proteomics approaches involves combining very high resolution and high efficiency separations with very high accuracy and high-resolution mass spectrometry. Gradient elution, reversed phase liquid chromatography (LC) coupled to Fourier transform-ion cyclotron resonance mass spectrometry (FTICR-MS) is currently the most powerful approach in terms of overall separation power and sensitivity, and has been the primary focus of proteomics efforts at our laboratory. Here, we describe recent advances in nanoLC-FTICR-MS-based high throughput proteome analysis and the accompanying data processing tools used to interpret and display the large volumes of data produced, as well as the challenges associated with these developments.
Historical Overview of nanoLC-ESI-FTICR-MS
Since its introduction 30 years ago (Comisarow & Marshall, 1974a, Comisarow & Marshall, 1974b), FTICR-MS has gradually emerged as a powerful technology for the analysis of biological samples, but has only recently begun to move away from its niche role. Approaches for both “top-down” and “bottom-up” proteomics have used the high resolution and mass measurement accuracy (MMA) afforded by FTICR-MS to determine peptide/protein identities from parent masses, along with a powerful array of methods to identify peptide/protein sequences and modifications based upon fragmentation patterns. Significant advances in FTICR-MS technology have been reported over the last decade (Belov, et al., 2000b, Marshall, et al., 1998, Marshall, 2000, Paša-Tolić, et al., 2002, Zubarev, et al., 1998). In addition, there are a number of excellent reviews available on FTICR-MS (Holliman, et al., 1994, Marshall, 1996, Marshall & Guan, 1996, Marshall, et al., 1998, McLafferty, 1994) and its use in proteomics (Bergquist, 2003, Bogdanov & Smith, 2005, Page, et al., 2004). Interested readers are directed to these reviews for additional information.
FTICR-MS is attractive for proteomics because it simultaneously provides high sensitivity, high MMA, and a wide dynamic range (Belov, et al., 2000b, Bruce, et al., 1999, Marshall, et al., 1998). In some regards, the high sensitivity analyses afforded by FTICR-MS are surprising since 30 to 50 charges typically must be trapped in an FTICR cell to provide a S/N >3, in contrast to conventional ion trap and time of flight mass spectrometers that can obtain a measurable signal from only a single ion. However, when considered from the viewpoint of overall ion utilization efficiency, the advantage of FTICR-MS compared to ion trap MS is the ability to trap 103 to 104 larger ion populations, and thus provide measurements of a much larger fraction of the ions produced by an electrospray ionization (ESI) source at any given point in a chromatographic separation. The data quality at low signal levels is also better in that relative isotopic peak intensities based upon hundreds of ions do not suffer from the stochastic issues associated with smaller ion populations, while the high resolution of measurements greatly reduces background due to “chemical noise”. These qualities provide the basis for studying either small cell populations or biofluid volumes, and enable measurement of changes in relative protein abundances for low level species with improved fidelity relative to other technologies.
The ability of FTICR-MS to measure masses with a high level of mass accuracy (e.g., ppb to ppm levels) could be considered the most important feature of FTICR-MS for proteomics analysis. This level of routinely achievable MMA allows peptides to be identified without the need for one at a time peptide selection and MS/MS analysis for identification.
Obtaining broad proteome coverage in bottom-up analyses often involves dealing with extremely complex mixtures of peptides. Despite the high resolution and high mass measurement accuracy afforded by FTICR-MS, only a limited view of the proteome can be obtained unless the mixture has been separated by some method prior to mass spectral analysis. Without such separations or fractionation, one is both limited by the dynamic range achievable in a single spectrum and, more importantly, by the fact that even very high levels of resolution are insufficient for extremely complex peptide mixtures. Thus, even with the use of extended signal averaging, spectral congestion becomes a limiting issue since the more abundant species within a sample prevent the detection of many of the less abundant species.
Separation prior to mass spectral analysis can generally increase the effective dynamic range of the analysis by effectively splitting the sample into fractions to allow resolution of species that would otherwise be unresolved. Separations also improve the ion utilization efficiency by mass spectrometers to provide increased sensitivity and increased dynamic range for measurements (e.g., by the use of automated gain control to allow longer ion accumulation times in ion trap MS or FTICR-MS). This technique is particularly useful during the portions of a separation where fewer ions are produced as a result of fewer components eluting. With LC, the components of a complex mixture are separated on the basis of their hydrophobicity or other liquid chromatographic behavior (such as the overall charge on the molecule or size of the molecule). Yates and coworkers have applied their multidimensional LC/LC-MS/MS (MudPIT) approach to identify peptides from complex proteomic mixtures (Link, et al., 1999, MacCoss, et al., 2002, Washburn, et al., 2001). This approach uses two different separation dimensions based on capillary columns packed with strong cation exchange (SCX) and reversed-phase materials. Peptides eluting from the separation undergo ESI while an ion-trap mass spectrometer is generally used for MS/MS analysis. This method can be somewhat limited by the rate at which the mass spectrometer can switch between MS and MS/MS modes and by the number of coeluting species from a separation that can be analyzed. This limitation leads to an “undersampling” of complex peptide mixtures and the need for multiple analyses of the same sample to identify most of the otherwise measurable species.
Capillary LC separation coupled to FTICR-MS has been demonstrated as an ultra-sensitive method for characterizing proteolytic digests. This method benefits from high dynamic range, mass resolution and mass accuracy (Belov, et al., 2001b, Conrads, et al., 2001, Shen, et al., 2001a, Shen, et al., 2001b). Over the last decade we have developed and refined nanoscale capillary LC (nanoLC)-FTICR-MS approaches that have evolved into an accurate mass and time (AMT) tag approach (described below) that has proved to be a robust method for automated high-throughput proteomics studies (Belov, et al., 2004, Paša-Tolić et al., 2004, Lipton, et al., 2002).
Development of the AMT Tag Approach
Basis of the AMT Tag Approach
In recent years, efforts in our laboratory have focused on developing an MS-based approach for high throughput proteomics. This strategy takes advantage of both the high accuracy mass measurements derived from FTICR-MS and the retention time information obtained from high efficiency capillary nanoLC separation(s) to provide extensive coverage of the complex sets of components being studied. The AMT tag strategy is based on the uniqueness of the measured molecular mass and LC elution (or retention) time for a specific peptide in the context of a particular biological system. The strategy implicitly makes use of the fact that many possible species (e.g., modification states, sequence variants, etc.) are unlikely to be detected, and that given sufficient two-dimensional (2D) separation power, a species previously identified at a particular point in the 2D mass-separation time space with high confidence (e.g., using MS/MS and lower throughput measurements) will most likely be the same species observed at that mass and separation time in other analyses of the same system. In other words, the probability will be low that “new” species detected in additional analyses of the same system will be observed at the same mass and separation time as a previously assigned species. The extent to which this is true depends on 1) the complexity of the system, 2) the complexity of the measurable components of the system being analyzed, 3) the overall separation efficiency (i.e., peak capacity) of the 2D analysis, and 4) the separation time and mass accuracy of the measurements. Thus, the approach uses the distinctiveness of mass and LC separation time information to associate detected “features” with either their matching peptides or to other species previously identified (Smith, et al., 2002, Norbeck, et al., 2005). By using LC-FTICRMS instrumentation, the AMT tag strategy provides increased sensitivity, coverage, and throughput, and facilitates quantitative studies that involve many analyses of different perturbations or time points.
Importantly, nanoLC-FTICR-MS measurements must resolve features that have distinctive, accurately measured molecular masses and LC retention times. In general, the resolution easily provided by FTICR-MS (>50,000) is more than sufficient when combined with chromatographic separations since the number of individual species detectable in each spectrum is typically on the order of hundreds. On the other hand, the features are far from fully resolved in the LC dimension; thus, the primary role of the chromatographic separation is to reduce the sample complexity prior to MS measurement. In both dimensions, however, the utility of the data depends substantially on its reproducibility and accuracy.
Individual peptide accurate masses reflect the chemical (i.e., amino acid) composition of the identified peptide sequence, while the observed LC elution time is dictated by the contributions of the amino acid sequence and the detailed structural conformation of the peptide. The overall LC-MS effective resolution (R) of the 2D analysis (mass and time dimensions) can be expressed as:
where the mass measurement accuracy (MMA) and LC elution time measurement accuracy (TMA) both provide essentially equivalent contributions to the overall resolution. The overall 2D resolution of this analysis statistically yields a distinguishing power equivalent to that achievable using MS alone, but with a much better MMA. However, the selectivity of the LCMS measurement is greater because the MMA×TMA product reflects both peptide chemical composition and physicochemical properties, and thus can distinguish many peptides (e.g., sequence variants) that have identical masses. Thus, the greater the 2D resolving power provided by using accurate mass and time measurements, the greater the ability to confidently distinguish peptides in very complex proteome samples. Currently, our laboratory has applied the AMT tag strategy with LC-FTICR-MS for high throughput proteome analyses of many different microbial and mammalian systems.
Current Implementation of the AMT Tag Approach
The AMT tag strategy for bottom-up proteomics using LC-MS involves two stages (Figure 1). In the first stage, the proteome is enzymatically digested, and the resulting sample is introduced by capillary LC into an ion trap (or comparable) mass spectrometer for MS/MS analysis. The resultant data is processed using a series of software tools developed in-house to track and process proteomic data using our Proteomics Research Information Storage and Management System (PRISM) (Kiebel, et al.). The raw data is analyzed using SEQUEST (Eng, et al., 1994), Mascot (Perkins, et al., 1999), or other programs to identify peptides from MS/MS spectra. Those sets of peptides identified from a particular system are stored as “potential mass and time tags” (or PMT tags) in a SQL Server database along with the corresponding (calculated) exact monoisotopic mass and normalized LC elution time (observed peak apex) for each peptide.
Figure 1.
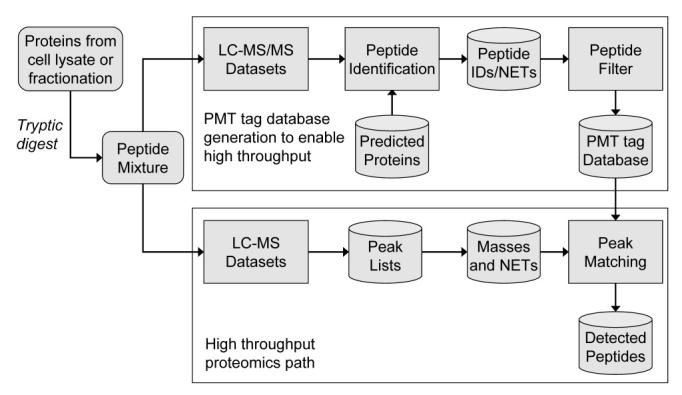
The AMT tag data analysis approach.
Peptides for each biological organism studied are segregated into organism-specific databases, which are populated with both unmodified peptides and peptides that contain post-translational modifications. Every unique sequence observed is designated by a unique integer identification (ID) value that takes into account post-translational or isotopic modifications. When the same peptide sequence is observed in several mass spectra (or different analyses), the same ID value is assigned to the sequence. The use of unique ID values allows us to readily track the pedigree of every PMT tag, including all analyses for which a particular peptide was observed. We also maintain a master database that contains all unique sequences that were observed for all organisms studied, which greatly simplifies the task of combining observations from multiple organisms in studies of multi-organism communities or host-pathogen systems.
Because a peptide is often observed in several different analyses with similar, but slightly different elution times or peak profiles (e.g., due to a variation in separation speed), the observed LC elution time data for each separate analysis must be normalized (aligned) to produce normalized elution time (NET) values for each peptide. The availability of NET values provides for effective comparison (alignment) of multiple analyses and allows an average NET value to be computed for each observed peptide. Normalization was initially accomplished by aligning all of the analyses en masse, using a genetic algorithm to match common peptides detected in multiple analyses (Goldberg, 1989, Holland, 1975). This method successfully converted observed elution times to normalized elution times for each analysis; however, the alignment process became increasingly computationally demanding as the number of datasets increased. Consequently, the process was redesigned to normalize each LC-MS/MS analysis independently by regressing the observed peptide elution times in a given analysis against the predicted normalized elution time for each identified peptide (Petritis, et al., 2003). This predictive capability was based on the use of large sets of peptides confidently identified by LC-MS/MS (see below). Figure 2 shows the results for an analysis of a Shewanella oneidensis global tryptic digest sample. This plot compares the observed elution times for 2925 unique peptides with their predicted normalized elution times at a specified level of confidence for peptide identification; the plot exhibits good correlation, with R2 = 0.95. Linear regression against the predicted times (using the first observation of each peptide in each analysis) results in LC NET values for all peptides in the given analysis. The example in Figure 2 includes some cases of lower confidence and potentially false positive identifications that contribute to the scatter in the plot. The accuracy of this regression is improved by only including higher confidence peptide identifications that pass a given set of filtering criteria for identification score and enzymatic cleavage state. Note, our observations indicate that the quality of the overall alignment is relatively insensitive to the filtering criteria; as such, this approach has been highly effective for normalizing LC elution times. We have recently slightly improved the quality of the separation dimension alignment by developing software tools that allow the peptide peak apex to be used rather than its time of first detection; however, this change makes, on average, less than a 0.15% difference in the NET values. These approaches are preliminary to more sophisticated approaches that will allow for detailed “warping” of the separation dimension (e.g., to account for small variations in flow rate during a separation) to optimize overall alignment of both the LC-MS and LC-MS/MS datasets.
Figure 2.
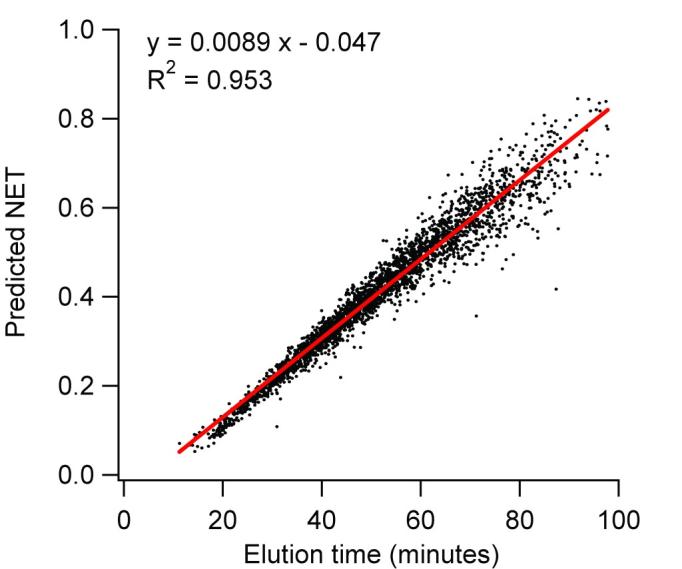
Plot of observed elution time versus predicted elution time for 2925 peptides from a S. oneidensis global tryptic digest.
The predicted peptide NET values referred to above were determined by employing a neural network-based model that was developed from training data for 20 species that included over 140,000 different high confidence peptide identifications (Petritis, et al., 2003). Predicted NET values generally range from 0 to 1, and in our present model are based on the composition and order of the first 8 and last 8 residues in a peptide (or all residues when the peptide is 16 residues long or less). The model considers the 20 common amino acid residues, in addition to alkylated cysteine. Once the observed NET values for all peptides identified in either an LCMS/MS or LC-MS analysis have been determined, the observed NET values can be compared with the predicted NET values. This information can be used to downgrade or exclude peptide identifications that differ significantly between the observed value for the putative peptide and the predicted value. This discrimination is most effectively implemented in the context of a discriminant model that provides an optimized weighting to each of the criteria used for peptide identification. We compute such a measure of confidence for every observation of a particular PMT tag. Our discriminant model extends an approach described by Aebersold and coworkers (Keller, et al., 2002) to include the difference in observed and predicted NET values. Our discriminant model also incorporates several SEQUEST scoring parameters (peptide cleavage state, difference in observed and computed mass, and other indicators) to compute a confidence score for each PMT tag. This score circumvents the use of a fixed score threshold, e.g., SEQUEST Xcorr value of 3, to provide a sufficient level of confidence for peptide identifications. The advantage of using this approach is that a discriminant-based score is less likely to discard peptide identifications than a score based strictly on threshold criteria. Initial results (Strittmatter, et al., 2004) show that the incorporation of NET data along with SEQUEST scoring information further improves the confidence of identifications by approximately 10% compared to a discriminant that does not use elution time information.
PMT tag databases are generally created by combining peptide observations from multiple (and often extensive sets of) LC-MS/MS analyses of appropriately related samples. For example, separate PMT tag databases can be created for the different tissue/cell types for an organism. When populating such a peptide database, statistics are collected for each PMT tag (unique sequence), including its highest MS/MS discriminant score and the number of MS/MS spectra in which it has been identified. For peptides observed in several analyses, the NET values are averaged, which provides statistics on the distribution of NET values for each peptide. Because each peptide observation has a discriminant score value associated with it, a weighted average is used to compute the average NET, giving more weight to those peptides with higher discriminant score values.
Once a PMT tag database has been generated for a given system, subsequent proteolytic digests for this system can be studied in a high throughput manner by using a nanoLC-FTICRMS platform that generates accurate mass and retention time information for each observed analyte. Peptides (and thus proteins) are identified by matching the measured accurate mass and NET (referred to as a “feature”) for a particular peptide against peptide values listed in the PMT tag database within specific thresholds (i.e., maximum deviations from expected values). Such identifications by LC-FTICR-MS effectively validate a PMT tag as “accurate,” i.e., the peptide identification gains a higher level of confidence, and an AMT tag is designated. In addition, by effectively aligning detected peptides (or even unassigned features) from different analyses, one sample can be compared to a second related sample to identify interesting changes. This information can also be used to guide data-directed LC-MS/MS (as discussed in Section V) for the identification of potentially interesting, but unassigned features. A key advantage of the AMT tag approach is that once a relatively comprehensive PMT/AMT tag database has been generated, future samples for the same system need only be analyzed by high throughput LC-FTICR-MS without the need for repeated LC-MS/MS analyses to reestablish peptide identities, thereby obtaining greater sensitivity than could be achieved with LC-MS/MS.
AMT Tag Approach Using Time-of-flight (TOF) Mass Spectrometers
Relatively high resolution and high accuracy MS analyses may be performed using capillary LC with either an FTICR mass spectrometer or a time-of-flight (TOF) mass spectrometer. The high mass resolution (>105) and high mass accuracy (<1 ppm) provided by FTICR instruments make them a powerful tool for the AMT tag approach. However, recent advances in TOF technology, including the use of orthogonal ion extraction and ion reflectrons (where ions experience a reflection from one or more electrostatic mirrors before detection), have significantly increased their resolution. Currently, TOF instruments are available that can provide resolutions of >10,000 and average mass accuracies of 2-5 ppm (although not over as broad of a range of intensities as with FTICR). A recent study in our laboratory evaluated the utility of LC-TOF-MS for use with the AMT tag approach (Strittmatter, et al., 2003).
Software/Image Generation
Deisotoping
Proteomic analysis of just one organism may include hundreds to thousands of LC-MS analyses, with each dataset containing thousands of mass spectra. The large volumes of LC-MS data, often encompassing many datasets, must be processed to extract the useful information from the raw data files (generally a series of mass spectra) produced by the MS analyzer.
The first step in our current proteomics data analysis pipeline involves reducing the MS raw data to a form compatible with downstream analysis algorithms. In the case of LC-MS data, the raw spectra are analyzed and converted to tables of masses and spectrum number (or elution times) that represent individual species detected in each spectrum. In the case of LC-MS/MS analyses, the raw MS/MS fragmentation spectra are used to search databases of possible peptide sequences (e.g., using SEQUEST) and generate tentative peptide identifications. For LC-MS experiments performed with high performance FTICR (and TOF) mass spectrometers, a single experiment will typically produce on the order of a 10 GB raw data file. Analysis of this raw data file results in a table of detected masses on the order of 10 MB, a three order of magnitude reduction in file size. Spectra can be processed to detect isotopic distributions and determine the monoisotopic masses of the species present. A single spectrum can contain hundreds of species and a single LC-MS experiment will typically result in 10,000 to 100,000 isotopic distributions, each providing a monoisotopic mass and elution time. The data reduction step for LC-MS/MS datasets is much less significant; a typical LC-MS/MS dataset using ion trap mass spectrometers is ∼20 MB, while the peak list files of predicted peptides typically range from 1 to 5 MB.
The process of converting isotopic distributions to tables of masses is referred to as deisotoping or mass transformation. This process is performed by in-house developed software called ICR-2LS that utilizes an approach based on the THRASH algorithm (Horn, et al., 2000). The mass transform steps are:
Pick the most abundant peak in the spectrum.
Perform an autocorrelation calculation near the most abundant peak. This calculation allows the charge state to be predicted by looking at the frequency of the surrounding peaks.
Use the charge state from step 2 and the m/z value for the most abundant peak to calculate an approximate molecular weight of the distribution.
Use the approximate mass from step 3 to predict an average molecular formula for a peptide using the Averagine algorithm (Senko, et al., 1995), assuming a typical molecular formula of C4.938 H7.758 N1.358 O1.477 S0.0417.
Use the molecular formula from step 4 to calculate a theoretical isotopic distribution using the Mercury algorithm (Rockwood, et al., 1995).
Compare the theoretical isotopic distribution from step 5 with the experimental data and calculate an isotopic fit value. This fit value is the least square error between the theoretical data and the experimental data.
Choose the charge state that gives the lowest (best) isotopic fit value, which is assumed to be the correct charge state for the peak.
This process is repeated until every isotopic distribution in a spectrum (above a given noise threshold) is processed and reduced to an entry in a table of detected masses.
A complex spectrum can contain hundreds of isotopic distributions, similar to those shown in Figure 3. A typical spectrum is described by a data vector that contains 200,000 points and calibration information specific to the instrument. Once the spectrum is processed and the peak information extracted, a table of detected masses is produced. This table contains the masses of the detected species, their intensities, and quality information. This information is then used in later stages of the proteomics data analysis pipeline.
Figure 3.
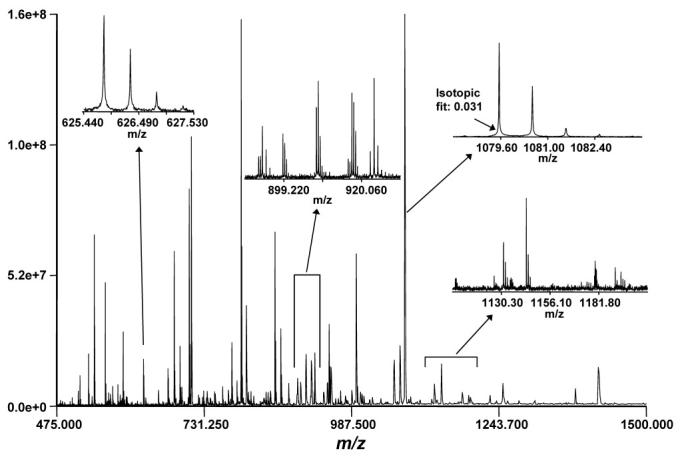
Typical mass spectrum and isotopic distributions for a global soluble yeast tryptic digest analyzed by LC-FTICR-MS. Reprinted in part with permission from Shen, et al., 2001a. Copyright 2001 American Chemical Society.
For comparative studies, the peak finding algorithm has been enhanced to allow distinctive isotopic signatures to be detected. For example, a comparative analysis of mixtures of peptides from organisms grown on normal media and isotopically enriched media can be analyzed and the type of isotopic distribution identified. Figure 4 exemplifies an isotopic distribution for a peptide from the analysis of a sample prepared by mixing cells from an organism cultured in normal media and in 15N enriched, isotopically labeled media. ICR-2LS software identifies the 15N-labeled distribution by using an isotopic distribution simulation algorithm to generate both the labeled and unlabeled distributions and then determining the best fit to the experimental data. The relative abundances of the labeled and unlabeled peptides are determined by analyzing the MS signal intensities across the LC peak. This information is stored in the resultant data tables, which eliminates or reduces the need to access the raw MS data in the next level of data analysis.
Figure 4.
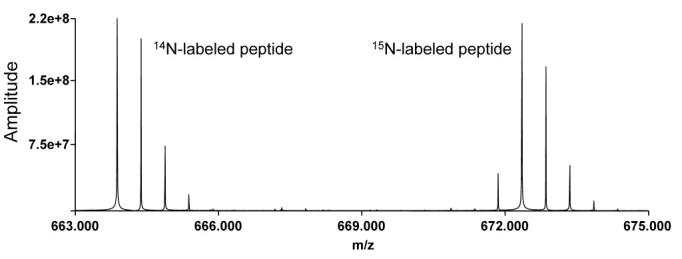
Isotopic distribution of a peptide from a proteome analysis of an organism grown on normal (14N) media (left distribution) and a distribution for the same peptide grown on 15N isotopically labeled media (right).
Peak detection
After the mass spectra for a given analysis have been reduced to tables of monoisotopic masses, the masses are processed by another in-house developed software package called VIPER. This software processes each analysis in an automated fashion to 1) load and filter the data, 2) find features, 3) regress the observed elution times with the normalized elution times of the PMT tags, 4) further refine the mass calibration, 5) match the features to the PMT/AMT tags, 6) export the results to a database, and 7) generate initial 2D plots and chromatograms for data evaluation.
In step 1 above, the data points are filtered on the basis of the standard m/z, monoisotopic mass and charge state ranges for the given instrument, in addition to the quality of isotopic distribution fit value (i.e., deisotoping quality factor). Such filtering helps to remove noise peaks from the data and excludes tentative assignments with mass or charge values that lie outside the expected range for the instrument. A typical 2D plot of such filtered data involves the spectrum number on the horizontal axis (corresponding to elution time) and monoisotopic mass on the vertical axis (Figure 5). The color of the data points indicates the charge state determined for the peptide peak. For example, a mass spectral peak observed at 989.43 m/z and determined to have a 3+ charge would be represented as a green dot on the 2D plot, with a monoisotopic mass of 2965.28 Da.
Figure 5.
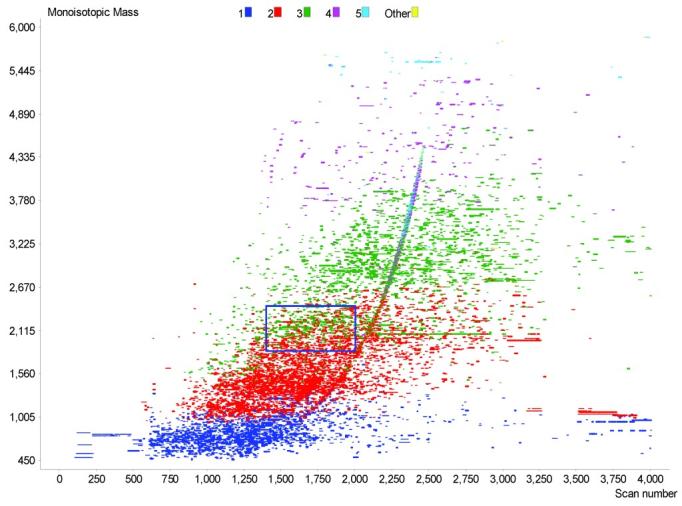
Two-dimensional plot of filtered data from a single LC-FTICR-MS analysis. The region within the blue box is shown in Figure 6.
Another form of data reduction is then applied, which involves finding and grouping sets of mass spectral peaks that are observed in sequential spectra (with a user defined number of possible gaps) and that are assumed to originate from the same peptide (or other compound) as it elutes from the LC column in a chromatographic peak. These features are found by examining the data in a 2D fashion using a data clustering algorithm to look for groups of related data. This algorithm identifies mass spectral peaks with similar monoisotopic masses, elution times, intensities, etc. by computing a Euclidean distance in n-dimensional space for combinations of peaks. Each grouping distilled from this process, termed a unique mass class (UMC), has a median mass, central NET, and an abundance estimate that is presently computed simply by summing the intensities of the MS peaks that comprise the UMC. These sets of UMCs can then be used to search PMT/AMT tag databases for matching peptides, to compare features between related datasets (without the use of a database), and to compare features within a dataset. The effectiveness of this step is substantially determined by the overall alignment (i.e., how the elution times are normalized) and whether intra-run warping of the separation is applied.
Figure 5 can be used to exemplify the data reduction process applied to the features in a single LC-FTICR-MS analysis. If a minimum of two spectra are required by the filtering criteria to constitute a UMC, then the 126,982 detected monoisotopic masses displayed in this figure are reduced to 11,267 UMCs (different putative peptides). Figure 6 provides a zoomed-in view of these data and shows 810 UMCs that were detected from species that had charge states of 2+, 3+, or 4+. Since these detected features have been de-isotoped and converted to neutral monoisotopic masses, an individual UMC can contain data from different charge states; however, the median mass, central NET, and overall abundance for the UMC are presently computed only by using information from the predominant charge state. Figure 7 illustrates three distinctly evident UMCs in close proximity to one another. Each small spot represents a species that was detected in a single mass spectrum, and the three boxes represent the observations that were clustered into each UMC. Note, the first and second UMCs are separated by 13 ppm in mass and 0.004 NET units, while the second and third UMCs are separated by 53 ppm, but have a smaller NET difference of 0.002 NET units. The inset, which plots abundance vs. time for the three UMCs, shows that the use of high resolution liquid chromatography and FTICR-MS can easily distinguish the three UMCs.
Figure 6.
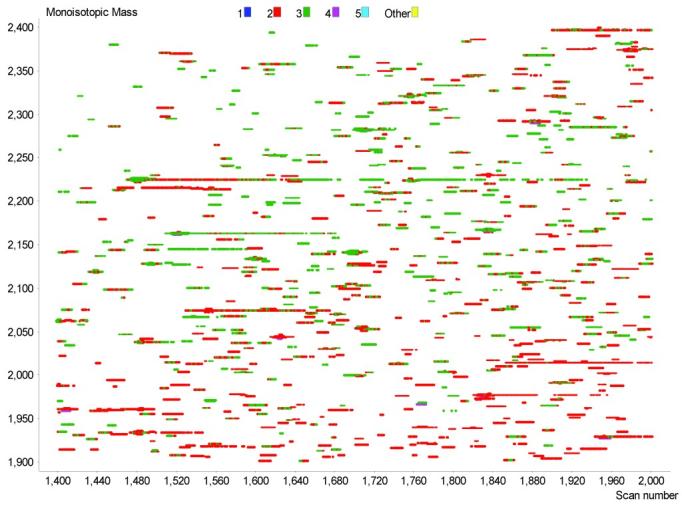
Zoomed region of the two-dimensional mass and time plot in Figure 5.
Figure 7.
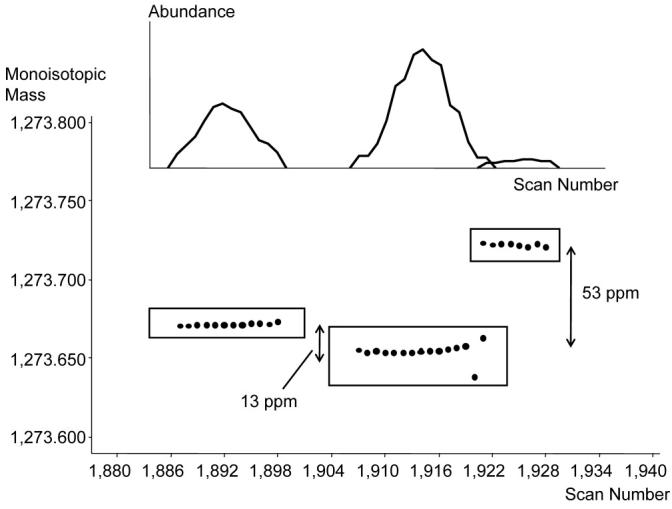
Detailed view showing the groupings of observations for three distinct UMCs and their corresponding abundance peaks (top).
Once features have been located, the mapping between the observed elution times (scan numbers) and NET values for PMT/AMT tags can be determined. This step is accomplished by assigning an initial estimate to the mapping, and then matching the mass and NET of the high abundance features (top 20%) against the set of mass and NET values for the existing high confidence PMT/AMT tags. A wide tolerance of ±0.2 NET is initially used since the first mapping is only an approximation. After finding the gross matching features, the UMC scan numbers are regressed against the NET values of the PMT/AMT tags to improve alignment of the given dataset. This procedure is repeated, using the newly determined mapping with progressively narrower NET tolerances until it converges on the optimum mapping. An example of a result obtained by this process is shown in Figure 8, which displays the 771 high abundance UMCs that matched PMT/AMT tags, and includes both the scan numbers and NET values on the horizontal axis.
Figure 8.
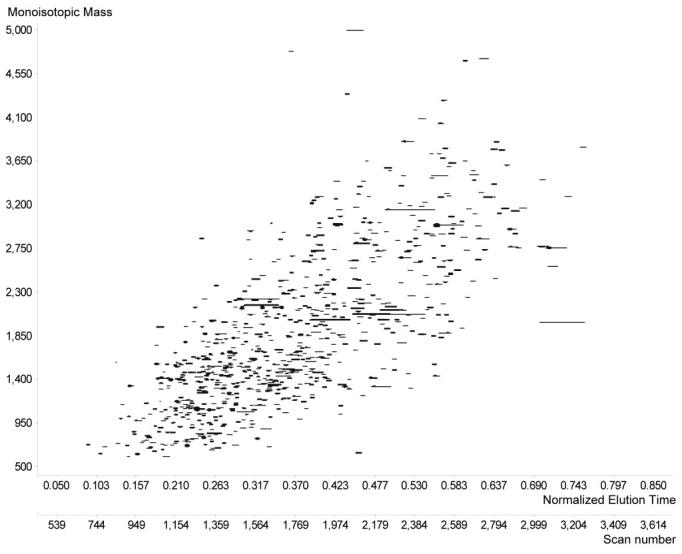
2D plot of the UMCs from an LC-MS analysis used for NET alignment.
Peak matching and UMC assignment
The process of matching UMCs to PMT/AMT tags in the database is in concept relatively straightforward, since one need only compare the mass and NET of each UMC to the mass and NET of each PMT or AMT tag within a given tolerance to arrive at an assignment. However, making such assignments reliably and establishing a measure as to the confidence of the assignments presents challenges. Figure 9 illustrates the process for assigning a UMC to two different, but potentially matching PMT tags. The UMC is represented by the cluster of small spots (that arise from detected species in the set of mass spectra that contribute to the UMC), while each PMT tag is represented by a larger spot surrounded by an ellipse that represents the maximum uncertainty for the mass and NET of the measurements. When a detected UMC can potentially be assigned to two or more PMT tags (as is illustrated here), the best match can be determined on the basis of the mass and NET deviations. For this purpose, an algorithm has been developed that utilizes the standardized squared distance between a given UMC's mass and NET and each PMT tag's mass and NET to estimate the uniqueness of the match (Anderson, et al., 2004, Norbeck, et al., 2005). The distances are weighted by the variance in mass and time for each PMT tag and are used to compute a conditional probability of the likelihood that the given PMT tag is a unique match to a given UMC. In Figure 9, PMT tag 41608 is much closer in both mass and NET than PMT tag 3346197 and was assigned a conditional probability of 0.95.
Figure 9.
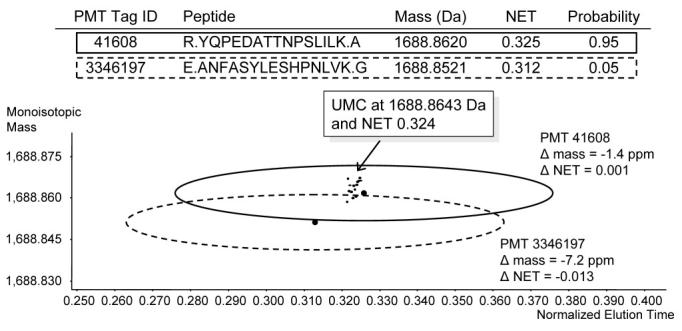
Detailed visualization of a case where a detected species (UMC) could match with two PMT tags within ±6 ppm and ±0.05 NET. Final column indicates the estimated conditional probability of uniqueness for each PMT tag.
Given the large number of UMCs typically observed during analysis of complex proteomics samples, the set of mass errors associated with the assignment of identified UMCs to matching PMT tags is computed, and this information is then utilized to refine the mass calibration for the data. This step is accomplished by computing the mass errors for each measurement that contributes to a given UMC. The mass errors are binned to a resolution of 0.5 ppm and a histogram is plotted to generate an overall mass error plot for the analysis. During automated data processing, the peak center is located by using the centroid of the mass error histogram, and the masses of all of the data points are then corrected (by applying a ppm shift). Because the peak in the mass error plot can sometimes exceed 6 ppm for very low or very high abundance species, a wider tolerance of ±25 ppm and ±0.1 NET is typically used in the initial search to identify UMCs. After the mass error plot is created, the mass calibration is refined as needed, and the search is repeated with the tighter mass and NET tolerances.
The UMCs and matching PMT/AMT tags for each analyzed dataset are exported to a database that stores all of the results. Queries can then be applied to summarize the results for replicate analyses and to export the list of UMCs and/or identified peptides for further informatics analyses and characterization. During automated analysis, several 2D plots and chromatograms are created to show the data before and after filtering, and before and after searching the database. These plots can be used to gauge sample complexity, the fraction of UMCs identified, and the overall quality of the analysis. Additionally, these 2D plots can reveal the presence of contaminants such as surfactants or polymers (exemplified in Figure 5 by the curved sets of spots in scans 1,250 to 2500 from mass 500 to 4,500 Da).
LC elution time normalization
To better combine and interpret data from multiple LC-MS analyses, it is important to effectively group the same peptides or UMCs from separate LC-MS analyses. However, the elution time of the peptides from one analysis is generally somewhat distorted or shifted in comparison to the retention time for the same peptides in another analysis. This distortion can be more significant when a different chromatographic column is used for each analysis, but can often be observed between analyses on the same column as a result of variations in flow rate and temperature, differences in the packing of the chromatographic columns, etc.
The problem of peptide absolute elution time variability can be addressed either by using software algorithms to compensate for the shifts (as in warping, which is described below) or by improving the reproducibility of the LC system itself. One of the major factors that impacts variability is the lack of temperature control for capillary LC columns (Chen, et al., 2003, Snyder, 1979, Zhu, et al., 1996a, Zhu, et al., 1996b); however, capillary LC/MS experiments are rarely carried out under constant temperature conditions (Hancock, 2003). Studies indicate that ionic or ionizable compound retention times can fluctuate as much as 1-2% per 1°C (Hancock, et al., 1994). More importantly, this temperature effect varies from compound to compound, resulting in unexpected selectivity changes (relative elution times), which are very difficult to correct using software algorithms.
In our laboratory, software algorithms are used, where possible, to compensate for the elution time shifts between chromatograms. This compensation may entail a non-linear warping of the data that can compensate for small changes, e.g., flow rate fluctuations, during a separation. At its simplest this process can consist of aligning two LC-MS datasets by stretching or compressing the time axis of one of the datasets in a linear fashion to allow for better matching of retention times between analyses. More advanced approaches involve aligning the datasets by stretching the time axis then “fine tuning” the mass and time locations of individual features in the two datasets to obtain optimal overlap. This process takes advantage of the fact that relative peptide elution times are generally maintained between analyses. Thus, to align two LC-MS chromatograms, the analyses are first broken down into smaller segments and then the similarity between subsections is compared to uncover retention time shifts between the two analyses. Another approach to dynamic warping was demonstrated by both Neilson, et al. and Bylund, et al., who aligned chromatograms from different analyses based on similarity between chromatographic peak shapes (Bylund, et al., 2002, Nielsen, et al., 1998). An alternative to this approach would be to spike the sample with a known digested protein and use the identified peptides of the known protein as “lockers” for LC alignment. Recently, another approach to warping was demonstrated (Listgarten & Emili, 2005) that used a variation on the Hidden Markov Model.
Intensity normalization
There are several different data analysis paradigms that researchers typically apply to evaluate peptide abundances for quantitative proteomics studies. One is to first survey all of the peptides present in a sample, looking for the presence or absence of peptides, and thus proteins, and then compare peptide abundances as measured by the ion currents at the MS detector. Although an abundance estimate can be obtained for each UMC, either by summing the intensities of the data points for a particular UMC or by using the abundance of the most intense peak within the UMC, it can be difficult to compare different peptide abundances due to widely differing ionization efficiencies and the presence of possible ion suppression effects when numerous compounds of relatively high abundance are co-eluting. For these reasons, comparisons of the relative abundances of different peptides (or proteins) in the same sample are generally less accurate than comparisons of the same peptide (or protein) in different samples.
The conditions under which ionization suppression will occur are relatively well understood and are most problematic in cases where both analyte concentrations and ESI flow rates are high. Larger flow rates result in greater compound-to-compound variations due to the effective analyte competition for both charge and proximity to the electrospray droplet surface. However, at sufficiently low flow rates, biases decrease or disappear as ionization efficiencies approach 100% (Wilm & Mann, 1994). Thus, at low flow rates ESI can be used to effectively study highly hydrophilic compound classes (e.g., oligosaccharides) that are conventionally problematic for ESI-MS due to low surface activity (Schmidt, et al., 2003, Wilm & Mann, 1996). The flow rate at which ionization efficiencies approach 100% can be abrupt (Schmidt, et al., 2003) and is dependent on several factors, including analyte concentration. With smaller inner diameter capillary columns, ESI-MS peak intensities (or LC peak areas) will generally increase linearly with abundance, becoming nonlinear above a certain threshold as shown in Figure 10 (Shen, et al., 2002). For sample sizes below a given level, MS peak intensities (or peak areas) are generally in the regime where signals increase linearly with sample size and thus provide the best quantitation.
Figure 10.
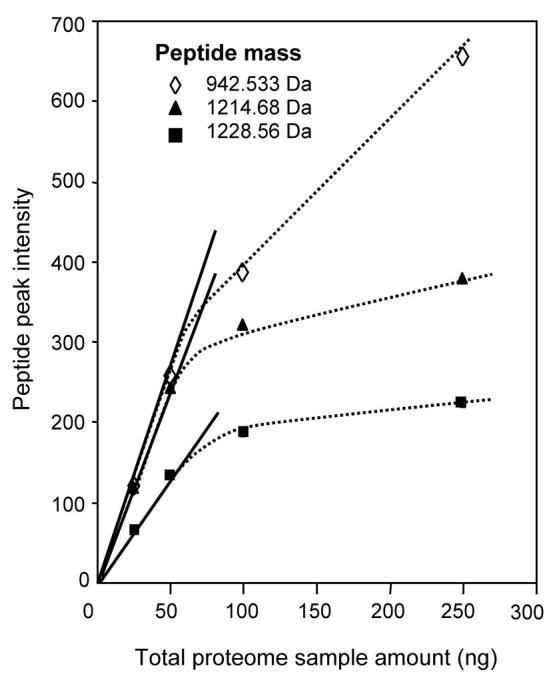
ESI-MS peak intensities vs. the total proteome sample size for three high-abundance peptides in a tryptic digest of a yeast cell lysate. The results were obtained using a 30-μm-i.d. packed capillary (∼80 nL/min flow rate). For sample sizes below a given level, MS peak intensities increase in a linear fashion with sample size (solid line); above this level, suppression effects are evident. Reprinted with permission from Shen, et al., 2002. Copyright 2002 American Chemical Society.
Although peptide abundances can be compared between samples because the same peptide sequence will typically ionize with a similar efficiency, it is useful to normalize sample intensities since co-eluting species can introduce suppression effects. The simplest form of normalization is to find peptides common to both samples and then plot the intensity of one vs. the intensity of the other. Assuming the majority of the peptides in common remain unchanged, the slope of the line will represent the correction factor to apply to the second sample. Following normalization, the ratio of the observed intensity for each peptide can be computed, and the ratios for peptides belonging to the same protein can be averaged to obtain a measure of protein change. Figure 11 illustrates this approach for two S. oneidensis samples. Peptide intensities observed in one condition are plotted against the peptide intensities observed in the second condition. A linear fit with a slope of 0.907 suggests that the abundances in the second condition should be multiplied by 1.103 to normalize them to the abundances in the first condition. While the distribution indicates that there are substantial variations in relative peptide abundances between samples, replicate analyses would be required to evaluate experimental contributions and to enable the development of an error model to estimate the significance of the observed variation (i.e., the likelihood that the observation is real).
Figure 11.
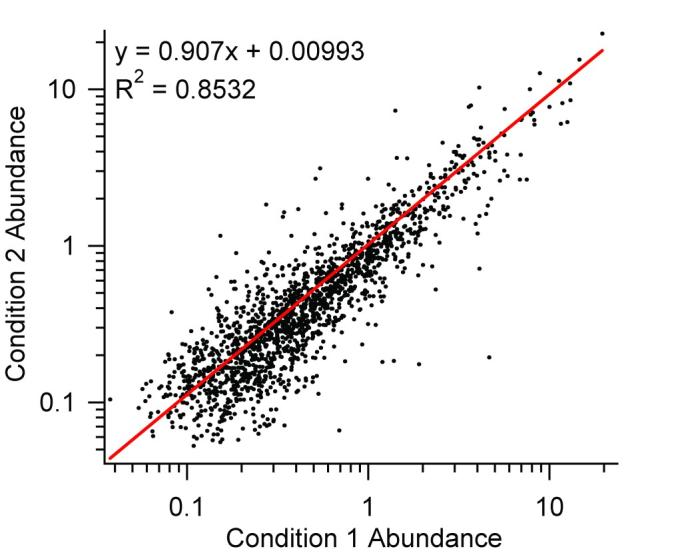
Comparison of peptide absolute abundance values for two S. oneidensis samples from two biological conditions. Logarithmic scales have been used to better illustrate the data at lower peptide abundances.
Sample Preparation and Quantitative Proteome Measurements
Protein concentrations in cells, tissues, and biological fluids are dynamic and can be quickly altered upon physiological or environmental perturbations. As a result, one of the goals of proteomics is to be able to quantify these dynamic changes in protein concentrations and correlate them to cellular responses to gain insight into biological processes. A related important application of quantitative proteomics is to identify disease biomarkers that might facilitate early diagnosis of human diseases, including cancers. While significant advances have improved ESI efficiency (Smith, et al., 2004), ESI-MS-based label free quantitative proteomics approaches still face challenges associated with suppression effects that impact ESI efficiency. An alternative is to use the AMT tag approach combined with stable isotope labeling methods and LC-FTICRMS, which is well-suited for high throughput and precise quantitative measurements of relative protein abundances over a wide variety of conditions (Qian, et al., 2004, Smith, et al., 2002).
A variety of chemical, enzymatic, and metabolic labeling techniques that utilize stable isotopes have been developed to facilitate relative quantitation for comparative analysis of proteome samples from different biological states (Adam, et al., 2002, Goshe & Smith, 2003, Qian, et al., 2004). A number of these different stable isotope labeling techniques for quantifying protein abundances and post-translational modifications have already been extensively reviewed (Goshe & Smith, 2003, Sechi & Oda, 2003, Tao & Aebersold, 2003). In the following section, we discuss more recent advances in quantitative proteomics measurements achieved by using stable isotope labeling techniques and LC-FTICR-MS.
Solid Phase Isotope-Coded Affinity Tag (SPICAT)
Isotope-coded affinity tag (ICAT) is one of the most widely applied labeling techniques in quantitative proteomic studies. ICAT employs an isotopically distinct region flanked by iodoacetamide and biotin functionalities that allow for modification and extraction of the reduced Cys-containing peptides (Cys-peptides) by immobilized avidin chromatography (Gygi, et al., 1999). The first generation ICAT reagents caused tagged peptide pairs to differentially elute (due to the deuterium labeling effect), which resulted in variable ionization efficiencies for the two peptides, thereby affecting quantitation (Zhang & Regnier, 2002). New versions of cleavable ICAT reagents have been developed to resolve the retention time issue and to reduce the tag size (Hansen, et al., 2003, Li, et al., 2003, Yu, et al., 2004); however, limitations associated with avidin affinity enrichment still exist. The residual non-specifically bound peptides from the affinity matrix and the reduced sample recovery stemming from irreversible binding of a sub-population of the biotinylated peptides limit the overall sensitivity and peptide identification efficiency of the ICAT approach. Although highly sensitive separation and detection capabilities now enable analysis of nanograms of total proteome samples (Shen, et al., 2004), quantitative analysis of micro-scale proteome samples using the ICAT approach remains challenging due to significant sample loss during sample processing.
To circumvent the sensitivity limitation, a solid phase isotope-coded affinity tag (SPICAT) approach was recently reported by Aebersold and coworkers in the context of a new version of the ICAT technique (Zhou, et al., 2002). Figure 12 shows the sulfhydryl-reactive solid-phase isotope-coded reagent. In the original report, the leucine moiety on the reagent contained either seven hydrogen or seven deuterium atoms for light or heavy labeling, respectively. More recent work in our laboratory has focused on reducing the chromatographic effect of the deuterium labeling. To this end, six 13C and one 15N were incorporated into the leucine moiety (Qian, et al., 2003), which enables better quantitation than can be obtained with the deuterium-coded reagent (Zhang & Regnier, 2002). In the SPICAT approach, two different protein samples are first digested into peptides, and then the Cys-containing peptides are covalently captured on solid-phase beads in two separate columns; one contains light isotope-coded tags and the other, heavy isotope-coded tags (Figure 13). The beads from the two columns are then combined and washed to remove non-Cys-containing peptides. Next, the captured Cys-containing peptides are released by exposure to UV light (360 nm). The recovered peptides are analyzed by LC-MS for peptide identification and quantitation of relative abundance.
Figure 12.
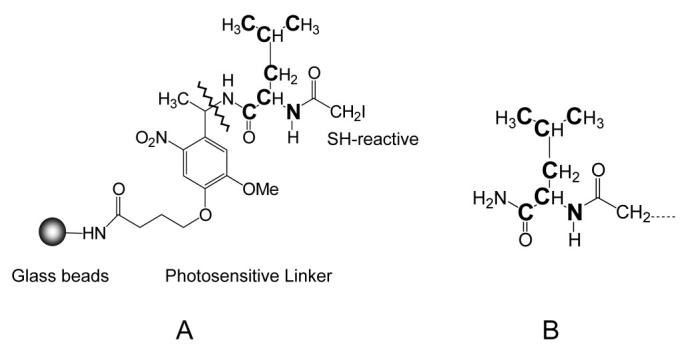
(A) A sulfhydryl-reactive solid phase isotope-coded reagent. Aminopropyl-beads were covalently linked with a photosensitive linker, a stable isotope-coded leucine residue, and a sulfhydryl reactive group. For the heavy isotope version, the leucine residue contains six 13C and one 15N as indicated by the bold letters in the structures. The photosensitive linker can be cleaved by UV (365 nm) illumination (the line indicates the cleavage site). (B) The isotope-coded label attached to a sulfhydryl group in cysteinylpeptides after photocleavage. The light and heavy isotope-coded labels have a mass difference of 7.017 Da.
Figure 13.

SPICAT labeling strategy for enrichment and relative quantitation of Cys-containing peptides from two different protein samples.
The SPICAT approach offers several advantages over the biotinylation and avidin affinity purification strategy of the original ICAT approach. First, labeling and isolation of peptides is achieved in a single step; high efficiency labeling is achieved even in the presence of denaturants or detergents. This single step results in much less sample handling and a concomitant increase in the sensitivity of the labeling method, a quality that is clearly essential for application of such labeling methods to extremely small samples. Additionally, covalent capture of peptides by solid-phase beads allows the use of stringent wash conditions, which enables non-covalently bound molecules (e.g., non Cys-containing peptides) to be removed. Finally, the use of 13C and 15N instead of deuterium in the solid-phase reagent leads to minimal isotopic effect in the chromatographic separation (Zhang & Regnier, 2002), and consequently allows better quantitation since both components are equally affected by any ionization suppression.
The SPICAT approach combined with FTICR-MS demonstrated efficient processing and analysis of global cell lysates from both large scale and micro-scale (low μg level) samples from human breast cell line MCF7. For the large scale sample preparation, two 50-μg quantities of MCF7 proteins were labeled; typically, ∼20 μg of labeled peptides were recovered from 100 μg of starting material. Sample analysis using LC-FTICR-MS (coupled to a smaller 50 μm i.d. capillary LC column for injection of 300 ng peptides) resulted in 1,053 labeled Cys-containing peptide pairs. For the micro-scale sample preparation, two cellular lysate samples of 5,000 MCF-7 cells were used for labeling. Immobilized trypsin (Applied Biosystems) was used to digest proteins after confirming its efficiency was similar to the Promega trypsin. The use of immobilized trypsin is advantageous for micro-scale sample processing in that a large excess of the immobilized enzyme can be used to ensure complete proteolysis, and the trypsin can be easily removed afterward to avoid extra trypsin autolysis products. In addition, 1 μg of a “carrier” protein, performic acid oxidized bovine serum albumin (BSA), was added to each MCF7 protein sample to reduce protein losses due to surface adsorption. Since performic acid oxidized BSA does not contain any reactive cysteine residues, essentially all peptides originating from the carrier protein can be easily removed during the wash step. Approximately 20 ng of the recovered Cys-containing peptide sample (5% of the recovered peptides) was injected onto a 15 μm i.d. capillary separation column for analysis by LC-FTICR-MS with DREAMS (Dynamic Range Enhancement Applied to MS) technology (described below). The results from this analysis are shown in Figure 14, which includes (A) the total ion chromatogram reconstructed from the DREAMS set of spectra obtained during the LC separation, (B) a corresponding partial 2D plots showing only the isotopically labeled peptide pairs, and (C) an illustrative peptide pair that was identified using the AMT tag strategy. A total of 861 unique peptide pairs were observed from this particular LC-FTICR-MS analysis. The >800 pairs observed from the starting sample of ∼2 μg total protein demonstrates that the combination of SPICAT and high sensitivity LC-FTICR-MS can be used to successfulyl process and analyze Cys-containing polypeptides from micro-scale sized samples (1 μg of protein or 5,000 mammalian cells).
Figure 14.
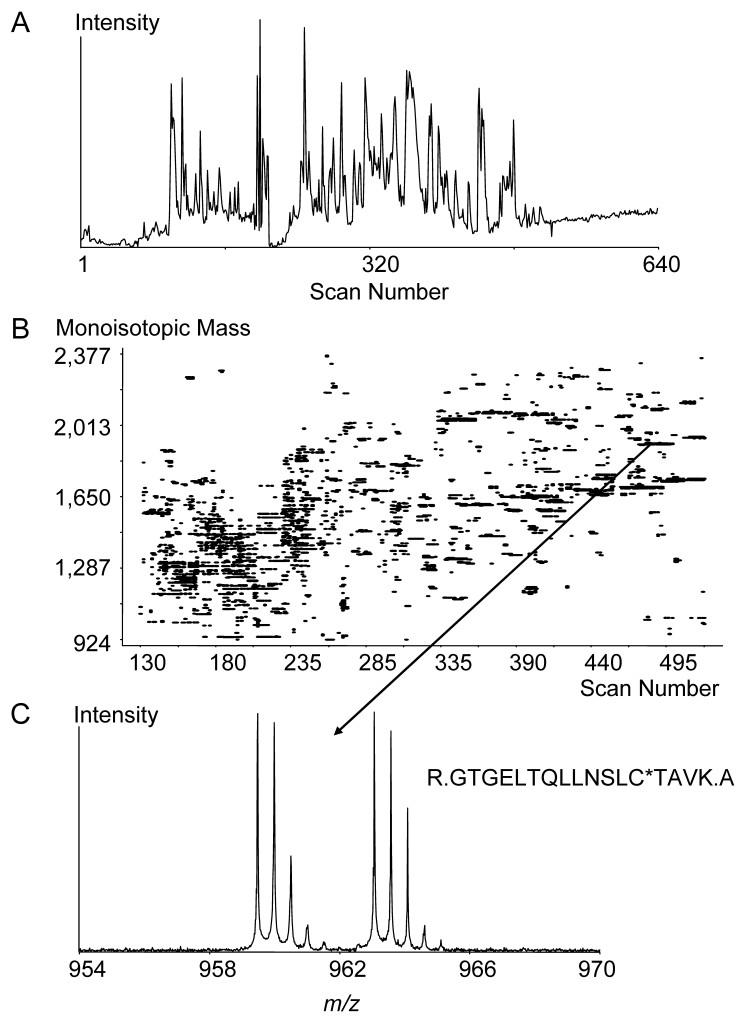
LC-FTICR-MS analysis of a tryptically digested SPICAT-labeled cell lysate from 10,000 mammary epithelial MCF7 cells: (A) Total ion chromatogram reconstructed from the DREAMS set of spectra. (B) Corresponding 2D plot. (C) An illustrative peptide pair.
Post-digestion Trypsin-Catalyzed 16O/18O Labeling
Another increasingly applied stable isotope labeling method involves the trypsincatalyzed enzymatic transfer of 18O from water to the C-termini of peptides (Yao, et al., 2001). This technique can be used to globally label all tryptic peptides for comparing relative peptide/protein abundances. In this approach, proteins from paired samples are subjected to a tryptic digest in either H216O or H218O. The oxygen atom (either 16O or 18O) from water is incorporated into the newly formed C-terminus of each tryptic peptide, thus providing an isotope tag for MS-based relative quantitation. One advantage of using this enzymatic 18O labeling approach is that all types of samples, including tissues, cells, and biological fluids, can be effectively labeled. In addition, the enzymatically catalyzed reaction is simple and specific for the C-terminus of tryptic peptides, while both light and heavy isotope-coded peptides in a pair will elute at roughly the same chromatographic time. A limitation of this technique is that the labeling efficiency during proteolytic digestion is not the same for all peptides, which leads to incorporation of two 18O atoms per peptide for some peptides and only one 18O per peptide for others (Stewart, et al., 2001). This inconsistency in labeling efficiency complicates relative quantitation of the peptide pairs.
Recently this situation has been successfully addressed by using a post-digestion 18O labeling strategy based on a trypsin-catalyzed oxygen exchange reaction (Heller, et al., 2003, Liu, et al., 2004, Yao, et al., 2003). In this post-digestion strategy, proteins isolated from paired samples are initially digested separately in normal water. After digestion, the resulting two peptide samples are incubated in either H216O or H218O and the C-termini of the peptides are consequently labeled with either 16O or 18O via a trypsin-catalyzed oxygen exchange reaction. With the trypsin-catalyzed 16O/18O post-digestion strategy, >97% of tryptic peptides were observed labeled with two 18O atoms (Liu, et al., 2004, Qian, et al., 2005b). The mass difference between the 16O and 18O labeled tryptic peptides (with the incorporation of two 18O atoms) is 4.0085 Da. Analysis benefits from the use of a high resolution mass analyzer (e.g., TOF or FTICR) to effectively resolve the 16O and 18O labeled peptide pair peaks and to provide the data necessary for deconvoluting isotopic distributions, as is needed to quantify the 16O/18O labeled peptide pairs.
Quantitative Cysteinyl-Peptide Enrichment Technology (QCET)
We recently developed a novel quantitative cysteine-peptide enrichment technology (QCET) that allows for systematic identification and quantification of proteins expressed in mammalian cells in a high throughput manner (Liu, et al., 2004). A powerful alternative to the widely-used ICAT method (Gygi, et al., 1999), this technology can be readily extended to rapid proteome-wide measurements of changes in protein abundance. QCET combines post-digestion trypsin-catalyzed 16O/18O labeling with a novel cysteinyl-peptide enrichment approach, utilizing the AMT tag strategy to effectively analyze the cysteine-subproteome in complex tissue samples (Figure 15A). Proteins from two cell states or conditions are separately digested by trypsin under identical conditions. The tryptic peptides from both samples are subsequently labeled with either 16O or 18O by immobilized-trypsin, and the differentially labeled peptide samples are combined. Cys-peptides are selectively captured on a thiol-specific affinity resin (Figure 15B) and then released by incubating the resin with a low molecular weight thiol. The enriched Cyspeptides are identified and quantified using the AMT tag approach.
Figure 15.
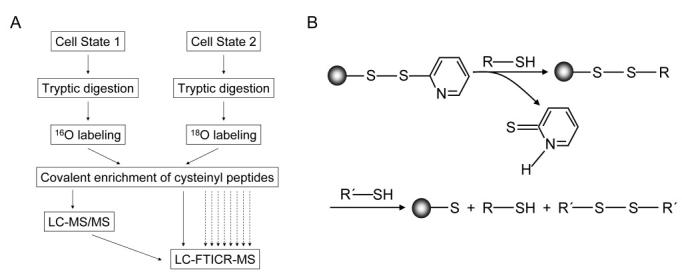
(A) Strategy for quantitation of differential protein expression, illustrating the throughput advantage of the LC-FTICR-MS measurements. (B) Reaction scheme for covalent capture of a cysteinyl peptide (R-SH) on Thiopropyl Sepharose 6B. R'-SH represents a low molecular weight thiol such as DTT. Reprinted with permission from Liu, et al., 2004. Copyright 2004 American Chemical Society.
QCET was initially applied to study the protein abundance differences of human mammary epithelial (HMEC) cells following phorbol 12-myristate 13-acetate (PMA) treatment. An HMEC Cys-peptide PMT tag database was created from the cysteinyl-peptide enriched peptides; 3 mg cell lysate samples were fractionated by SCX and analyzed by capillary LCMS/MS. This database contained 6,222 identified peptides (covering 3,052 different proteins), and >90% of all peptides identified contained Cys residues. To compare the relative protein abundances between the control and PMA-treated cell samples, 100 μg of total protein from each sample was digested, labeled, and combined for Cys-peptide enrichment, after which the resulting peptide sample was analyzed by LC-FTICR-MS. A total of 1,348 labeled peptide pairs were observed in a single analysis, with most peptide pairs clearly showing a 4 Da mass difference as illustrated in Figure 16A, which shows a partial 2D plot of the 16O/18O labeled peptide pairs. Among these pairs, 935 pairs were identified as unique AMT tags, corresponding to 603 unique proteins. Figure 16B shows three examples of pairs and their corresponding abundance ratios (ARs). QCET is advantageous in that the high-efficiency Cys-peptide enrichment step significantly reduces the overall sample complexity and makes the AMT tag approach effective for applications to complex mammalian proteome samples.
Figure 16.
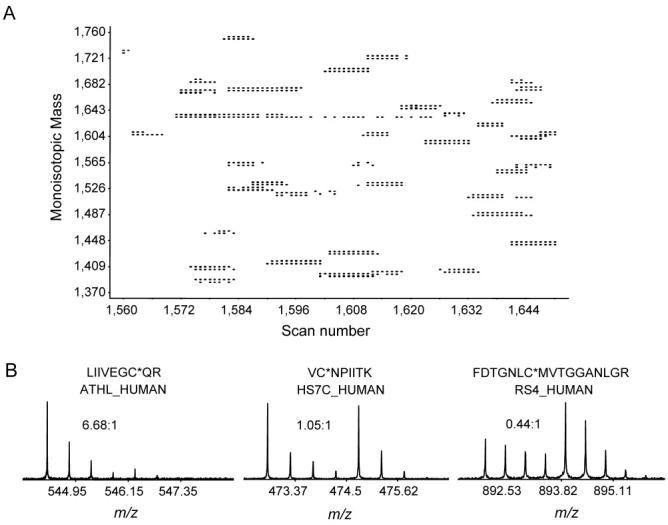
(A) A partial 2D plot showing 16O/18O labeled Cys-peptide pairs enriched by QCET. (B) Three examples of peptide pairs with their sequences, corresponding proteins, and the 16O/18O ratios.
Phosphoprotein Isotope-Coded Solid-Phase Tag (PhIST) Approach
We have also developed approaches for the quantitative study of protein phosphorylation (Goshe, et al., 2001, Qian, et al., 2003). Protein phosphorylation is probably one of the most important and common classes of post-translational modifications and plays an essential role in the regulation of a variety of cellular processes such as signal transduction, gene expression, cell cycling, peptide hormone response, and apoptosis (Cohen, 1982, Pawson & Scott, 1997). An initial phosphoprotein isotope-coded affinity tag (PhIAT) approach was developed on the basis of beta-elimination chemistry and enrichment using avidin affinity chromatography to isolate and quantify phosphopeptides from protein mixtures. However, the limitation of this approach turned out to be similar to that of ICAT, i.e., non-specific binding and sample loss encountered during the avidin affinity chromatography purification step, which limits the overall sensitivity of the PhIAT approach. A more sensitive and robust approach — the phosphoprotein isotope-coded solid-phase tag (PhIST) approach for quantitative analysis of phosphopeptide from complex mixtures — was developed to overcome this limitation (Qian, et al., 2003). Instead of using a biotin affinity tag, peptides containing the ethane-1,2-dithiol moiety were captured and labeled in one step using isotope-coded solid-phase reagents that contained either light (12C6, 14N) or heavy (13C6, 15N) stable isotopes (Figure 17). The captured peptides (labeled with the isotope-coded tags) were released from the solid-phase support by UV photocleavage and analyzed by capillary LC-MS/MS. Similar to SPICAT, the incorporation of solid-phase labeling leads to less sample handling and >25 fold improvement in sensitivity over PhIAT, as well as improved efficiency for isolating and analyzing phosphopeptides (Qian, et al., 2003). Figure 18 shows a portion of the results from an LC-FTICR-MS analysis of 50 ng of recovered peptides from PhIST-labeled casein protein mixtures. Approximately 100 labeled peptide pairs are shown in the 2D plot, which likely includes both labeled phosphopeptides and glycopeptides. The two pairs shown in Figure 18B represent a highly abundant peptide (from β-casein; left) and a much less abundant peptide (from αs1-casein; right). An abundance ratio (AR) of approximately 1.0 was observed, as expected for the 1:1 heavy:light, PhIST mixture, which reflects the utility of this approach for precise quantitation. Despite the efficient labeling and enrichment exhibited by the PhIST approach for relatively simple protein mixtures, only limited success was achieved when PhIST was applied to global cellular lysates. The issues are believed to arise from the reactivity of additional sample components. As a result, further developments are required before this approach can be widely applied for proteome-wide analysis of phosphopeptides.
Figure 17.
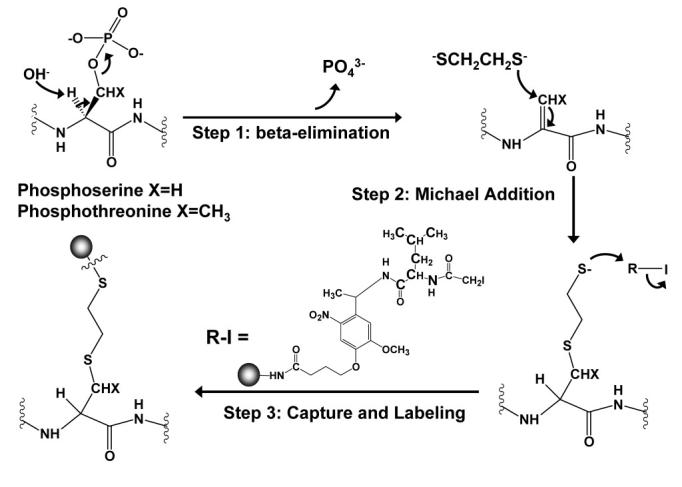
Schematic depicting the phosphoprotein isotope-coded solid-phase tag (PhIST) approach. Proteins containing phosphoseryl or phosphothreonyl residues are derived by β-elimination and ethane-1,2-dithiol addition. After proteolytic digestion, modified phosphopeptides are captured and labeled by isotope-coded solid phase reagents.
Figure 18.
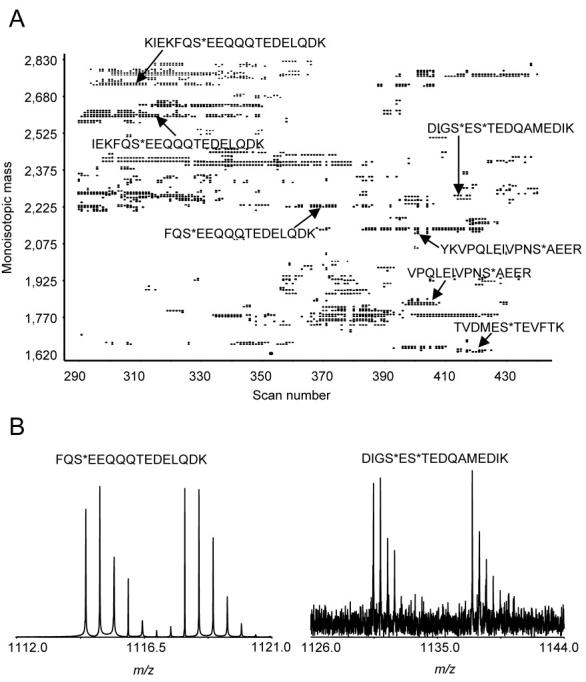
LC-FTICR-MS analysis of 50 ng of PhIST labeled phosphopeptides from β-casein: (A) Partial 2D plot. The sequences indicated for selected pairs were determined by matching the mass and elution time to the peptides identified by MS/MS. (B) Selected mass spectra of labeled phosphopeptide pairs with indicated sequences. * indicates where the residue is phosphorylated.
Quantitation Directly Based on MS Peak Intensities
Label-free quantitation directly based on MS peak intensity information is attractive because multiple samples from different conditions can be compared without having to use stable isotope labeling methods. However, current peptide abundance measurements obtained from MS peak intensities can vary significantly due to variations in instrumental performance, variations in ionization efficiencies during electrospray, etc. While more readily useful for determining large differences in abundances between samples, peak intensity measurements have often been less effective for studying more subtle variations. Our more recent studies indicate that proper control of the sample processing and analysis conditions (e.g., for ESI) can yield intensities that are highly reproducible between analyses, providing a solid a basis for quantitation. Other recent reports have also described the use of peptide peak intensity information for determining changes in relative protein abundances using various normalization techniques (Bondarenko, et al., 2002, Chelius & Bondarenko, 2002).
The feasibility of using quantitative approaches based on intensity data requires reproducible measurements among different sample analyses. We observed that the run-to-run reproducibility of proteome analyses improved dramatically with implementation of a fully automated capillary LC-FTICR-MS platform (Belov, et al., 2004). An example of the excellent reproducibility obtained with this automated platform is illustrated in Figure 19, which shows the variation in peptide intensities obtained from six replicate analyses of the same S. oneidensis proteome sample. The average coefficient of variance is ∼10% for the highest abundance peptides and increases to ∼40% for low abundance peptides. These results are consistent with several other reports. (Bondarenko, et al., 2002, Chelius & Bondarenko, 2002) However, this type of approach is still challenged by the matrix-dependent ESI “suppression” effects that can arise due to the presence of solution matrix components or to peptides eluting at the same point in the separation. Such suppression effects make determining changes in abundance, as well as determining the relative abundances of different peptides, problematic since the extent of suppression is expected to be highly dependent on the precise solution composition. To address this issue, analyses should ideally be conducted under conditions where ionization suppression effects are minimized. As noted earlier, ESI efficiency can be significantly improved when low flow rates, low concentrations, and small inner diameter capillary columns are applied. These chromatographic conditions can both minimize ionization suppression and eliminate background ions that originate from the solvent, which is consistent with earlier work by Wilm and Mann (Wilm & Mann, 1994, Wilm & Mann, 1996).
Figure 19.
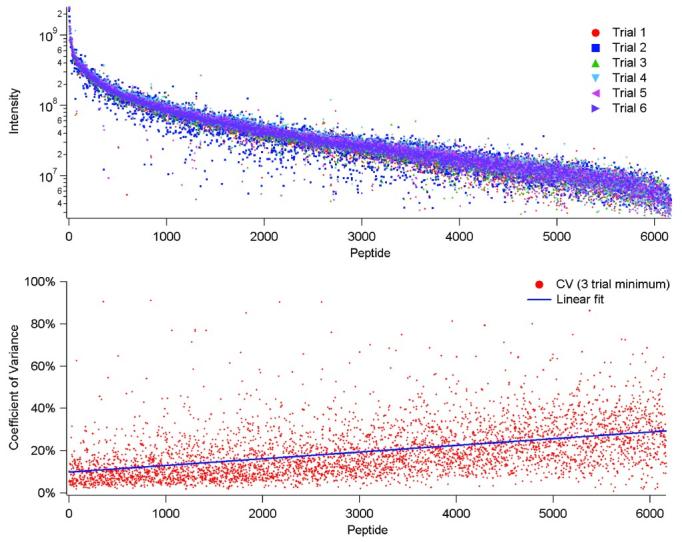
Reproducibility of absolute abundance values for mass and time tags identified in six replicate capillary LC-FTICR-MS analyses of a S. oneidensis tryptically digested proteome sample. The upper plot compares the intensity values seen for each identified AMT tag across the six replicates while the lower plot represents the coefficient of variance in intensity across the replicates.
Advanced Methods
The large dynamic range and complexity observed for the proteomes of biological organisms presents a challenge for mass spectrometric analysis. The most abundant species within a sample dominate the mass spectra and effectively suppress the signals of the less abundant species. This ionization suppression effect can be largely eliminated by miniaturization of ESI sources and LC columns, e.g., decreasing column inner diameters of >100 μm and flow rates of >200 nL/min to inner diameters of ≤15 μm and flow rates of ≤20 nL/min (Wilm & Mann, 1994, Wilm & Mann, 1996). While eliminating ionization suppression removes a hurdle in the path of MS-based proteomic studies, there is still a crucial need for high sensitivity detection since many important proteins are present at low copy numbers within a biological sample. A variety of different methods for increasing the overall sensitivity and dynamic range of LC-FTICR-MS analyses have been developed in our laboratory. The simultaneous implementation of the techniques described in the following sections potentially allows for an increase in the detectable dynamic range to greater than 107.
Dynamic Range Enhancement Applied to Mass Spectrometry (DREAMS)
The large variation among protein relative abundances that have potential biological significance in mammalian systems (possibly >9 orders of magnitude and even greater in some sample types, e.g., plasma) presents a major challenge for proteomics. While FTICR-MS has a demonstrated capability for ultra-sensitive characterization of biopolymers (e.g., achieving subattomole detection limits) (Belov, et al., 2000a, Valaskovic, et al., 1996), the maximum dynamic range for a single mass spectrum (without the use of spectrum averaging or summation) is typically constrained to about 103. An important factor that has conventionally limited achievable FTICR-MS sensitivity and dynamic range is the maximum charge capacity of either the external ion accumulation device or the FTICR mass analyzer itself. Prolonged ion accumulation is helpful during the LC elution of low-abundance components (e.g., during the “valleys” in chromatograms) and potentially allows build up of ion populations to levels where measurable signals can be obtained for otherwise undetectable species, thereby increasing the effective overall dynamic range of proteome measurements. Unfortunately, “overfilling” of external multipole ion traps by high-abundance species often results in a biased accumulation process in which parts of the m/z range are selectively retained or lost (Belov, et al., 2001c) and/or extensive ion activation and dissociation can occur before sufficient populations of low level species can be accumulated (Sannes-Lowery, et al., 1998, Tolmachev, et al., 2000).
One strategy for increasing the dynamic range of FTICR-MS detection methods is to remove the most highly abundant ions “on the fly.” This FTICR technique, referred to as DREAMS (Dynamic Range Enhancement Applied to Mass Spectrometry) (Belov, et al., 2001a, Harkewicz, et al., 2002), allows the use of longer accumulation times for species present in low abundance by eliminating the most highly abundant species during the ion accumulation process. This technique selectively removes the major species in a linear quadrupole device located external to the FTICR ion trap so that only the lower abundance species are accumulated in the FTICR cell, thus better exploiting the dynamic range of FTICR-MS. Initial evaluation of the DREAMS technique showed that the DREAMS approach provided a significant gain in coverage of proteomic measurements. DREAMS was first utilized to characterize a global yeast proteome tryptic digest (Belov, et al., 2001a) by acquiring a dataset that alternated between selective and non-selective ion accumulations. This dataset was compared to one from an analysis that was acquired by using only the standard non-selective ion accumulation method. The number of peptides detected with the DREAMS method (30,771) was about 35% higher than the number of peptides acquired using non-selective ion accumulation (22,664).
More recently, DREAMS was implemented in combination with high performance capillary LC-FTICR mass spectrometry to examine a global tryptic digest of 14N- and 15N-labeled peptides from mouse B16 cells, initially mixed in approximately a 1:1 ratio (Paša-Tolić, et al., 2002). For illustration, two chromatograms are reconstructed in Figure 20 (A & B, left) from the normal and DREAMS spectra from each analysis. The dynamic range enhancement capability of DREAMS becomes clear by examining one point in a capillary LC separation. Note, the normal spectrum (Figure 20A, middle) is dominated by a number of major peptide ions, most prominently three pairs of 14N/15N-labeled peptides in the 500<m/z<700 range. The information from this spectrum was used “on the fly” to remove these species during ion accumulation for the next spectrum. As a result, the most abundant species were ejected prior to accumulation, and the next FTICR spectrum was dominated by a much different set of species (Figure 20B, middle). As a single example selected from many similar cases, the inset right shows that the signal-to-noise ratio (S/N) for a peptide pair at m/z ∼1,000 is greatly improved from a level at which no effective identification could be obtained to a level at which a very precise peptide relative AR could be determined for the peptide pair; the gain in S/N was ∼50. In these analyses, a total of 9,896 14N/15N-labeled peptide pairs could be confidently assigned from the normal spectra. The average AR for the peptide pairs was 1.05 (0.28 standard deviation), which is only a slight deviation for the nominal expected value of 1.0. The second set of DREAMS spectra provided 8,856 14N/15N-labeled peptide pairs, of which 7,917 were peptide pairs not detected in the normal spectra. The average AR for peptides detected in the DREAMS spectra was 1.015 (0.31 standard deviation). (It should be noted that any isotope effect due to the 15N can also contribute to the measured standard deviation.) These results indicate that the number of peptides with high precision relative abundances of peptide pairs was increased by ∼80% using DREAMS.
Figure 20.
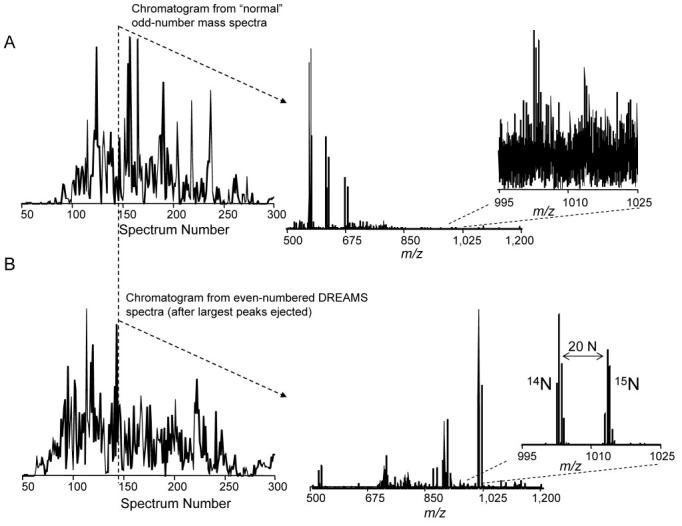
Total ion chromatograms (TIC) for capillary LC-FTICR-MS analyses, along with typical mass spectra acquired (A) during the “normal” spectrum acquisition process and (B) the alternating DREAMS spectrum acquisition process for the analysis of peptides from a mixture of natural isotopic abundance and 15N-labeled mouse B16 cells. (A, left) TIC reconstructed from the normal FTICR mass spectra. (B, left) corresponding TIC obtained using DREAMS for which species having relative abundances >10% were ejected before ion accumulation. The mass spectra (A&B, center) show the effective ejection of the major species in the top spectrum from the one shown on the bottom. The detail (A&B, right) shows that a large gain in sensitivity and S/N is obtained for measurement of a specific peptide pair providing improved qualitative and quantitative results from the overall analysis. Reprinted by permission of Elsevier from Paša-Tolić, et al., 2002. Copyright 2002, by the American Society for Mass Spectrometry.
Targeted (data-directed) LC-MS/MS
Proteome analyses of clinical samples are often limited by available sample sizes; methods that focus on identification of key features are clearly attractive. Thus, a method is desired that focuses on identifying a limited subset of proteins that display significant changes in abundance ratios between two small tissue samples, analogous to selective MS analysis of spots from 2D gels that show significant changes between two gels.
We recently developed hardware and corresponding software tools for targeted LC-FTICR-MS proteome analysis to allow a set of initially unidentified peptides to be examined on the basis of their distinctive changes in abundance between two stable-isotopically labeled samples. Initially, two differentially labeled samples are analyzed by LC-FTICR-MS. Identified features (UMCs) that exhibit significant differences in MS intensities in the first analysis are characterized on the basis of both elution time and mass. This information is then used in a subsequent automated analysis where these “interesting” peptides are selected for MS/MS analysis. Thus, the identities of the flagged UMCs can be determined without having to identify every feature by MS/MS. In turn, peptides identified on the basis of their distinctive peptide sequence uniquely identify their parent proteins.
This process was recently exemplified by using targeted MS/MS method to identify S. oneidensis proteins that were differentially abundant as a result of growth under aerobic vs. suboxic conditions (Masselon, et al., 2005). Following an initial LC-FTICR-MS experiment, UMCs were generated and paired, and their ARs were calculated. UMCs were considered “interesting” if they had an AR that was significantly different from 1.0, based on the statistics of the AR distributions. This determination resulted in a list of 164 species that were targeted for identification in a second experiment. The 2D plot of the results from this targeted LC-MS/MS study comparing S. oneidensis in aerobic and sub-oxic conditions revealed 9,048 UMCs in the MS dataset, which was filtered so that only the 1,503 heavy/light labeled pairs were displayed (Figure 21). Among these pairs, 164 exhibited an AR significantly different from 1.0 based on the AR distribution statistics (i.e., AR<0.4 and AR>2.4); these pairs were incorporated in the MS/MS attention list. During the actual targeted MS/MS analysis, 125 species were selected for dissociation. Insets in Figure 21 show one pair of UMCs from a targeted peptide and the corresponding MS/MS spectrum obtained in a subsequent analysis that identified a peptide associated with the fumarate reductase flavoprotein subunit precursor (ORF #SO0970). The expression of this protein, identified with 8 peptides (each observed 1 to 3 times), was shown to increase under sub-oxic growth conditions (Giometti, et al., 2003). The observed increase in abundance for this protein has been previously reported, which supports the application of this approach to effectively target differentially abundant species.
Figure 21.
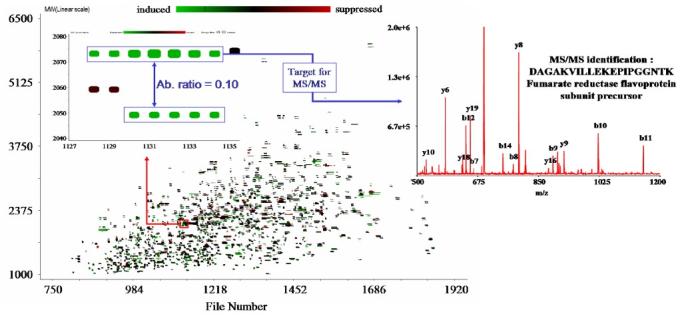
2D plot representing UMC pairs from the initial LC-FTICR-MS dataset obtained from a mixture of 14N/15N labeled proteins from S. oneidensis grown under aerobic and sub-oxic conditions. Insets show a differentially abundant peptide pair and the corresponding MS/MS spectrum obtained in the subsequent targeted data-directed analysis. Reprinted with permission from Masselon, et al., 2005. Copyright 2005 American Chemical Society.
Multiplexed MS/MS
Multiplexed MS/MS analysis provides a mechanism for faster and, thus, more sensitive proteomic measurements. With this technique, simultaneous dissociation of up to 10 peptides is performed, which can significantly increase the throughput of peptide identifications. When 10 peptides are simultaneously dissociated, approximately 89% of the species can potentially yield unambiguous identification, which would correspond to an increase in throughput of ∼9 times compared to conventional MS/MS. Studies have revealed that complex peptide mixtures can be simultaneously dissociated and proteins identified (through a database search) using only three “y” or “b” fragment ions and a mass accuracy of 2.5 to 5 ppm (Masselon, et al., 2003). In an initial demonstration of this technique combined with online nano-LC, both a protein from the SWISS-PROT database and proteins from a complex bacterial proteome sample were identified (Li, et al., 2001). The ability to identify peptides using continuous multiplexed-MS/MS analysis during capillary LC separations is illustrated in Figure 22. In this example, the four most abundant peptides in the MS spectrum were simultaneously dissociated, leading to successful identification of each parent ion. When further coupled with DREAMS capability, abundance ratio-directed multiplexed LC-FTICR-MS/MS analysis could potentially reveal low-abundance proteins that are crucial for cellular response to certain perturbations (e.g., generally low-abundant transcription factors known to be associated with almost all human cancers).
Figure 22.

Example of a capillary LC-FTICR multiplexed-MS/MS analysis of Cys-PEO labeled polypeptides isolated from mouse astrocytes giving the identified peptide sequences. (A) Reconstructed capillary LC-FTICR-MS chromatogram. (B) The ESI mass spectrum for the indicated peak. (C) Data-dependent multiplexed-MS/MS spectrum for the four most abundant species in the preceding MS spectrum (2) obtained after SWIFT isolation and sustained off-resonance irradiation - collisionally induced dissociation (SORI-CID).
Nanoscale Proteomics
Proteomics-based biomedical research is increasingly looking for ways to analyze proteins from extremely small amounts of sample, such as from 1,000 human blood cells. The sensitivity and dynamic range of proteomics analyses are particularly important when absolute sample size is constrained. To address these needs, we recently developed nano-separations and analysis capabilities that enable protein identifications from nanogram-sized complex biological samples (Shen, et al., 2003, Shen, et al., 2004). These capabilities include an on-line micro solid-phase extraction device to maximize peptide recovery and a 15 μm i.d. packed capillary LC for high separation efficiency (20 nL/min, 10,000 psi) that is coupled to an FTICR (using a 5 μm ESI emitter). This platform was recently used to identify proteins from samples that ranged from 50 ng down to 0.50 pg total protein (orders of magnitude smaller than the total amount of proteins predicted for 1,000 blood cells). Figure 23 shows peptide pairs detected from a 5 pg sample composed of 15N- and 14N-labeled D. radiodurans, which led to the identification of a significant number of proteins. The sensitivity and extremely low sample consumption was enabled as a result of the coordinated use of new and recent developments related to sample injection, the use of a small inner diameter capillary LC column, an electrodynamic ion funnel ESI interface, and sensitive FTICR-MS analysis and detection technologies.
Figure 23.
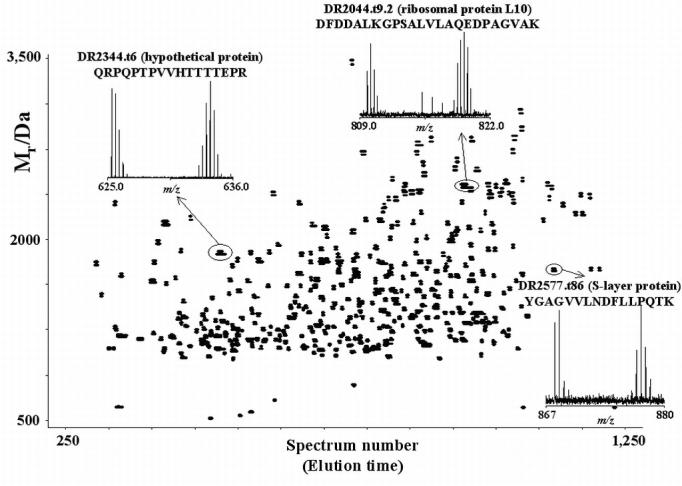
Example of the ultra-sensitive detection capabilities being developed based upon nano-scale LC-FTICR-MS using the AMT tag approach. The 2D plot of detected peptide pairs also shows spectral regions for three of the peptide pairs used for quantitation, the assigned sequence using AMT tags, and the parent protein with the ORF designation (e.g., DR2577) followed by a designation of the number of the tryptic fragment from the N terminus (.t6) and an indication of the number of missed cleavage sites for the detected peptide (e.g., DR2044.t9.2; middle peptide pair). Details: a mixture of identical aliquots of natural isotopic abundance and 15N-labeled versions of D. radiodurans were analyzed using high-pressure capillary LC (85 cm × 15 μm id × 3 μm C18, 10,000 psi) with an 11.4 tesla FTICR-MS. The analysis consumed a total of 10 pg total protein (5 picogram total of a tryptic digest for each isotopically labeled sample) and resulted in detection of the 629 peptide pairs shown. Of these, 158 peptide pairs were confidently assigned, providing coverage of 79 ORFs.
Applications
Microbial Proteomes
The initial demonstration of the AMT tag technique, which was performed using the small, radiation resistant, prokaryotic organism Deinococcus radiodurans under a number of culture conditions (Lipton, et al., 2002), resulted in detection of 20,000 to 60,000 peptides. Interestingly, this bacterium has the extraordinary ability to withstand 50 to 100 more times ionizing radiation than Escherichia coli. D. radiodurans has a ∼3.1 Mbase genome that annotations predict codes for 3,187 proteins (White, et al., 1999). In this study, 6,997 different peptides were confidently identified by the AMT tag approach (Lipton, et al., 2002). Over the past several years, D. radiodurans has served as a model system for developing our proteomics capability; these efforts have culminated in a robust database of PMT tags for this bacterium. The database includes confirmed expression of 2,650 of the 3,116 predicted open reading frames (ORFs), most of which have assigned housekeeping functions. Importantly, over 80% of the hypothetical and conserved hypothetical proteins were also identified. Continued studies with D. radiodurans have examined whether its ability to resist radiation is dependent on culture condition, growth state, or other perturbations (Schmid, et al., 2005, Venkateswaran, et al., 2000).
More recently, the AMT tag approach was used in a comparative study of protein expression profiles for S. oneidensis MR1 under aerobic and suboxic conditions. S. oneidensis MR-1 is a Gram-negative, facultative anaerobe and a respiratory generalist (Venkateswaran, et al., 1999) that can oxidize organic compounds or H2. The bacterium uses solid phase metals such as Fe(III) or Mn(III,IV) oxides as electron acceptors to gain energy for maintenance and growth. As a dissimilatory metal reducing bacterium, S. oneidensis can also reduce relatively soluble and mobile contaminants, including Tc(VII), U(VI), and Cr(VI), to lower oxidation states that are much less soluble and therefore less mobile in the environment.
S. oneidensis MR-1 contains two genetic elements within the organism: a chromosome that contains 4,468 potential ORFs and a plasmid that contains 173 potential ORFs. In global studies that utilized the AMT tag approach, 85% of the predicted chromosomal proteins were identified along with 65% of those from the plasmid (two AMT tags per protein were required to determine expression). Many of the proteins associated with housekeeping functions in S. oneidensis were identified, as were all of the proteins associated with central intermediary metabolism, nucleotide synthesis, and signal transduction. These studies have contributed to the validation of many hypothetical proteins, and in some cases, hint toward their function (Kolker, et al., 2005).
Mammalian Proteomes
The high throughput AMT tag approach combined with subcellular fractionation and automated multiple dimensional separations has been applied for comprehensive mammalian proteome profiling. Typically, cellular lysates are subjected to subcellular fractionation followed by tryptic digestion of each fraction. The resulting peptides are then fractionated by SCX, the peptide fractions analyzed by LC-MS/MS, and the spectra analyzed by SEQUEST. Prior to SCX fractionation, cysteine-containing peptides in the tryptic digest of cellular lysates can be specifically enriched using high efficiency Cys-peptide enrichment to further improve the proteome coverage (Liu, et al., 2005). To date, several mammalian proteomes have been profiled, including HMEC (Jacobs, et al., 2004, Liu, et al., 2005), hepatocyte HCV replicon model system Huh-7.5 cells (Jacobs, et al., 2005), and human blood plasma (Qian, et al., 2005a, Shen, et al., 2004). For the HMEC proteome, a combination of Cys-peptide enrichment and global approaches enabled confident identification of >25,000 unique peptides that corresponded to >6,700 distinct proteins, which is ∼17% coverage of the human proteome. In studies of Huh-7.5 cells, >24,000 unique peptides and >4,200 proteins were identified by coupling subcellular fractionation with multidimensional LC-MS/MS. We combined different depletion strategies with high resolution 2D-LC-MS/MS to obtain the dynamic range of detection needed for characterizing human blood plasma. Approximately 1,000 plasma proteins were confidently identified from plasma, and an additional 1,200 proteins were identified with moderate confidence (Qian, et al., 2005a, Shen, et al., 2004). All of these identifications were used to establish solid PMT tag databases for subsequent high throughput quantitative studies of these systems using the AMT tag approach.
For quantitative mammalian studies, our laboratory utilizes two complementary techniques—a post-digestion 16O/18O stable isotope labeling strategy and the QCET method—to improve overall proteome coverage. Currently, this strategy for quantifying differential protein abundances has been applied to a time course study to further quantitatively characterize the specific biological pathway for HMEC stimulation with Epidermal Growth Factor. Figure 16 shows an example of quantitative analysis of differential protein abundances for an HMEC sample using the QCET strategy (Liu, et al., 2004). Greater than 1,300 unique peptides were detected and >600 proteins were quantified from a single LC-FTICR-MS analysis. The combined 18O labeling-AMT tag strategy has also been applied as a global quantitative approach to study the difference between control and treated human blood plasma samples. Initial results included ∼500 plasma proteins identified and quantified along with a list of significantly different protein abundances that were observed among the control and treated plasma samples. Figure 24 shows a 2D plot of the 16O/18O labeled pairs from a single LC-FTICR-MS analysis of a plasma sample that included equal portions of the labeled control and treated plasma samples; ∼2,000 peptide pairs were detected. These results demonstrate the efficiency of using the complementary labeling techniques combined with the AMT tag strategy for quantifying proteins from highly complex mammalian proteomes.
Figure 24.
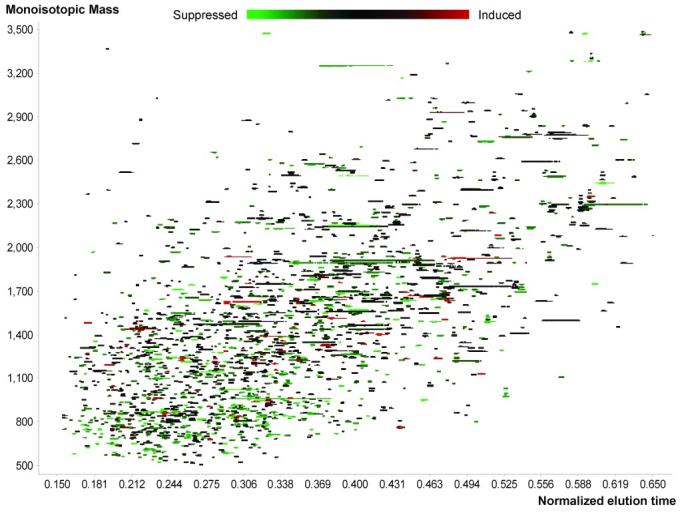
2D plot of 16O/18O labeled pairs observed from a single LC-FTICR-MS analysis of a labeled control vs. treated blood plasma sample.
We are also exploring the use of MS intensity for direct comparative analyses of protein concentrations. The high throughput AMT tag strategy and the direct use of MS intensity for quantitation is especially attractive for clinical biomarker discovery, because a large number of clinical tissue or fluid samples (such as human blood, urine, or nipple aspirates fluid) must be statistically analyzed to characterize a diseased condition. The LC-FTICR-MS platform offers both high sensitivity and large dynamic range, which are essential for detecting low abundance features. Figure 25 displays >6,500 unique features (UMCs) from both a liver biopsy tissue sample (Figure 25A) and human plasma sample (Figure 25B) that were analyzed with the high resolution LC-FTICR-MS platform. The human plasma sample was enriched for N-linked glycopeptides according to a previously published procedure (Zhang, et al., 2003). The ability to detect many thousands of unique features from micro-scale sized tissue samples or biological fluid samples in a single analysis offers significant potential not only for discovering novel disease biomarkers, but also for gaining a better understanding of disease processes.
Figure 25.
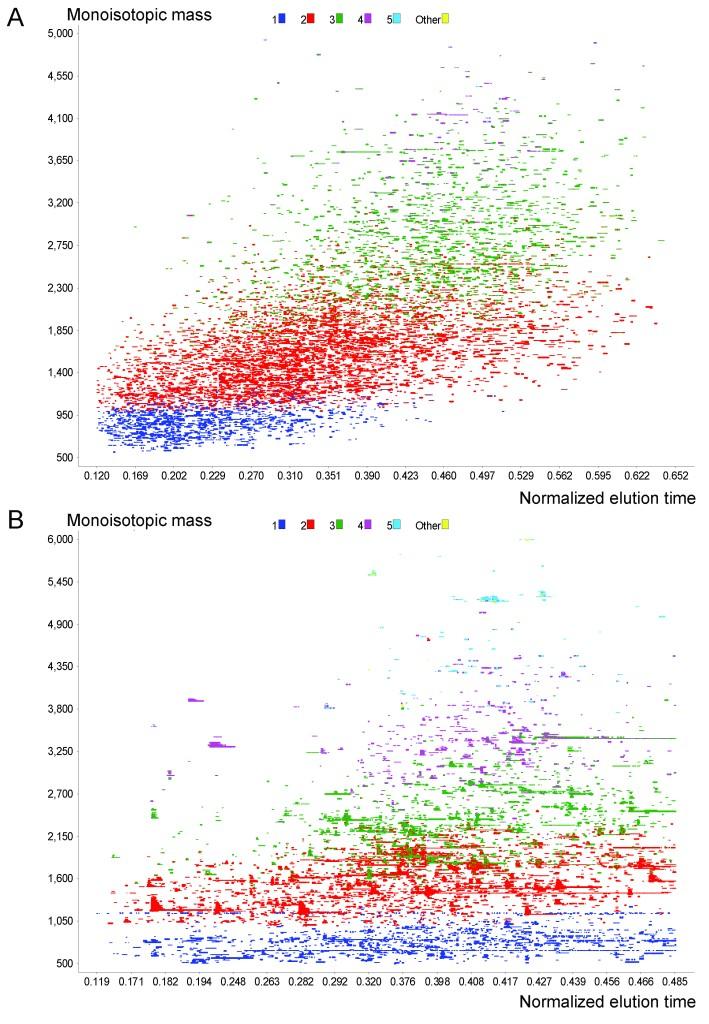
(A) 2D plot of ∼7000 unique features detected from a single LC-FTICR-MS analysis of a microgram size human liver biopsy sample. (B) 2D plot of ∼5500 unique features (UMCs) detected from LC-FTICR-MS analysis of an N-linked glycopeptide enriched human plasma sample.
Prospective
Utilization of the AMT Tag Approach
Several other laboratories have recently begun to adopt and/or adapt the AMT tag approach (Geromanos, et al., 2004, Johnson, et al., 2004, Kearney & Thibault, 2003, Li, et al., 2004, Radulovic, et al., 2004). In addition, Waters Corporation has recently implemented a process referred to as Ion Mapping that uses the accurate mass from a TOF mass spectrometer in conjunction with an accurate elution time to uniquely identity peaks, or features, within mass spectra. Features that appear significantly changed between two datasets are then targeted for MS/MS analysis. Another example is the work of Li et al. (2004) that lead to creation of the Pep3D program, which enables datasets to be compared on the basis of the retention time and mass of the features found within the analysis. Any features that are observed to be significantly changed can then be targeted for subsequent LC-MS/MS analysis, e.g., as described earlier in the context of data-directed analyses.
Increased Mass Measurement Accuracy (MMA)
High MMA is essential for successful application of the AMT tag approach to complex biological systems, such as mammalian systems and microbial communities. Currently, ∼30% peaks observed in an LC-FTICR-MS analysis of a mammalian proteome sample are not uniquely resolved by the AMT tag strategy, i.e., one peak matches multiple AMT tags. Once achieved, a routine MMA of 1 ppm will greatly improve the resolving power of the AMT tag approach. Initial work to increase the MMA involved the use of “lock masses” (i.e., confidently known species that serve as effective FTICR-MS internal calibrants) for each spectrum. More recently, improved methods for introducing calibrant ions into each spectrum have increased the overall MMA to ∼2 ppm (Flora, et al., 2001, Tang, et al., 2002). Improving upon these methods will lead to routine measurements of <1 ppm mass accuracy in a high throughput fashion.
Automated gain control (AGC) provides another important improvement in FTICR-MS performance that addresses the need for increased MMA. This capability for data-dependent adjustment of ion accumulation time during an LC separation maintains ion populations in the FTICR cell so as not to exceed a level that causes excessive space charge effects. AGC also helps eliminate m/z discrimination in the external ion trap and improves the MMA and/or the dynamic range of measurements (Belov, et al., 2003a, Belov, et al., 2003b). Recently, Thermo Electron Corporation has incorporated this AGC approach into their LTQ FT™ mass spectrometer.
Sample Multiplexing by Using Labeling Methods
One of the goals for quantitative proteomics is to be able to quantify protein abundances for many different conditions. The stable isotope labeling strategy typically results in a pair-wise comparison, which limits the overall throughput of the analysis when many different samples need to be compared. This limitation has led to the recent development of multiplex labeling methods such as the iTRAQ™ reagent from Applied Biosystems and i-PROT™ reagents from Agilix Corporation (New Haven, CT). Both types of reagents utilize multiple different isobaric tags and allow for simultaneous labeling of up to 4 different samples for the iTRAQ™ reagent (DeSouza, et al., 2005) and up to 7 different samples for the i-PROT™ reagent. With the use of these reagents, differential protein abundances from 4-7 different conditions can be compared from a single LC-MS/MS analysis. It should be noted, however, that the iTRAQ™ labeling approach requires MS/MS analysis and does not provide a significant benefit in conjunction with the AMT tag approach.
Top-down Proteomics with Intact Proteins
Another increasingly studied aspect of proteomics is proteome analysis at the intact protein level (“top-down” proteomics), where individual proteins are selected for analysis by MS, without the need for prior chemical or enzymatic proteolysis (Kelleher, et al., 1999, Lee, et al., 2002, Meng, et al., 2002). While the majority of proteomic strategies today employ peptide-based or so-called “bottom-up” identifications, intact protein analysis has the potential to characterize both site-specific amino acid mutations and coordinated post-translational modifications (PTMs) of individual proteins that are challenging to identify using the common peptide-level approaches. Several methods for intact protein analysis that utilize a high resolution FTICR-MS platform have been reported (Lee, et al., 2002, Meng, et al., 2002). For example, Meng et al. have described a top-down proteome characterization method that employs a 2D separation of intact proteins, followed by infrared multiphoton dissociation-MS/MS analysis using a tandem quadrupole-FTICR instrument. Another relatively new MS/MS technique is electron capture dissociation (ECD), which shows considerable promise for application to top-down proteomics (Zachara & Hart, 2002). Using FTICR and ECD-MS/MS, Ge et al. reported identification of numerous covalent and non-covalent modifications in proteins derived from E. coli (Ge, et al., 2002). The new development in electron transfer dissociation mass spectrometry may further accelerate the advance of top-down proteomics (Syka, et al., 2004).
Post-translational Modifications
Characterization of protein PTMs has presented a great analytical challenge due to the overall low abundance of these modified proteins within complex samples and the complexity of modifications. Among the many different types of PTMs, protein phosphorylation and glycosylation, which are involved in a variety of biological processes, are probably two of the most important and most common classes (Cohen, 1982, Pawson & Scott, 1997, Rudd, et al., 2001, Zachara & Hart, 2002). These two classes of PTMs are not observable at the transcriptome level, and consequently there has been considerable interest in developing proteomic techniques for selectively enriching and characterizing phosphorylated and glycosylated proteins. Several approaches have been developed to specifically enrich these proteins from complex protein mixtures, including the immobilized metal affinity chromatography (IMAC) approach (Andersson & Porath, 1986, Ficarro, et al., 2002), beta-elimination based approaches (Goshe, et al., 2001, Oda, et al., 2001, Qian, et al., 2003), and the N-linked glycopeptide enrichment method (Zhang, et al., 2003). The efficiency of these enrichment approaches for identifying and quantifying modified peptides is dependant on the reproducibility and specificity of the enrichments and the overall sensitivity of the enrichment when coupled with MS. Further developments are still needed to enable more comprehensive characterization of phosphorylation and glycosylation, as well as for quantitative measurements over different conditions.
Conclusion
Even though the field of systems biology, which includes proteomics and metabolomics, has seen rapid growth over the last few years, it is still in its relative infancy. Currently, the AMT tag approach, utilizing either LC-FTICR-MS or LC-TOF-MS, appears to be the most promising technique for large scale quantitative proteome analyses. The AMT tag approach combined with the capillary LC-FTICR-MS platform can produce very high resolution two-dimensional separations with both a large dynamic range (>106) and sensitivity in the zeptomole regime, while increasing throughput and providing the high mass measurement accuracies required for confident peptide identification, without the need for repetitive LC-MS/MS analyses. To date, we have applied this technique to the study of more than 20 different organisms. Future application of the AMT tag approach to the quantitative study of dynamic changes in protein concentrations will allow for a greater understanding of biological processes when these changes in protein concentrations are correlated to cellular responses. A very significant application of quantitative proteomics would be to identify disease biomarkers that will facilitate early diagnosis of human diseases, including cancers.
Acknowledgements
The contributions of Ljiljana Paša-Tolić, Mary Lipton, Gordon Anderson, Kim Hixson, Ronald Moore, Rui Zhao, Michael Belov, Christophe Masselon, David Anderson, Nikola Tolić, Gary Kiebel, Dave Clark, Ken Auberry, Yufeng Shen, Eric Strittmatter, Konstantinos Petritis, Lars Kangas, Rui Zhang, Bogdan Bogdanov, Seonghee Ahn, Jon Jacobs, Tao Liu, Michael Goshe, Tom Metz, Chris Sorensen, and Penny Colton to the work reviewed here are gratefully acknowledged. We thank the U.S. Department of Energy (DOE) Office of Biological and Environmental Research for long term research support and the FTICR technology development, as well as the National Institutes of Health, through the National Center for Research Resources (RR018522) for support of portions of the reviewed research. Our laboratories are located in the Environmental Molecular Sciences Laboratory, a national scientific user facility sponsored by the DOE and located at Pacific Northwest National Laboratory (PNNL). PNNL is operated by Battelle Memorial Institute for the DOE under Contract DE-AC05-76RL0 1830.
List of Abbreviations
- AMT Tag
Accurate Mass & Time Tag
- AGC
Automated Gain Control
- AR
Abundance Ratio
- DREAMS
Dynamic Range Enhancement Applied to Mass Spectrometry
- ICAT
Isotope-Coded Affinity Tag
- LC
Liquid Chromatography
- MMA
Mass Measurement Accuracy
- NET
Normalized Elution Time
- ORF
Open Reading Frame
- PhIAT
Phosphoprotein Isotope-Coded Affinity Tag
- PhIST
Phosphoprotein Isotope-Coded Solid-Phase Tag
- PMT Tag
Potential Mass and Time Tag
- PRISM
Proteomics Research Information Storage and Management System
- PTM
Post Translational Modification
- QCET
Quantitative Cysteinyl-Peptide Enrichment Technology
- SPICAT
Solid Phase Isotope-Coded Affinity Tag
- TMA
Time Measurement Accuracy
- UMC
Unique Mass Class
References
- Adam GC, Sorensen EJ, Cravatt BF. Chemical Strategies for Functional Proteomics. Molecular and Cellular Proteomics. 2002;1:781–790. doi: 10.1074/mcp.r200006-mcp200. [DOI] [PubMed] [Google Scholar]
- Aebersold R, Goodlett DR. Mass Spectrometry in Proteomics. Chemical Reviews. 2001;101:269–295. doi: 10.1021/cr990076h. [DOI] [PubMed] [Google Scholar]
- Aebersold R, Mann M. Mass Spectrometry-based Proteomics. Nature. 2003;422:198–207. doi: 10.1038/nature01511. [DOI] [PubMed] [Google Scholar]
- Anderson KK, Monroe ME, Daly DS. Estimating Probabilities of Peptide Assignments to LC-FTICR-MS Observations; Proceedings of the International Conference on Mathematics and Engineering Techniques in Medicine and Biological Sciences (METMBS); Las Vegas, NV. 2004. [Google Scholar]
- Andersson L, Porath J. Isolation of Phosphoproteins by Immobilized Metal (Fe3+) Affinity Chromatography. Analytical Biochemistry. 1986;154:250–254. doi: 10.1016/0003-2697(86)90523-3. [DOI] [PubMed] [Google Scholar]
- Belov ME, Gorshkov MV, Udseth HR, Anderson GA, Smith RD. Zeptomole-sensitivity Electrospray Ionization--Fourier Transform Ion Cyclotron Resonance Mass Spectrometry of Proteins. Analytical Chemistry. 2000a;72:2271–2279. doi: 10.1021/ac991360b. [DOI] [PubMed] [Google Scholar]
- Belov ME, Gorshkov MV, Udseth HR, Anderson GA, Tolmachev AV, Prior DC, Harkewicz R, Smith RD. Initial Implementation of an Electrodynamic Ion Funnel with FTICR Mass Spectrometry. Journal of the American Society for Mass Spectrometry. 2000b;11:19–23. doi: 10.1016/S1044-0305(99)00121-X. [DOI] [PubMed] [Google Scholar]
- Belov ME, Anderson GA, Angell NH, Shen Y, Tolić N, Udseth HR, Smith RD. Dynamic Range Expansion Applied to Mass Spectrometry Based on Data-Dependent Selective Ion Ejection in Capillary Liquid Chromatography Fourier Transform Ion Cyclotron Resonance for Enhanced Proteome Characterization. Analytical Chemistry. 2001a;73:5052–5060. doi: 10.1021/ac010733h. [DOI] [PubMed] [Google Scholar]
- Belov ME, Nikolaev EN, Anderson GA, Udseth HR, Conrads TP, Veenstra TD, Masselon CD, Gorshkov MV, Smith RD. Design and Performance of an ESI Interface for Selective External Ion Accumulation Coupled to a Fourier Transform Ion Cyclotron Resonance Mass Spectrometer. Analytical Chemistry. 2001b;73:253–261. doi: 10.1021/ac000633w. [DOI] [PubMed] [Google Scholar]
- Belov ME, Nikolaev EN, Harkewicz R, Masselon C, Alving K, Smith RD. Ion Discrimination During Ion Accumulation in a Quadrupole Interface External to a Fourier Transform Ion Cyclotron Resonance Mass Spectrometer. International Journal of Mass Spectrometry and Ion Processes. 2001c;208:205–225. [Google Scholar]
- Belov ME, Rakov VS, Goshe MB, Anderson GA, Smith RD, Nikolaev EN. Initial Implementation of External Accumulation Liquid Chromatography/Electrospray Ionization Fourier Transform Ion Cyclotron Resonance Mass Spectrometry with Automated Gain Control. Rapid Communications in Mass Spectrometry. 2003a;17:627–636. doi: 10.1002/rcm.955. [DOI] [PubMed] [Google Scholar]
- Belov ME, Zhang R, Strittmatter EF, Prior DC, Tang K, Smith RD. Automated Gain Control And Internal Calibration With External Ion Accumulation Capillary LC-ESIFTICR. Analytical Chemistry. 2003b;75:4195–4205. doi: 10.1021/ac0206770. [DOI] [PubMed] [Google Scholar]
- Belov ME, Anderson GA, Wingerd MA, Udseth HR, Tang K, Prior DC, Swanson KR, Buschbach MA, Strittmatter EF, Moore RJ, Smith RD. An Automated High Performance Capillary Liquid Chromatography-Fourier Transform Ion Cyclotron Resonance Mass Spectrometer for High-throughput Proteomics. Journal of the American Society for Mass Spectrometry. 2004;15:212–232. doi: 10.1016/j.jasms.2003.09.008. [DOI] [PubMed] [Google Scholar]
- Bergquist J. FTICR Mass Spectrometry in Proteomics. Current Opinion in Molecular Therapeutics. 2003;5:310–314. [PubMed] [Google Scholar]
- Bogdanov B, Smith RD. Proteomics by FTICR Mass Spectrometry: Top Down and Bottom Up. Mass Spectrometry Reviews. 2005;24:168–200. doi: 10.1002/mas.20015. [DOI] [PubMed] [Google Scholar]
- Bondarenko PV, Chelius D, Shaler TA. Identification and Relative Quantitation of Protein Mixtures by Enzymatic Digestion Followed by Capillary Reversed-Phase Liquid Chromatography-Tandem Mass Spectrometry. Analytical Chemistry. 2002;74:4741–4749. doi: 10.1021/ac0256991. [DOI] [PubMed] [Google Scholar]
- Bruce JE, Anderson GA, Wen J, Harkewicz R, Smith RD. High-Mass-Measurement Accuracy for 100% Sequence Coverage of Enzymatically Digested Bovine Serum Albumin from an ESI-FTICR Mass Spectrum. Analytical Chemistry. 1999;71:2595–2599. doi: 10.1021/ac990231s. [DOI] [PubMed] [Google Scholar]
- Bylund D, Danielsson R, Malmquist G, Markides KE. Chromatographic Alignment by Warping and Dynamic Programming as a Pre-processing Tool for PARAFAC Modelling of Liquid Chromatography-Mass Spectrometry Data. Journal of Chromatography A. 2002;961:237–244. doi: 10.1016/s0021-9673(02)00588-5. [DOI] [PubMed] [Google Scholar]
- Chelius D, Bondarenko PV. Quantitative Profiling of Proteins in Complex Mixtures Using Liquid Chromatography and Mass Spectrometry. Journal of Proteome Research. 2002;1:317–323. doi: 10.1021/pr025517j. [DOI] [PubMed] [Google Scholar]
- Chen Y, Mant CT, Hodges RS. Temperature Selectivity Effects in Reversed-Phase Liquid Chromatography Due to Conformation Differences Between Helical and Non-Helical Peptides. Journal of Chromatography A. 2003;1010:45–61. doi: 10.1016/s0021-9673(03)00877-x. [DOI] [PubMed] [Google Scholar]
- Cohen P. The Role of Protein-Phosphorylation in Neural and Hormonal- Control of Cellular-Activity. Nature. 1982;296:613–620. doi: 10.1038/296613a0. [DOI] [PubMed] [Google Scholar]
- Comisarow MB, Marshall AG. Fourier Transform Ion Cyclotron Resonance Mass Spectrometry. Chemical Physics Letters. 1974a;25:282–283. [Google Scholar]
- Comisarow MB, Marshall AG. Frequency-Sweep Fourier Transform Ion Cyclotron Resonance Mass Spectroscopy. Chemical Physics Letters. 1974b;6:489–490. [Google Scholar]
- Conrads TP, Alving K, Veenstra TD, Belov ME, Anderson GA, Anderson DJ, Lipton MS, Paša-Tolić L, Udseth HR, Chrisler WB, Thrall BD, Smith RD. Quantitative Analysis of Bacterial and Mammalian Proteomes Using a Combination of Cysteine Affinity Tags and 15N-Metabolic Labeling. Analytical Chemistry. 2001;73:2132–2139. doi: 10.1021/ac001487x. [DOI] [PubMed] [Google Scholar]
- DeSouza L, Diehl G, Rodrigues MJ, Guo J, Romaschin AD, Colgan TJ, Siu KW. Search for Cancer Markers from Endometrial Tissues Using Differentially Labeled Tags iTRAQ and cICAT with Multidimensional Liquid Chromatography and Tandem Mass Spectrometry. Journal of Proteome Research. 2005;4:377–386. doi: 10.1021/pr049821j. [DOI] [PubMed] [Google Scholar]
- Eng JK, McCormack AL, Yates JR. An Approach to Correlate Tandem Mass Spectral Data of Peptides with Amino Acid Sequences in a Protein Database. Journal of the American Society for Mass Spectrometry. 1994;5:976–989. doi: 10.1016/1044-0305(94)80016-2. [DOI] [PubMed] [Google Scholar]
- Ferguson PL, Smith RD. Proteome Analysis by Mass Spectrometry. Annual Review of Biophysics and Biomolecular Structure. 2003;32:399–424. doi: 10.1146/annurev.biophys.32.110601.141854. [DOI] [PubMed] [Google Scholar]
- Ficarro SB, McCleland ML, Stukenberg PT, Burke DJ, Ross MM, Shabanowitz J, Hunt DF, White FM. Phosphoproteome Analysis by Mass Spectrometry and its Application to Saccharomyces cerevisiae. Nature Biotechnology. 2002;20:301–305. doi: 10.1038/nbt0302-301. [DOI] [PubMed] [Google Scholar]
- Flora JW, Hannis JC, Muddiman DC. High-Mass Accuracy of Product Ions Produced by SORI-CID Using a Dual Electrospray Ionization Source Coupled with FTICR Mass Spectrometry. Analytical Chemistry. 2001;73:1247–1251. doi: 10.1021/ac0011282. [DOI] [PubMed] [Google Scholar]
- Ge Y, Lawhorn BG, ElNaggar M, Strauss E, Park JH, Begley TP, McLafferty FW. Top Down Characterization of Larger Proteins (45 kDa) by Electron Capture Dissociation Mass Spectrometry. Journal of the American Chemical Society. 2002;124:672–678. doi: 10.1021/ja011335z. [DOI] [PubMed] [Google Scholar]
- Geromanos SJ, Richardson K, Young P, Denny R, Gorenstein M, Li G-Z, Riley T, Silva J, Opiteck GJ, Dongre AR, Hefta SA. Proceedings of the 52nd ASMS Conference on Mass Spectrometry and Allied Topics; Nashville, TN. 2004. [Google Scholar]
- Giometti CS, Khare T, Tollaksen SL, Tsapin A, Zhu W, Yates JR, Nealson KH. Analysis of the Shewanella oneidensis Proteome by Two-Dimensional Gel Electrophoresis Under Nondenaturing Conditions. Proteomics. 2003;3:777–785. doi: 10.1002/pmic.200300406. [DOI] [PubMed] [Google Scholar]
- Godovac-Zimmerman J, Brown LR. Perspectives for Mass Spectrometry and Functional Proteomics. Mass Spectrometry Reviews. 2001;20:1–57. doi: 10.1002/1098-2787(2001)20:1<1::AID-MAS1001>3.0.CO;2-J. [DOI] [PubMed] [Google Scholar]
- Goldberg DE. Genetic Algorithms in Search, Optimization and Machine Learning. Addison-Wesley; Reading MS: 1989. [Google Scholar]
- Goshe MB, Conrads TP, Panisko EA, Angell NH, Veenstra TD, Smith RD. Phosphoprotein Isotope-Coded Affinity Tag Approach for Isolating and Quantitating Phosphopeptides in Proteome-Wide Analyses. Analytical Chemistry. 2001;73:2578–2586. doi: 10.1021/ac010081x. [DOI] [PubMed] [Google Scholar]
- Goshe MB, Smith RD. Stable Isotope-Coded Proteomic Mass Spectrometry. Current Opinion in Biotechnology. 2003;14:101–109. doi: 10.1016/s0958-1669(02)00014-9. [DOI] [PubMed] [Google Scholar]
- Gygi SP, Rist B, Gerber SA, Turecek F, Gelb MH, Aebersold R. Quantitative Analysis of Complex Protein Mixtures Using Isotope -Coded Affinity Tags. Nature Biotechnology. 1999;17:994–999. doi: 10.1038/13690. [DOI] [PubMed] [Google Scholar]
- Hancock WS, Chloupek RC, Kirkland JJ, Snyder LR. Temperature as a Variable in Reversed-Phase High-Performance Liquid-Chromatographic Separations of Peptide and Protein Samples. 1. Optimizing the Separation of a Growth-Hormone Tryptic Digest. Journal of Chromatography A. 1994;686:31–42. doi: 10.1016/0021-9673(94)00077-8. [DOI] [PubMed] [Google Scholar]
- Hancock WS. A Call for: Back to the Basics. Journal of Proteome Research. 2003;2:569. [Google Scholar]
- Hansen KC, Schmitt-Ulms G, Chalkley RJ, Hirsch J, Baldwin MA, Burlingame AL. Mass Spectrometric Analysis of Protein Mixtures at Low Levels Using Cleavable 13C-Isotope-Coded Affinity Tag and Multidimensional Chromatography. Molecular and Cellular Proteomics. 2003;2:299–314. doi: 10.1074/mcp.M300021-MCP200. [DOI] [PubMed] [Google Scholar]
- Harkewicz R, Belov ME, Anderson DA, Paša-Tolić L, Masselon CD, Prior DC, Udseth HR, Smith RD. ESI-FTICR Mass Spectrometry Employing Data-Dependent External Ion Selection and Accumulation. Journal of the American Society for Mass Spectrometry. 2002;13:144–154. doi: 10.1016/S1044-0305(01)00343-9. [DOI] [PubMed] [Google Scholar]
- Heller M, Mattou H, Menzel C, Yao X. Trypsin Catalyzed 16O-to-18O Exchange for Comparative Proteomics: Tandem Mass Spectrometry Comparison Using MALDI-TOF, ESI-QTOF, and ESI-Ion Trap Mass Spectrometers. Journal of the American Society for Mass Spectrometry. 2003;14:704–718. doi: 10.1016/S1044-0305(03)00207-1. [DOI] [PubMed] [Google Scholar]
- Holland JH. Adaptation in Natural and Artificial Systems. University of Michigan Press; Ann Arbor, MI: 1975. [Google Scholar]
- Holliman CL, Rempel DL, Gross ML. Detection of High Mass-to-Charge Ions by Fourier Transform Mass Spectrometry. Mass Spectrometry Reviews. 1994;13:105–132. [Google Scholar]
- Horn DM, Zubarev RA, McLafferty FW. Automated Reduction and Interpretation of High Resolution Electrospray Mass Spectra of Large Molecules. Journal of the American Society for Mass Spectrometry. 2000;11:320–332. doi: 10.1016/s1044-0305(99)00157-9. [DOI] [PubMed] [Google Scholar]
- Jacobs JM, Mottaz HM, Yu LR, Anderson DJ, Moore RJ, Chen WU, Auberry KJ, Strittmatter EF, Monroe ME, Thrall BD, Camp DG, Smith RD. Multidimensional Proteome Analysis of Human Mammary Epithelial Cells. Journal of Proteome Research. 2004;3:68–75. doi: 10.1021/pr034062a. [DOI] [PubMed] [Google Scholar]
- Jacobs JM, Diamond DL, Chan EY, Gritsenko MA, Qian WJ, Stastna M, Baas T, Camp DGI, Carithers RLJ, Smith RD, Katze MG. Proteome Analysis of Liver Cells Expressing a Full-Length Hepatitis C Virus (HCV) Replicon and Biopsy Specimens of Posttransplantation Liver from HCV-Infected Patients. Journal of Virology. 2005;79:7558–7569. doi: 10.1128/JVI.79.12.7558-7569.2005. [DOI] [PMC free article] [PubMed] [Google Scholar]
- Johnson KL, Mason CJ, Muddiman DC, Eckel JE. Analysis of the Low Molecular Weight Fraction of Serum by LC-Dual ESI-FT-ICR Mass Spectrometry: Precision of Retention Time, Mass, and Ion Abundance. Analytical Chemistry. 2004;76:5097–5103. doi: 10.1021/ac0497003. [DOI] [PubMed] [Google Scholar]
- Kearney P, Thibault P. Bioinformatics Meets Proteomics -- Bridging the Gap Between Mass Spectrometry Data Analysis and Cell Biology. Journal of Bioinformatics and Computational Biology. 2003;1:183–200. doi: 10.1142/s021972000300023x. [DOI] [PubMed] [Google Scholar]
- Kelleher NL, Lin HY, Valaskovic GA, Aaserud DJ, Fridriksson EK, McLafferty FW. Top Down Versus Bottom Up Protein Characterization by Tandem High-Resolution Mass Spectrometry. Journal of the American Chemical Society. 1999;121:806–812. [Google Scholar]
- Keller A, Nesvizhskii AI, Kolker E, Aebersold R. Empirical Statistical Model To Estimate the Accuracy of Peptide Identifications Made by MS/MS and Database Search. Analytical Chemistry. 2002;74:5383–5392. doi: 10.1021/ac025747h. [DOI] [PubMed] [Google Scholar]
- Kiebel GR, Auberry KJ, Jaitly N, Clark DA, Monroe ME, Peterson ES, Tolić N, Anderson GA, Smith RD. PRISM: A Data Management System for High-Throughput Proteomics. Proteomics. 2006;6:1783–1790. doi: 10.1002/pmic.200500500. [DOI] [PubMed] [Google Scholar]
- Kolker E, Picone AF, Galperin MY, Romine MF, Higdon R, Makarova KS, Kolker N, Anderson GA, Qiu XY, Auberry KJ, Babnigg G, Beliaev AS, Edlefsen P, Elias DA, Gorby YA, Holzman T, Klappenbach JA, Konstantinidis KT, Land ML, Lipton MS, McCue LA, Monroe M, Paša-Tolić L, Pinchuk G, Purvine S, Serres MH, Tsapin S, Zakrajsek BA, Zhou JH, Larimer FW, Lawrence CE, Riley M, Collart FR, Yates JR, Smith RD, Giometti CS, Nealson KH, Fredrickson JK, Tiedje JM. Global profiling of Shewanella oneidensis MR-1: Expression of hypothetical genes and improved functional annotations. Proceedings of the National Academy of Sciences of the United States of America. 2005;102:2099–2104. doi: 10.1073/pnas.0409111102. [DOI] [PMC free article] [PubMed] [Google Scholar]
- Lee SW, Berger SJ, Martinovic S, Paša-Tolić L, Anderson GA, Shen Y, Zhao R, Smith RD. Direct Mass Spectrometric Analysis of Intact Proteins of the Yeast Large Ribosomal Subunit using Capillary LC/FTICR. Proceedings of the National Academy of Science of the United States of America. 2002;99:5942–5947. doi: 10.1073/pnas.082119899. [DOI] [PMC free article] [PubMed] [Google Scholar]
- Li J, Steen H, Gygi SP. Protein Profiling with Cleavable Isotope-coded Affinity Tag (cICAT) Reagents: The Yeast Salinity Stress Response. Molecular and Cellular Proteomics. 2003;2:1198–1204. doi: 10.1074/mcp.M300070-MCP200. [DOI] [PubMed] [Google Scholar]
- Li L, Masselon C, Anderson GA, Paša-Tolić L, Lee SW, Shen Y, Zhao R, Lipton MS, Conrads TP, Tolić N, Smith RD. High-Throughput Peptide Identification from Protein Digests Using Data-Dependent Multiplexed Tandem FTICR Mass Spectrometry Coupled with Capillary Liquid Chromatography. Analytical Chemistry. 2001;73:3313–3322. doi: 10.1021/ac010192w. [DOI] [PubMed] [Google Scholar]
- Li X, Pedrioli P, Eng J, Martin D, Yi E, Lee H, Aebersold R. A Tool to Visualize and Evaluate Data Obtained by Liquid Chromatography-Electrospray Ionization-Mass Spectrometry. Analytical Chemistry. 2004;76:3856–3860. doi: 10.1021/ac035375s. [DOI] [PubMed] [Google Scholar]
- Link AJ, Eng J, Schieltz DM, Carmack E, Mize GJ, Morris DR, Garvik BM, Yates JR. Direct Analysis of Protein Complexes Using Mass Spectrometry. Nature Biotechnology. 1999;17:676–682. doi: 10.1038/10890. [DOI] [PubMed] [Google Scholar]
- Lipton MS, Paša-Tolić L, Anderson GA, Anderson DJ, Auberry DL, Battista JR, Daly MJ, Fredrickson J, Hixson KK, Kostandarithes H, Masselon C, Markillie LM, Moore RJ, Romine MF, Shen Y, Strittmatter E, Tolić N, Udseth HR, Venkateswaran A, Wong KK, Zhao R, Smith RD. Global Analysis of the Deinococcus radiodurans R1 Proteome by Using Accurate Mass Tags. Proceedings of the National Academy of Science of the United States of America. 2002;99:11,049–011,054. doi: 10.1073/pnas.172170199. [DOI] [PMC free article] [PubMed] [Google Scholar]
- Listgarten J, Emili A. Statistical and Computational Methods for Comparative Proteomic Profiling Using Liquid Chromatography-Tandem Mass Spectrometry. Molecular and Cellular Proteomics. 2005;4:419–434. doi: 10.1074/mcp.R500005-MCP200. [DOI] [PubMed] [Google Scholar]
- Liu T, Qian W-J, Strittmatter EF, Camp DGI, Anderson GA, Thrall BD, Smith RD. High-Throughput Comparative Proteome Analysis Using a Quantitative Cysteinyl-Peptide Enrichment Technology. Analytical Chemistry. 2004;76:5345–5353. doi: 10.1021/ac049485q. [DOI] [PubMed] [Google Scholar]
- Liu T, Qian WJ, Chen WU, Jacobs JM, Moore RJ, Anderson DJ, Gritsenko MA, Monroe ME, Thrall BD, Camp DG, Smith RD. Improved Proteome Coverage by Using High Efficiency Cysteinyl Peptide Enrichment: The Human Mammary Epithelial Cell Proteome. Proteomics. 2005;5:1263–1273. doi: 10.1002/pmic.200401055. [DOI] [PMC free article] [PubMed] [Google Scholar]
- MacCoss MJ, McDonald WH, Saraf A, Sadygov RG, Clark JM, Tasto JJ, Gould KL, Wolters D, Washburn MP, Weiss A, Clark JI, Yates JR. Shotgun Identification of Protein Modifications from Protein Complexes and Lens Tissue. Proceedings of the National Academy of Science of the United States of America. 2002;99:7900–7905. doi: 10.1073/pnas.122231399. [DOI] [PMC free article] [PubMed] [Google Scholar]
- Marshall AG. Ion Cyclotron Resonance and Nuclear Magnetic Resonance Spectroscopies: Magnetic Partners for Elucidation of Molecular Structure and Reactivity. Accounts of Chemical Research. 1996;29:307–316. [Google Scholar]
- Marshall AG, Guan SH. Advantages of High Magnetic Field for Fourier Transform Ion Cyclotron Resonance Mass Spectrometry. Rapid Communications in Mass Spectrometry. 1996;10:1819–1823. doi: 10.1002/(SICI)1097-0231(199611)10:14<1829::AID-RCM697>3.0.CO;2-U. [DOI] [PubMed] [Google Scholar]
- Marshall AG, Hendrickson CL, Jackson GS. Fourier Transform Ion Cyclotron Resonance Mass Spectrometry: A Primer. Mass Spectrometry Reviews. 1998;17:1–35. doi: 10.1002/(SICI)1098-2787(1998)17:1<1::AID-MAS1>3.0.CO;2-K. [DOI] [PubMed] [Google Scholar]
- Marshall AG. Milestones in Fourier Transform Ion Cyclotron Resonance Mass Spectrometry Technique Development. International Journal of Mass Spectrometry. 2000;200:331–356. [Google Scholar]
- Masselon C, Paša-Tolić L, Lee S-W, Li L, Anderson GA, Narkewicz R, Smith RD. Identification of Tryptic Peptides from Large Databases Using Multiplexed Tandem Mass Spectrometry: Simulation and Experimental Results. Proteomics. 2003;3:1279–1286. doi: 10.1002/pmic.200300448. [DOI] [PubMed] [Google Scholar]
- Masselon C, Paša-Tolić L, Tolić N, Anderson GA, Bogdanov B, Vilkov AN, Shen Y, Zhao R, Qian W-J, Lipton MS, Camp DGI, Smith RD. Targeted Comparative Proteomics by Liquid Chromatography–Fourier Transform Ion Cyclotron Resonance Tandem Mass Spectrometry. Analytical Chemistry. 2005;77:400–406. doi: 10.1021/ac049043e. [DOI] [PMC free article] [PubMed] [Google Scholar]
- McLafferty FW. High-Resolution Tandem FT Mass Spectrometry Above 10 kDa. Accounts of Chemical Research. 1994;27:379–386. [Google Scholar]
- Meng FY, Cargile BJ, Patrie SM, Johnson JR, McLoughlin SM, Kelleher NL. Processing Complex Mixtures of Intact Proteins for Direct Analysis by Mass Spectrometry. Analytical Chemistry. 2002;74:2923–2929. doi: 10.1021/ac020049i. [DOI] [PubMed] [Google Scholar]
- Nielsen N-PV, Carstensen JM, Smedsgaard J. Aligning of Single and Multiple Wavelength Chromatographic Profiles for Chemometric Data Analysis Using Correlation Optimised Warping. Journal of Chromatography A. 1998;805:17–35. [Google Scholar]
- Norbeck AD, Monroe ME, Adkins JN, Anderson KK, Daly DS, Smith RD. The Utility of Accurate Mass and LC Elution Time Information in the Analysis of Complex Proteomes. J Am Soc Mass Spectrom. 2005;16:1239–1249. doi: 10.1016/j.jasms.2005.05.009. [DOI] [PMC free article] [PubMed] [Google Scholar]
- Oda Y, Nagasu T, Chait B. Enrichment Analysis of Phosphorylated Proteins as a Tool for Probing the Phosphoproteome. Nature Biotechnology. 2001;19:379–382. doi: 10.1038/86783. [DOI] [PubMed] [Google Scholar]
- Page JS, Masselon CD, Smith RD. FTICR Mass Spectrometry for Qualitative and Quantitative Bioanalyses. Current Opinion in Biotechology. 2004;15:3–11. doi: 10.1016/j.copbio.2004.01.002. [DOI] [PubMed] [Google Scholar]
- Paša-Tolić L, Harkewicz R, Anderson GA, Tolić N, Shen Y, Zhao R, Thrall B, Masselon C, Smith RD. Increased Proteome Coverage Based Upon High Performance Separations and DREAMS FTICR Mass Spectrometry. Journal of the American Society for Mass Spectrometry. 2002;13:954–963. doi: 10.1016/S1044-0305(02)00409-9. [DOI] [PubMed] [Google Scholar]
- Paša-Tolić L, Masselon C, Barry RC, Shen Y, Smith RD. Proteomic analyses using an accurate mass and time tag strategy. BioTechniques. 2004;37:621–639. doi: 10.2144/04374RV01. [DOI] [PubMed] [Google Scholar]
- Pawson T, Scott JD. Signaling Through Scaffold, Anchoring, and Adaptor Proteins. Science. 1997;278:2075–2080. doi: 10.1126/science.278.5346.2075. [DOI] [PubMed] [Google Scholar]
- Perkins DN, Pappin DJ, Creasy DM, Cottrell JS. Probability-based Protein Identification by Searching Sequence Databases Using Mass Spectrometry Data. Electrophoresis. 1999;20:3551–3567. doi: 10.1002/(SICI)1522-2683(19991201)20:18<3551::AID-ELPS3551>3.0.CO;2-2. [DOI] [PubMed] [Google Scholar]
- Petritis K, Kangas LJ, Ferguson PL, Anderson GA, Paša-Tolić L, Lipton MS, Auberry KJ, Strittmatter E, Shen Y, Zhao R, Smith RD. Use of Artificial Neural Networks for the Prediction of Peptide Liquid Chromatography Elution Times in Proteome Analyses. Analytical Chemistry. 2003;75:1039–1048. doi: 10.1021/ac0205154. [DOI] [PubMed] [Google Scholar]
- Qian WJ, Goshe MB, Camp DG, 2nd, Yu LR, Tang K, Smith RD. Phosphoprotein Isotope-Coded Solid-phase Tag Approach for Enrichment and Quantitative Analysis of Phosphopeptides from Complex Mixtures. Analytical Chemistry. 2003;75:5441–5450. doi: 10.1021/ac0342774. [DOI] [PubMed] [Google Scholar]
- Qian WJ, Camp DG, Smith RD. High Throughput Proteomics Using Fourier Transform Ion Cyclotron Resonance (FTICR) Mass Spectrometry. Expert Review of Proteomics. 2004;1:89–97. doi: 10.1586/14789450.1.1.87. [DOI] [PubMed] [Google Scholar]
- Qian WJ, Jacobs JM, Camp DG, II, Monroe ME, Moore RJ, Gritsenko MA, Calvano SE, Lowry SF, Xiao W, Moldawer LL, Davis RW, Tompkins RG, Smith RD. Comparative Proteome Analyses of Human Plasma Following in vivo Lipopolysaccharide Administration Using Multidimensional Separations Coupled with Tandem Mass Spectrometry. Proteomics. 2005a;5:572–584. doi: 10.1002/pmic.200400942. [DOI] [PMC free article] [PubMed] [Google Scholar]
- Qian WJ, Monroe ME, Liu T, Jacobs JM, Anderson GA, Shen Y, Moore RJ, Anderson DJ, Zhang R, Calvano SE, Lowry SF, Xiao W, Moldawer LL, Davis RW, Tompkins RG, Camp DG, II, Smith RD. Quantitative Proteome Analysis of Human Plasma Following in vivo Lipopolysaccharide Administration Using 16O/18O Labeling and the Accurate Mass and Time Tag Approach. Molecular and Cellular Proteomics. 2005b;4:700–709. doi: 10.1074/mcp.M500045-MCP200. [DOI] [PMC free article] [PubMed] [Google Scholar]
- Radulovic D, Jelveh S, Ryu S, Hamilton TG, Foss E, Mao Y, Emili A. Informatics Platform for Global Proteomic Profiling and Biomarker Discovery Using Liquid-Chromatography-Tandem Mass Spectrometry. Molecular and Cellular Proteomics. 2004;3:984–997. doi: 10.1074/mcp.M400061-MCP200. [DOI] [PubMed] [Google Scholar]
- Rockwood AL, Van Orden SL, Smith RD. Rapid Calculation of Isotope Distributions. Analytical Chemistry. 1995;67:2699–2704. doi: 10.1021/ac951158i. [DOI] [PubMed] [Google Scholar]
- Rudd PL, Elliott T, Cresswell P, Wilson IA, Dwek RA. Glycosylation and the Immune System. Science. 2001;291:2370–2376. doi: 10.1126/science.291.5512.2370. [DOI] [PubMed] [Google Scholar]
- Sannes-Lowery K, Griffey RH, Kruppa GH, Speir JP, Hofstadler SA. Multipole Storage Assisted Dissociation, A Novel In-Source Dissociation Technique for Electrospray Ionization Generated Ion. Rapid Communications in Mass Spectrometry. 1998;12:1957–1961. doi: 10.1002/(SICI)1097-0231(19981215)12:23<1957::AID-RCM418>3.0.CO;2-M. [DOI] [PubMed] [Google Scholar]
- Schmid AK, Lipton MS, Mottaz H, Monroe ME, Smith RD, Lidstrom ME. Global Whole-Cell FTICR Mass Spectrometric Proteomics Analysis of the Heat Shock Response in the Radioresistant Bacterium Deinococcus radiodurans. Journal of Proteome Research. 2005;4:709–718. doi: 10.1021/pr049815n. [DOI] [PubMed] [Google Scholar]
- Schmidt A, Karas M, Dülcks T. Effect of Different Solution Flow Rates on Analyte Ion Signals Innano-ESI MS, or When Does ESI Turn Into Nano-ESI? Journal of the American Society for Mass Spectrometry. 2003;23:492–500. doi: 10.1016/S1044-0305(03)00128-4. [DOI] [PubMed] [Google Scholar]
- Sechi S, Oda Y. Quantitative Proteomics Using Mass Spectrometry. Current Opinion in Chemical Biology. 2003;7:70–77. doi: 10.1016/s1367-5931(02)00010-8. [DOI] [PubMed] [Google Scholar]
- Senko MW, Beu SC, McLafferty FW. Determination of Monoisotopic Masses and Ion Populations for Large Biomolecules from Resolved Isotopic Distributions. Journal of the American Society for Mass Spectrometry. 1995;6:229–233. doi: 10.1016/1044-0305(95)00017-8. [DOI] [PubMed] [Google Scholar]
- Shen Y, Tolić N, Zhao R, Paša-Tolić L, Li L, Berger SJ, Harkewicz R, Anderson GA, Belov ME, Smith RD. High-Throughput Proteomics using High Efficiency Multiple-Capillary Liquid Chromatography with On-Line High Performance ESI FTICR Mass Spectrometry. Analytical Chemistry. 2001a;73:3011–3021. doi: 10.1021/ac001393n. [DOI] [PubMed] [Google Scholar]
- Shen Y, Zhao R, Belov ME, Conrads TP, Anderson GA, Tang K, Paša-Tolić L, Veenstra TD, Lipton MS, Smith RD. Packed Capillary Reversed-Phase Liquid Chromatography with High-Performance Electrospray Ionization Fourier Transform Ion Cyclotron Resonance Mass Spectrometry for Proteomics. Analytical Chemistry. 2001b;73:1766–1775. doi: 10.1021/ac0011336. [DOI] [PubMed] [Google Scholar]
- Shen Y, Zhao R, Berger SJ, Anderson GA, Rodriguez N, Smith RD. High-Efficiency Nanoscale Liquid Chromatography Coupled On-line with Mass Spectrometry using Nanoelectrospray Ionization for Proteomics. Analytical Chemistry. 2002;74:4235–4249. doi: 10.1021/ac0202280. [DOI] [PubMed] [Google Scholar]
- Shen Y, Moore RJ, Zhao R, Blonder J, Auberry DL, Masselon C, Paša-Tolić L, Hixson KK, Auberry KJ, Smith RD. High-Efficiency On-Line SPE Coupling to 15-150 mm I.D. Column LC for Proteomic Analysis. Analytical Chemistry. 2003;75:3596–3605. doi: 10.1021/ac0300690. [DOI] [PubMed] [Google Scholar]
- Shen Y, Jacobs JM, Camp DG, Fang R, Moore RJ, Smith RD, Xiao W, Davis RW, Tompkins RG. High Efficiency SCXLC/RPLC/MS/MS for High Dynamic Range Characterization of the Human Plasma Proteome. Analytical Chemistry. 2004a;76:1134–1144. doi: 10.1021/ac034869m. [DOI] [PubMed] [Google Scholar]
- Shen Y, Tolić N, Masselon C, Paša-Tolić L, Camp DGI, Hixson KK, Zhao R, Anderson GA, Smith RD. Ultrasensitive Proteomics Using High-efficiency On-Line Micro-SPENanoLC-NanoESI MS and MS/MS. Analytical Chemistry. 2004b;76:144–154. doi: 10.1021/ac030096q. [DOI] [PubMed] [Google Scholar]
- Smith RD, Anderson GA, Lipton MS, Paša-Tolić L, Shen Y, Conrads TP, Veenstra TD, Udseth HR. An Accurate Mass Tag Strategy for Quantitative and High Throughput Proteome Measurements. Proteomics. 2002;2:513–523. doi: 10.1002/1615-9861(200205)2:5<513::AID-PROT513>3.0.CO;2-W. [DOI] [PubMed] [Google Scholar]
- Smith RD, Shen Y, Tang K. Ultrasensitive and Quantitative Analyses from Combined Separations-Mass Spectrometry for the Characterization of Proteomes. Accounts of Chemical Research. 2004;37:269–278. doi: 10.1021/ar0301330. [DOI] [PubMed] [Google Scholar]
- Snyder LR. Temperature-Induced Selectivity in Separations by Reversed-Phase Liquid Chromatography. Journal of Chromatography. 1979;179:167–172. [Google Scholar]
- Stewart II, Thomson T, Figeys D. 18-O Labeling: A Tool for Proteomics. Rapid Communications in Mass Spectrometry. 2001;15:2456–2465. doi: 10.1002/rcm.525. [DOI] [PubMed] [Google Scholar]
- Strittmatter EF, Ferguson PL, Tang K, Smith RD. Proteome Analyses Using Accurate Mass and Elution Time Peptide Tags with Capillary LC Time-of-Flight mass Spectrometry. Journal of the American Society for Mass Spectrometry. 2003;14:980–991. doi: 10.1016/S1044-0305(03)00146-6. [DOI] [PubMed] [Google Scholar]
- Strittmatter EF, Kangas LJ, Petritis K, Mottaz HM, Anderson GA, Shen Y, Jacobs JM, Camp DGI, Smith RD. Application of Peptide Retention Time Information in a Discriminant Function for Peptide Identification by Tandem Mass Spectrometry. Journal of Proteome Research. 2004;3:760–769. doi: 10.1021/pr049965y. [DOI] [PubMed] [Google Scholar]
- Syka JEP, Coon JJ, Schroeder MJ, Shabanowitz J, Hunt DF. Peptide and Protein Sequence Analysis by Electron Transfer Dissociation Mass Spectrometry. Proceedings of the National Academy of Science of the United States of America. 2004;101:9528–9533. doi: 10.1073/pnas.0402700101. [DOI] [PMC free article] [PubMed] [Google Scholar]
- Tang K, Tolmachev AV, Nikolaev E, Zhang R, Belov ME, Udseth HR, Smith RD. Independent Control of Ion Transmission in a Jet Disrupter Dual-Channel Ion Funnel Electrospray Ionization MS Interface. Analytical Chemistry. 2002;74:5431–5437. doi: 10.1021/ac0202583. [DOI] [PubMed] [Google Scholar]
- Tao WA, Aebersold R. Advances in Quantitative Proteomics Via Stable Isotope Tagging and Mass Spectrometry. Current Opinion in Biotechnology. 2003;14:110–118. doi: 10.1016/s0958-1669(02)00018-6. [DOI] [PubMed] [Google Scholar]
- Tolmachev AV, Udseth HR, Smith RD. Radial Stratification of Ions as a Function of Mass to Charge Ratio in Collisional Cooling Radio Frequency Multipoles Used as Ion Guides or Ion Traps. Rapid Communications in Mass Spectrometry. 2000;14:1907–1913. doi: 10.1002/1097-0231(20001030)14:20<1907::AID-RCM111>3.0.CO;2-M. [DOI] [PubMed] [Google Scholar]
- Valaskovic GA, Kelleher NL, Mclafferty FW. Attomole Protein Characterization by Capillary Eectrophoresis-Mass Spectrometry. Science. 1996;273:1199–1202. doi: 10.1126/science.273.5279.1199. [DOI] [PubMed] [Google Scholar]
- Venkateswaran A, McFarlan SC, Ghosal D, Minton KW, Vasilenko A, Makarova K, Wackett LP, Daly MJ. Physiologic Determinants of Radiation Resistance in Deinococcus radiodurans. Applied and Environmental Microbiology. 2000;66:2620–2626. doi: 10.1128/aem.66.6.2620-2626.2000. [DOI] [PMC free article] [PubMed] [Google Scholar]
- Venkateswaran K, Moser DP, Dollhopf ME, Lies DP, Saffarini DA, MacGregor BJ, Ringelberg DB, White DC, Nishijima M, Sano H, Burghardt J, Stackebrandt E, Nealson KH. Polyphasic Taxonomy of the Genus Shewanella and Description of Shewanella oneidensis sp. nov. International Journal of Systematic Bacteriology. 1999;49:705–724. doi: 10.1099/00207713-49-2-705. [DOI] [PubMed] [Google Scholar]
- Washburn MP, Wolters D, Yates JR. Large-scale Analysis of the Yeast Proteome by Multidimensional Protein Identification Technology. Nature Biotechnology. 2001;19:242–247. doi: 10.1038/85686. [DOI] [PubMed] [Google Scholar]
- White O, Eisen JA, Heidelberg JF, Hickey EK, Peterson JD, Dodson RJ, Haft DH, Gwinn ML, Nelson WC, Richardson DL, Moffat KS, Qin H, Jiang L, Pamphile W, Crosby M, Shen M, Vamathevan JJ, Lam P, McDonald L, Utterback T, Zalewski C, Makarova KS, Aravind L, Daly MJ, Minton KW, Fleischmann RD, Ketchum KA, Nelson KE, Salzberg S, Smith HO, Venter JC, Fraser CM. Genome Sequence of the Radioresistant Bacterium Deinococcus radiodurans R1. Science. 1999;286:1571–1577. doi: 10.1126/science.286.5444.1571. [DOI] [PMC free article] [PubMed] [Google Scholar]
- Wilm M, Mann M. Analytical Properties of the Nanoelectrospray Ion Source. Analytical Chemistry. 1996;68:1–8. doi: 10.1021/ac9509519. [DOI] [PubMed] [Google Scholar]
- Wilm MS, Mann M. Electrospray and Taylor-Cone Theory, Dole's Beam of Macromolecules at Last? International Journal of Mass Spectrometry and Ion Processes. 1994;136:167–180. [Google Scholar]
- Yao X, Freas A, Ramirez J, Demirev PA, Fenselau C. Protelytic 180 Labeling for Comparative Proteomics: Model Studies with Two Serotypes of Adenovirus. Analytical Chemistry. 2001;73:2836–2842. doi: 10.1021/ac001404c. [DOI] [PubMed] [Google Scholar]
- Yao X, Afonso C, Fenselau C. Dissection of Proteolytic 18O Labeling: Endoproteasecatalyzed 16O-to-18O Exchange of Truncated Peptide Substrates. Journal of Proteome Research. 2003;2:147–152. doi: 10.1021/pr025572s. [DOI] [PubMed] [Google Scholar]
- Yu LR, Conrads TP, Uo T, Issaq HJ, Morrison RS, Veenstra TD. Evaluation of the Acid-Cleavable Isotope-Coded Affinity Tag Reagents: Application to Camptothecin-Treated Cortical Neurons. Journal of Proteome Research. 2004;3:469–477. doi: 10.1021/pr034090t. [DOI] [PubMed] [Google Scholar]
- Zachara NE, Hart GW. The Emerging Significance of O-GlcNAc in Cellular Regulation. Chemical Reviews. 2002;102:431–438. doi: 10.1021/cr000406u. [DOI] [PubMed] [Google Scholar]
- Zhang H, Li X-j, Martin DB, Aerbersold R. Identification and Quantification of N-linked Glycoproteins using Hydrazide Chemistry, Stable Isotope Labeling and Mass Spectrometry. Nature Biotechnology. 2003;21:660–666. doi: 10.1038/nbt827. [DOI] [PubMed] [Google Scholar]
- Zhang R, Regnier FE. Minimizing Resolution of Isotopically Coded Peptides in Comparative Proteomics. Journal of Proteome Research. 2002;1:139–147. doi: 10.1021/pr015516b. [DOI] [PubMed] [Google Scholar]
- Zhou HL, Ranish JA, Watts JD, Aebersold R. Quantitative Proteome Analysis by Solid-Phase Isotope Tagging and Mass Spectrometry. Nature Biotechnology. 2002;20:512–515. doi: 10.1038/nbt0502-512. [DOI] [PubMed] [Google Scholar]
- Zhu PL, Dolan JW, Snyder LR. Combined Use of Temperature and Solvent Strength in Reversed-Phase Gradient Elution.2. Comparing Selectivity for Different Samples and Systems. Journal Chromatography A. 1996a;756:41–50. doi: 10.1016/s0021-9673(96)00721-2. [DOI] [PubMed] [Google Scholar]
- Zhu PL, Dolan JW, Snyder LR, Hill DW, Van Heukelem L, Waeghe TJ. Combined Use of Temperature and Solvent Strength in Reversed-Phase Gradient Elution. 3. Selectivity for Ionizable Samples as a Function of Sample Type and pH. Journal of Chromatography A. 1996b;756:51–62. doi: 10.1016/s0021-9673(96)00721-2. [DOI] [PubMed] [Google Scholar]
- Zubarev RA, Kelleher NL, McLafferty FW. Electron capture dissociation of multiply charged protein cations. A nonergodic process. Journal of the American Chemical Society. 1998;120:3265–3266. [Google Scholar]


