Abstract
High-accuracy ab initio folding has remained an elusive objective despite decades of effort. To explore the folding landscape of villin headpiece subdomain HP35, we conducted two sets of replica exchange molecular dynamics for 200 ns each and three sets of conventional microsecond-long molecular dynamics simulations, using AMBER FF03 force field and a generalized-Born solvation model. The protein folded consistently to the native state; the lowest Cα-rmsd from the x-ray structure was 0.46 Å, and the Cα- rmsd of the center of the most populated cluster was 1.78 Å at 300 K. ab initio simulations have previously not reached this level. The folding landscape of HP35 can be partitioned into the native, denatured, and two intermediate-state regions. The native state is separated from the major folding intermediate state by a small barrier, whereas a large barrier exists between the major folding intermediate and the denatured states. The melting temperature Tm = 339 K extracted from the heat-capacity profile was in close agreement with the experimentally derived Tm = 342 K. A comprehensive picture of the kinetics and thermodynamics of HP35 folding emerges when the results from replica exchange and conventional molecular dynamics simulations are combined.
Keywords: ab initio protein folding, replica exchange
Despite decades of effort, high-accuracy ab initio protein folding has remained elusive to the simulation community. Most existing ab initio protein folding simulations have typically been at the 3–4 Å level based on the best Cα-rmsd compared with the experimental structures. When heavy-atom rmsd is used, a much larger rmsd (>5 Å) would be common. Yet, crystals of small proteins that can diffract only at 5-Å resolution are not considered of acceptable quality. Thus, most of the ab initio folding simulations have never reached the native states despite the enormous effort, underscoring the challenge. Because of the lack of accuracy in those simulations, it is impossible to obtain the crucial information on the folding pathways to the native states. This renders great ambiguity to the interpretation of the folding mechanisms. In this work, we demonstrate consistent ab initio protein folding to the native state of HP35.
Villin headpiece is an F actin-binding domain that resides in the far C terminal of the super villin (1, 2). The 35-residue C-terminal subdomain HP35 can fold autonomously without the assistance of disulfide bonds or metal ions and has a melting temperature of Tm = 342 K, which is surprisingly high for a protein of its size (3–5). HP35 is arguably the smallest native occurring protein with the features of much bigger proteins, where multiple secondary structures (three helices) are bound together by a well packed hydrophobic core (three phenylalanine residues and other hydrophobic residues). As such, unveiling the folding mechanism of HP35 will augment our understanding of protein folding.
The unique structural architecture of HP35 was revealed by using both NMR and x-ray crystallography (5, 6). However, the elucidation of the folding mechanism of HP35, remains a long-standing endeavor. In a laser-induced temperature-jump experiment, the quenching of Trp23 by the engineered His27 revealed a 4.3-μs fast folding (4), which was later confirmed by NMR line-shape analysis (7) and loop-formation dynamics (8). Two kinetic phases, with the time constant of 70 ns and 5 μs, were observed experimentally (4), indicating hidden complexities in the folding process. Mutagenesis experiments on the three core phenylalanine residues (9) and the Pro21-X22-Trp23 motif (10) demonstrated the contribution from interior and surface residues to the stability. Studies of the HP35 fragments showed that the individual helices are largely unstructured, whereas the fragment with the first two helices displayed significant structure (11). In a solid-state NMR study, three residues (Val9, Ala16, and Leu28) from the three helices exhibited distinct behavior during the denaturation process, and a two-step folding mechanism was proposed (12).
Because of its small size and fast folding, HP35 has attracted much attention from the biomolecular simulation community. HP35 folding was first studied by a microsecond all-atom simulation (13, 14) that did not reach the native state. Subsequently, Shen and Freed (15) performed a 200-ns simulation with an implicit solvent and also reached a semifolded state. Pande and coworkers (16–18) adapted distributed computing and pushed both the continuum and explicit solvent simulations to an aggregated millisecond time scale. Other notable studies include the implicit solvent simulations by Pak and coworkers (19), Scheraga and coworkers (20), and Herges and Wenzel (21). In addition, a variety of advanced techniques have been applied to facilitate the sampling of the native state (22–24). Nonetheless, the best Cα-rmsd sampled during those simulations was typically >3.0 Å, and the average Cα-rmsd of the most sampled conformations was significantly higher. Thus, despite the effort, simulations have so far failed to reach the native state of HP35.
Replica exchange molecular dynamics (REMD) method has emerged as an efficient sampling tool (25, 26). In this method, a set of simulations are performed independently at different target temperatures, and exchanges are attempted according to the Metropolis criterion, therefore permitting random walks in the temperature space and escape from local energy traps. REMD has been successfully applied to the folding studies of β-hairpin (27), three-strand β-sheet (28), helical peptides (29), and small proteins (30, 31). Hansmann and coworkers (32–34) have conducted a series of REMD simulations on HP35 with either temperature or Hamiltonian exchange. Despite the state-of-art sampling ability of REMD, the Cα-rmsd in those simulations could not cross the 3.0-Å barrier, again underscoring the challenge.
In this study, we report two sets of REMD and three sets of conventional molecular dynamics (CMD) simulations on the folding of HP35 to the native conformation starting from the fully extended structure. The protein was modeled by using AMBER FF03 force field that we developed a few years ago (35). In this work, the native state of HP35 was consistently reached when the temperature was below the melting temperature of this protein. The high-accuracy folding allowed further investigation of the protein folding landscape and the thermodynamic properties of HP35, including the folding pathways to the native state.
Results
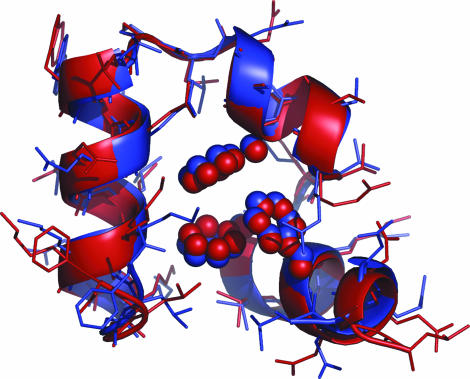
Starting from the fully extended polypeptide chain of HP35, we conducted two sets of 200-ns REMD and three sets of 1.0-μs CMD simulations. Similar features were observed in both sets of REMD simulations. For clarity, we report the results mainly based on one REMD set. We applied a generalized-Born model (36) to represent the solvation effect. The temperature of the 20 replicas ranged from 273 K to 500 K. Folding was examined by the closeness of the simulated structures to the x-ray crystal structure (6). Subangstrom folding was consistently achieved at temperatures <360 K, with the lowest Cα-rmsd between 0.46 Å and 0.80 Å (excluding terminal residues Leu1 and Phe35). The best folded structure at 300 K with 0.46 Å Cα-rmsd (all-atom rmsd 1.59 Å) is shown in Fig. 1. The finer characteristic features of HP35, including the exact boundaries of the secondary structures, were reproduced well in the simulations. In addition to a high degree of resemblance between the backbone structures, the packing patterns of the hydrophobic core are almost identical; the three phenylalanine residues and other core residues, including Val9, Leu20, Gln25, and Leu28, are tightly packed against each other and are in nearly the exact same patterns as those in the x-ray structure to form the crucial contacts responsible for stabilizing the protein native structures.
Fig. 1.
The best folded structure (red) from REMD with 0.46 Å Cα-rmsd (1.59 Å heavy-atom rmsd) compared with the x-ray crystal structure of HP35 (purple, Protein Data Bank ID code 1YRF). Both terminal residues were excluded from rmsd calculations.
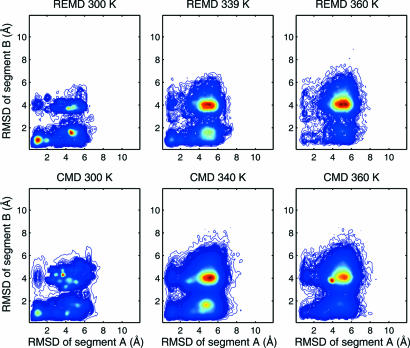
To visualize the folding landscape, we constructed two-dimensional profiles from the simulations using Cα-rmsds of two segments as the reaction coordinates. Segment A encompasses helices I and II, segment B encompasses helices II and III, and their Cα-rmsds are denoted as RA and RB, respectively. The topology of HP35 dictates that the concurrent folding of both segments ensures global folding. For comparison, we performed three additional sets of CMD simulations at 300, 340, and 360 K for, respectively, 20, 10, and 5 trajectories and 1.0 μs for each trajectory (for a combined total of 35.0 μs). The folding landscapes derived from CMD and REMD bear close resemblance at the corresponding temperatures (Fig. 2). At 300 K, both folding landscapes showed a highly populated folded state in a restricted region, a well populated but widely distributed intermediate state, and a marginally populated denatured state. The folding landscapes from CMD at 340 and 360 K were also similar to the corresponding landscapes from REMD, with a highly populated denatured state and sparsely sampled folded state. The consistency in the folding landscapes from REMD and CMD is quite encouraging.
Fig. 2.
The folding population landscapes of HP35 from REMD and CMD at 300 K, 340 K, and 360 K. The axes are the Cα-rmsds of segments A and B.
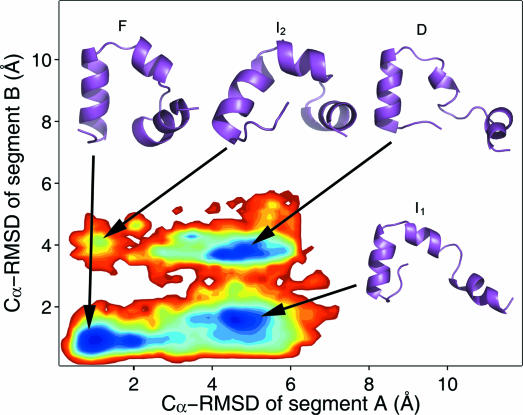
The folding free energy landscape of HP35 at 300 K was constructed from the population landscape of REMD at 300 K shown in Fig. 2. The free-energy landscapes (Fig. 3) can be divided into four distinct regions: the folded region F (RA <2.3 Å and RB <2.6 Å), the denatured region D (RA >2.3 Å and RB >2.6 Å), a major intermediate region I1 (RA >2.3 Å and RB <2.6 Å), and a minor intermediate region I2 (RA <2.3 Å and RB >2.6 Å). The lowest free energy in the F region centered at (RA = 1.1 Å, RB = 0.9 Å) was chosen as the reference point. The minimum in the I1 region centered at (RA = 4.5 Å, RB = 1.5 Å) had comparable free energy (0.0 kcal/mol). The minimum in the D region centered at (RA = 4.3 Å, RB = 3.7 Å) had slightly higher free energy (0.18 kcal/mol). In contrast, the minimum in the I2 region centered at (RA = 1.1 Å, RB = 4.1 Å) had much higher free energy (2.22 kcal/mol). Overall the free-energy landscape was rather smooth, and the span of free energy was only ≈4.10 kcal/mol. In comparison, the landscapes of the potential energy and those of the extrapolated entropy were much more rugged, and the span of energy was ≈90 kcal/mol (data not shown). This is consistent with the notion that small folding free energy is the result of the cancellation of large enthalpy and entropy contributions.
Fig. 3.
The folding free-energy landscape of HP35 at 300 K from REMD. Representative structures of the four states are shown on the figure, including the folded state (F), denatured state (D), major intermediate state (I1), and minor intermediate state (I2).
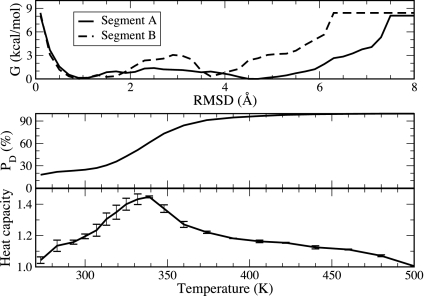
We observed two barriers that partitioned the primary folding free-energy landscape into three regions (excluding the minor intermediate I2 region). As seen in Fig. 3, the protein first needs to cross a major barrier from the denatured state (D) to the major intermediate state (I1) by folding segment B and then a minor barrier to reach the native state (F) by folding segment A. As shown in Fig. 4Top, the major barrier is 2.8 kcal/mol, and the minor barrier is 1.3 kcal/mol. This is consistent with the biexponential fitting to the (un)folding signal observed in the laser-induced temperature-jump experiments by Hofrichter and coworkers (4), which may be interpreted as a two-step folding process.
Fig. 4.
Thermodynamic properties obtained from REMD simulations. (Top) Free-energy profiles of HP35 from REMD at 300 K based on Cα-rmsd of the two segments A and B. (Middle) Population of the denatured state as a function of temperature. (Bottom) Heat capacity as a function of temperature. The first 50 ns of the simulation trajectories were excluded from the analysis. The error bars of the heat capacity were obtained by dividing the trajectories into two blocks (50–125 ns and 125–200 ns).
As temperature increased, the population of the denatured state increased monotonically (Fig. 4 Middle). We performed a fitting on the population profile based on a two-state assumption with only the denatured state and the general folded ensemble (including F and I1, discussed later). The fitting gave a folding transition temperature of Tm = 336 K, in good agreement with the experimentally derived Tm = 342 K, and an unfolding enthalpy ΔH = 15 kcal/mol, which is compared with ΔH = 27 kcal/mol from the experiment in ref. 4. Alternatively, heat capacity is a direct measure of the thermodynamic properties in protein folding. We calculated heat capacities at each of the 20 temperatures from the energy variances. It is shown in Fig. 4 Bottom that the heat capacity of HP35 peaked at 339 K, which indicated the melting temperature that is in close agreement with the experimentally derived melting temperature of 342 K (4).
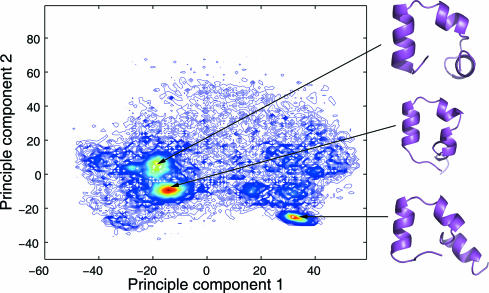
To examine the effect of the selection of reaction coordinates, we also conducted a principal component analysis (PCA) based on the Cα coordinates and constructed the free-energy profiles using the first two principal components as the reaction coordinates (Fig. 5). Although it is difficult to decouple the motions, the first principle component largely corresponded to the swing of the first helix, and the second principle component largely corresponded to the packing/unpacking of the hydrophobic core. At 300 K, there are three highly populated regions on the PCA map centered near (−18, 6), (−15, −9), and (32, −25). The corresponding representative structures are shown on the right. Although the overall Cα-rmsd varied for those representative structures (1.75, 5.92, and 4.03 Å), the segment B in all three structures were well folded, further indicating the importance of segment B in the folding of HP35.
Fig. 5.
The folding population landscape of HP35 projected to the first two principle components. Representative structures of the three highly populated regions are shown on the right.
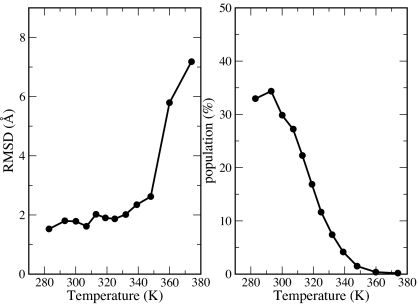
Because of the enormous reduction in the dimensionality when a free-energy profile is constructed from the multidimensional dynamics, any two-dimensional map presents an incomplete picture of the folding scenario. Alternatively, clustering analyses can potentially provide complementary information to represent this multidimensional process. At temperatures <348 K, the most populated clusters were consistently the folded clusters with Cα-rmsd ranging between 1.6 Å and 2.6 Å (Fig. 6). Thus, the native folded conformation was the most favorable at the respective temperatures. The population of the most populated cluster decreased from 34.0% at 283 K to 1.2% at 348 K. The gradual dispersion of the conformational space at higher temperatures indicates the entropic effect in temperature-induced protein unfolding.
Fig. 6.
Cα-rmsd (Left) and population (Right) of the no.1 clusters at different temperatures. The first 50 ns of the simulation trajectories were excluded from the clustering analysis. Hierarchical clustering scheme was adopted and pairwise Cα-rmsd of 2.5 Å was chosen as the cutoff for clustering. The clusters were ranked by the populations at the specific temperature.
We further examined the 10 most populated clusters at 300 K [structures shown in supporting information (SI) Fig. 7]. As shown in Table 1, the most populated cluster (Cα-rmsd = 1.8 Å) and two other clusters (8 and 9) were folded clusters. Clusters 2, 3, and 4 were partially folded, with a low Cα-rmsd for segment B (I1 state). Based on the clustering analysis, the Cα-rmsd of the folded state was ≈1.8 Å, and the Cα-rmsd of the major intermediate state was ≈4.6–5.4 Å. The population of folded cluster 1 was 29.8%, whereas the population of cluster 5 (denatured) was 2.3%. Based on the population, the free-energy difference between the folded and denatured cluster was −1.5 kcal/mol, and the native state was the most favorable conformation. In comparison, the potential energy of the system was not a good indicator of the folding because it did not include the entropic effect. As we can see from Table 1, the average potential energy of cluster 2 (partially folded) was the lowest (−645.8 kcal/mol). Highly compact denatured clusters 5 and 6 also had slightly lower potential energies (both near −643.5 kcal/mol) than folded cluster 1 (−642.6 kcal/mol). Therefore, the folded conformation was enthalpically less favorable (ΔH = 0.9 kcal/mol) but entropically more favorable (TΔS = 2.4 kcal/mol) than the denatured conformation. This underscores the entropic contribution in protein folding. Further examination of the low-energy denatured conformations showed that secondary structures were well formed, and overall structures were more compact than the native state. The over-packing rendered the favorable energy but also the much unfavorable entropy.
Table 1.
Properties of the top 10 clusters from REMD at 300 K
| Cluster ID | Population, % | rmsd, Å* | RB, ņ | Epot, kcal/mol‡ |
|---|---|---|---|---|
| 1 | 29.8 | 1.783 | 0.783 | −642.649 |
| 2 | 11.6 | 5.388 | 1.520 | −645.803 |
| 3 | 2.6 | 4.471 | 1.350 | −638.750 |
| 4 | 2.4 | 4.455 | 1.428 | −639.321 |
| 5 | 2.3 | 3.986 | 3.512 | −643.405 |
| 6 | 2.1 | 5.004 | 3.757 | −643.635 |
| 7 | 1.9 | 6.138 | 3.836 | −636.651 |
| 8 | 1.7 | 2.987 | 0.902 | −637.025 |
| 9 | 1.7 | 3.100 | 0.604 | −635.968 |
| 10 | 1.4 | 6.162 | 3.591 | −641.322 |
*Cα-rmsd compared with the x-ray crystal structure, excluding one residue from each terminus.
†Cα-rmsd of segment B (residues 15–33) compared with the x-ray crystal structure.
‡Total potential energy, including the terms of MM + GB + SA.
We conducted a second set of REMD to test the convergence and observed consistent subangstrom folding below melting temperature. The folding landscapes changed similarly when temperature increases. Furthermore, a similar heat capacity profile was also observed. Although differences in finer details did exist, the two sets of REMD simulations were reasonably consistent with each other.
Discussion
CMD and REMD are complementary. Because of its significantly enhanced sampling, equilibrium may be better achieved in the REMD for a comparable simulation effort, and some (semi-)quantitative thermodynamic information may be obtained from (long-time) REMD simulations. For example, free-energy landscapes obtained from the REMD allows for the calculation of the free-energy difference among the states and to identify plausible pathways. The REMD also allows for direct characterization of the temperature-dependent properties such as the melting curve and the heat capacity, which provide valuable avenues for direct comparisons with experiments. Yet, because the time-course information obtained from each trajectory of REMD includes transitions among replicas, it is rather difficult to obtain the information about the sequence of the events that are free from these nonphysical transitions. In a sense, the pathways identified from REMD (and from other free-energy calculations) are thermodynamic pathways. In comparison, the CMD allows the time course of the folding events to be traced, and multiple long-time trajectories can potentially provide an adequate sampling for qualitative descriptions of the folding landscapes of small proteins. Therefore, kinetic information is better obtained from the CMD. A more complete picture of the folding process emerges when the results from the CMD and REMD are combined.
From Fig. 3, it is clear to see that the primary thermodynamic folding pathway identified from the REMD simulations connects the denatured state and the native folded state through a major intermediate state (i.e., D → I1 → F). Because the barrier separating the native folded state from the major intermediate state was only 1.3 kcal/mol (Figs. 3 and 4), the native state and the major intermediate state can be readily exchanged. In this way, formation of the major intermediate state may directly lead to the native state. In the CMD simulations, all global folding leading to the native folded state went through the major intermediate state I1 before global folding. Therefore, the major intermediate state (I1) was an obligatory on-pathway folding intermediate. In comparison, the intermediate state I2 was poorly populated in the REMD simulations. The free-energy barrier between I2 and the native state was too high, so it was never sampled during the simulations. Therefore, I2 was an off-pathway intermediate. This is in agreement with the CMD simulations in which I2 was poorly sampled at 300 K and never led to the native state.
The highest free-energy barrier on the folding pathway (D → I1 → F) was the barrier separating the denatured state from the major intermediate state I1 (2.8 kcal/mol). The REMD suggests that the rate-limiting step in the folding of HP35 is to form the folding intermediate state. This is also in close agreement with the CMD results. An important structural feature of the major intermediate I1 was the formation of segment B (helices II and III). Both CMD and REMD simulations suggest that the formation of segment B is the rate-limiting step. Detailed analyses on the CMD trajectories revealed that the linker region around Pro21 folded early and was quite stable, contributing to the high stability of segment B. Therefore, the rigid Pro21 in the linker region between helices II and III plays a crucial role by restricting the movement of the two helices and is the initiation site of the folding of segment B. These observations are in agreement with the experiments, which suggests that Pro21 plays crucial roles in stabilizing the native structures (10).
We examined the roles of the solvent by conducting a set of simulations with an explicit solvent (data not shown). In the two 30-ns simulations starting from the x-ray structure, both displayed good stability with the rmsd mostly fluctuating between 0.5 Å and 2.0 Å. We further selected five representative clusters from the REMD simulation at 300 K (clusters 1, 2, 5, 7, and 9 as shown in SI Fig. 7) for 30-ns stability tests with an explicit solvent. The protein was stable for three of the conformations, with a well folded segment B (clusters 1, 2, and 9), as judged by the rmsd and the radius of gyration. However, the other two conformations, which lacked the folded segment B, displayed significant fluctuation. Consistent with the simulations with the implicit solvent, this again demonstrated the importance of segment B on the folding and stability of HP35. We expect that the further adjustment of the semifolded conformations (clusters 2 and 9) may take a much longer time, which is beyond the scope of our current study.
The calculated ΔGfolding was smaller than the experimentally derived −3.1 kcal/mol (4). Although accuracy of the underlying model (including both the force field and the solvation model) could contribute to the difference, the two-state assumption in experiments [which is inconsistent with other experiments (12)] may also be a factor. The lack of high resolution in experiments further hinders the interpretation of the results. For example, the CD signal measures the average main chain helicity, which may include partial helical structures. Clearly, better consensus on the folding mechanisms will be reached with the continuous development in both experiments and simulations.
Conclusions
We have conducted ab initio folding of HP35 by two sets of REMD and three sets of CMD simulations. Consistencies were observed between the REMD and CMD simulations, and the combination provided time-dependent kinetics and temperature-dependent thermodynamics on the folding of HP35. Subangstrom folding was achieved when temperatures were below melting temperature with the Cα-rmsd as close as 0.46 Å to the x-ray structure, and the most populated clusters were the folded clusters. Four states were identified from the folding landscape, including the folded state, denatured state, and two intermediate states. At 300 K, the typical Cα-rmsd of the folded state was ≈1.8 Å, and the typical Cα-rmsd of the major intermediate state was ≈4.6–5.4 Å. The temperature-dependent folding of HP35 was demonstrated by the shift of the folding landscape and the change of the folded population. The folding transition temperature (339 K) estimated from the heat-capacity profile agreed with the experimentally measured melting temperature (342 K).
Methods
We chose the AMBER FF03 force field (35) to represent the protein and a recently developed generalized Born model (36) to represent the solvation effect. The FF03 was developed based on quantum mechanical calculations in an organic solvent with a continuum solvent model. It has been successfully applied to the folding of a few helical peptides and proteins (37–40) as well as a series of studies on β-sheet aggregation (41–43). Through this series of tests, FF03 demonstrated improved performance compared with previous versions of AMBER force fields. It should be noted that the FF03 force-field parameters were released in 2003 (35), more than a year before the release of the x-ray HP35 structure, and the refinement of the generalized Born model parameters were performed independently by another group using a different set of charges (36), suggesting transferability of the models.
All simulations were performed by using the AMBER 8.0 simulation package (44, 45). The “sander” program was used for the CMD simulations, and the “multisander” was used for REMD simulations. The generalized-Born model was selected by setting IGB = 5 with 0.2 M salt concentration and default surface tension of 0.005 kcal/mol/Å2. The nonbonded interactions were truncated at 12.0 Å. The initial conformation was the extended chain of the wild-type HP35 polypeptide. After 1,000 steps of minimization and a 20-ps equilibration at 300 K, the conformation was then taken for the production simulations of the CMD and REMD. There were 20 replicas in the REMD, and the targeting temperatures were: 273, 283, 293, 300, 307, 313, 319, 325, 332, 339, 348, 360, 374, 390, 406, 422, 440, 460, 480, and 500 K. The time step was set to 1.0 fs. SHAKE was applied to constrain the bonds connecting hydrogen atoms (46), and the temperature was regulated by Berendsen's thermostat (47). In the first 1.0 ns, each replica was equilibrated at the target temperature. In the subsequent simulations, exchanges between neighboring replicas were attempted every 2,000 steps. Coordinates were saved every 2,000 steps. The simulations were performed for 200 ns for each REMD set (for an aggregated 8.0 μs) and for 1.0 μs for each CMD trajectory.
The x-ray crystal structure of HP35 (Protein Data Bank ID code 1YRF) was used as a reference for the calculation of rmsd. The Cα-rmsd of the whole protein (excluding terminal residues Leu1 and Phe35) was used to evaluate its global folding. The folding landscape was constructed by using two convenient reaction coordinates: the folding of segment A (residues 3–21) and segment B (residues 15–33) as measured by their respective Cα-rmsds. By overlapping helix II in the two segments, the global folding is ensured when both segments are folded.
Clustering was applied to detect populated conformations at each target temperature. Pairwise rmsd of 2.5 Å (Cα only) was chosen as the cutoff for hierarchical clustering. Heat capacity was calculated at each temperature by C = (〈E2〉 − 〈E〉2)/RT2, where E is the energy, R is the gas constant, and T is the temperature. The program “ptraj” in the AMBER package was used in the PCA.
Supplementary Material
Acknowledgments
Supercomputer time was provided by Professor Bertrum Ludaescher and the Department of Computer Science at University of California, Davis, and by the Pittsburgh Supercomputer Center (MCA06T028). We thank the AMBER development team led by Dr. D. Case, whose effort has made this work possible. The use of Pymol, VMD, ViewerPro, and Rasmol graphics packages is gratefully acknowledged. This work was supported by National Institutes of Health Grants GM64458 and GM67168 (to Y.D.).
Abbreviations
- REMD
replica exchange molecular dynamics
- CMD
conventional molecular dynamics
- PCA
principal component analysis.
Footnotes
The authors declare no conflict of interest.
This article is a PNAS direct submission.
This article contains supporting information online at www.pnas.org/cgi/content/full/0608432104/DC1.
References
- 1.Tang Y, Grey MJ, McKnight J, Palmer AG, III, Raleigh DP. J Mol Biol. 2006;355:1066–1077. doi: 10.1016/j.jmb.2005.10.066. [DOI] [PubMed] [Google Scholar]
- 2.Vardar D, Chishti AH, Frank BS, Luna EJ, Noegel AA, Oh SW, Schleicher M, McKnight CJ. Cell Motil Cytoskeleton. 2002;52:9–21. doi: 10.1002/cm.10027. [DOI] [PubMed] [Google Scholar]
- 3.McKnight CJ, Doering DS, Matsudaira PT, Kim PS. J Mol Biol. 1996;260:126–134. doi: 10.1006/jmbi.1996.0387. [DOI] [PubMed] [Google Scholar]
- 4.Kubelka J, Eaton WA, Hofrichter J. J Mol Biol. 2003;329:625–630. doi: 10.1016/s0022-2836(03)00519-9. [DOI] [PubMed] [Google Scholar]
- 5.McKnight CJ, Matsudaira PT, Kim PS. Nat Struct Biol. 1997;4:180–184. doi: 10.1038/nsb0397-180. [DOI] [PubMed] [Google Scholar]
- 6.Chiu TK, Kubelka J, Herbst-Irmer R, Eaton WA, Hofrichter J, Davies DR. Proc Natl Acad Sci USA. 2005;102:7517–7522. doi: 10.1073/pnas.0502495102. [DOI] [PMC free article] [PubMed] [Google Scholar]
- 7.Wang M, Tang Y, Sato S, Vugmeyster L, McKnight CJ, Raleigh DP. J Am Chem Soc. 2003;125:6032–6033. doi: 10.1021/ja028752b. [DOI] [PubMed] [Google Scholar]
- 8.Buscaglia M, Kubelka J, Eaton WA, Hofrichter J. J Mol Biol. 2005;347:657–664. doi: 10.1016/j.jmb.2005.01.057. [DOI] [PubMed] [Google Scholar]
- 9.Frank BS, Vardar D, Buckley DA, McKnight CJ. Protein Sci. 2002;11:680–687. doi: 10.1110/ps.22202. [DOI] [PMC free article] [PubMed] [Google Scholar]
- 10.Vermeulen W, Van Troys M, Bourry D, Dewitte D, Rossenu S, Goethals M, Borremans FA, Vandekerckhove J, Martins JC, Ampe C. J Mol Biol. 2006;359:1277–1292. doi: 10.1016/j.jmb.2006.04.042. [DOI] [PubMed] [Google Scholar]
- 11.Tang Y, Rigotti DJ, Fairman R, Raleigh DP. Biochemistry. 2004;43:3264–3272. doi: 10.1021/bi035652p. [DOI] [PubMed] [Google Scholar]
- 12.Havlin RH, Tycko R. Proc Natl Acad Sci USA. 2005;102:3284–3289. doi: 10.1073/pnas.0406130102. [DOI] [PMC free article] [PubMed] [Google Scholar]
- 13.Duan Y, Wang L, Kollman PA. Proc Natl Acad Sci USA. 1998;95:9897–9902. doi: 10.1073/pnas.95.17.9897. [DOI] [PMC free article] [PubMed] [Google Scholar]
- 14.Duan Y, Kollman PA. Science. 1998;282:740–744. doi: 10.1126/science.282.5389.740. [DOI] [PubMed] [Google Scholar]
- 15.Shen MY, Freed KF. Proteins. 2002;49:439–445. doi: 10.1002/prot.10230. [DOI] [PubMed] [Google Scholar]
- 16.Zagrovic B, Snow CD, Shirts MR, Pande VS. J Mol Biol. 2002;323:927–937. doi: 10.1016/s0022-2836(02)00997-x. [DOI] [PubMed] [Google Scholar]
- 17.Pande VS, Baker I, Chapman J, Elmer SP, Khaliq S, Larson SM, Rhee YM, Shirts MR, Snow CD, Sorin EJ, Zagrovic B. Biopolymers. 2003;68:91–109. doi: 10.1002/bip.10219. [DOI] [PubMed] [Google Scholar]
- 18.Jayachandran G, Vishal V, Pande VS. J Chem Phys. 2006;124:164902. doi: 10.1063/1.2186317. [DOI] [PubMed] [Google Scholar]
- 19.Jang S, Kim E, Shin S, Pak Y. J Am Chem Soc. 2003;125:14841–14846. doi: 10.1021/ja034701i. [DOI] [PubMed] [Google Scholar]
- 20.Ripoll DR, Vila JA, Scheraga HA. J Mol Biol. 2004;339:915–925. doi: 10.1016/j.jmb.2004.04.002. [DOI] [PubMed] [Google Scholar]
- 21.Herges T, Wenzel W. Structure (London) 2005;13:661–668. doi: 10.1016/j.str.2005.01.018. [DOI] [PubMed] [Google Scholar]
- 22.De Mori GM, Colombo G, Micheletti C. Proteins. 2005;58:459–471. doi: 10.1002/prot.20313. [DOI] [PubMed] [Google Scholar]
- 23.Carr JM, Trygubenko SA, Wales DJ. J Chem Phys. 2005;122:234903. doi: 10.1063/1.1931587. [DOI] [PubMed] [Google Scholar]
- 24.Wen EZ, Hsieh MJ, Kollman PA, Luo R. J Mol Graphics Model. 2004;22:415–424. doi: 10.1016/j.jmgm.2003.12.008. [DOI] [PubMed] [Google Scholar]
- 25.Trebst S, Troyer M, Hansmann UHE. J Chem Phys. 2006;124:174903. doi: 10.1063/1.2186639. [DOI] [PubMed] [Google Scholar]
- 26.Hansmann UHE. Chem Phys Lett. 1997;281:140–150. [Google Scholar]
- 27.Zhou R, Berne BJ. Proc Natl Acad Sci USA. 2002;99:12777–12782. doi: 10.1073/pnas.142430099. [DOI] [PMC free article] [PubMed] [Google Scholar]
- 28.Roe DR, Hornak V, Simmerling C. J Mol Biol. 2005;352:370–381. doi: 10.1016/j.jmb.2005.07.036. [DOI] [PMC free article] [PubMed] [Google Scholar]
- 29.Zhang W, Wu C, Duan Y. J Chem Phys. 2005;123:154105. doi: 10.1063/1.2056540. [DOI] [PubMed] [Google Scholar]
- 30.Pitera JW, Swope W. Proc Natl Acad Sci USA. 2003;100:7587–7592. doi: 10.1073/pnas.1330954100. [DOI] [PMC free article] [PubMed] [Google Scholar]
- 31.Jang S, Kim E, Pak Y. Proteins. 2006;62:663–671. doi: 10.1002/prot.20771. [DOI] [PubMed] [Google Scholar]
- 32.Lin CY, Hu CK, Hansmann UH. Proteins. 2003;52:436–445. doi: 10.1002/prot.10351. [DOI] [PubMed] [Google Scholar]
- 33.Kinnear BS, Jarrold MF, Hansmann UH. J Mol Graphics Model. 2004;22:397–403. doi: 10.1016/j.jmgm.2003.12.006. [DOI] [PubMed] [Google Scholar]
- 34.Kwak W, Hansmann UHE. Phys Rev Lett. 2005;95:138102. doi: 10.1103/PhysRevLett.95.138102. [DOI] [PMC free article] [PubMed] [Google Scholar]
- 35.Duan Y, Wu C, Chowdhury S, Lee MC, Xiong G, Zhang W, Yang R, Cieplak P, Luo R, Lee T, et al. J Comp Chem. 2003;24:1999–2012. doi: 10.1002/jcc.10349. [DOI] [PubMed] [Google Scholar]
- 36.Onufriev A, Bashford D, Case DA. Proteins. 2004;55:383–394. doi: 10.1002/prot.20033. [DOI] [PubMed] [Google Scholar]
- 37.Chowdhury S, Zhang W, Wu C, Xiong G, Duan Y. Biopolymers. 2003;68:63–75. doi: 10.1002/bip.10216. [DOI] [PubMed] [Google Scholar]
- 38.Chowdhury S, Lee MC, Xiong G, Duan Y. J Mol Biol. 2003;327:711–717. doi: 10.1016/s0022-2836(03)00177-3. [DOI] [PubMed] [Google Scholar]
- 39.Lei H, Duan Y. J Chem Phys. 2004;121:12104–12111. doi: 10.1063/1.1822916. [DOI] [PubMed] [Google Scholar]
- 40.Chowdhury S, Lei H, Duan Y. J Phys Chem B. 2005;109:9073–9081. doi: 10.1021/jp0449814. [DOI] [PubMed] [Google Scholar]
- 41.Wu C, Lei H, Duan Y. Biophys J. 2004;87:3000–3009. doi: 10.1529/biophysj.104.047076. [DOI] [PMC free article] [PubMed] [Google Scholar]
- 42.Wu C, Lei H, Duan Y. J Am Chem Soc. 2005;127:13530–13537. doi: 10.1021/ja050767x. [DOI] [PubMed] [Google Scholar]
- 43.Lei H, Wu C, Wang Z, Duan Y. J Mol Biol. 2006;356:1049–1063. doi: 10.1016/j.jmb.2005.11.087. [DOI] [PubMed] [Google Scholar]
- 44.Case DA, Darden TA, Cheatham TEI, Simmerling CL, Wang J, Duke RE, Luo R, Merz KM, Wang B, Pearlman DA, et al. AMBER 8. San Francisco: Univ of California; 2004. [Google Scholar]
- 45.Case DA, Cheatham TE, Darden T, Gohlke H, Luo R, Merz KM, Onufriev A, Simmerling C, Wang B, Woods RJ. J Comp Chem. 2005;26:1668–1688. doi: 10.1002/jcc.20290. [DOI] [PMC free article] [PubMed] [Google Scholar]
- 46.Ryckaert JP, Ciccotti G, Berendsen HJC. J Comp Phys. 1977;23:327–341. [Google Scholar]
- 47.Berendsen HJC, Postma JPM, van Gunsteren WF, Dinola A, Haak JR. J Chem Phys. 1984;81:3684–3690. [Google Scholar]
Associated Data
This section collects any data citations, data availability statements, or supplementary materials included in this article.


