Abstract
Ion mobility spectrometry (IMS) has been explored for decades, and its versatility in separation and identification of gas-phase ions is well established. Recently, field asymmetric waveform IMS (FAIMS) has been gaining acceptance in similar applications. Coupled to mass spectrometry (MS), both IMS and FAIMS have shown the potential for broad utility in proteomics and other biological analyses. A major attraction of these separations is extremely high speed, exceeding that of condensed-phase alternatives by orders of magnitude. However, modest separation peak capacities have limited the utility of FAIMS and IMS for analyses of complex mixtures. We report 2-D gas-phase separations that join FAIMS to IMS, in conjunction with high-resolution and accuracy time-of-flight MS. Implementation of FAIMS/IMS and IMS/MS interfaces using electrodynamic ion funnels greatly improves sensitivity. Evaluation of FAIMS/IMS/TOF performance for a protein mixture tryptic digest reveals high orthogonality between FAIMS and IMS dimensions, and hence the benefit of FAIMS filtering prior to IMS/MS. The effective peak capacities in analyses of tryptic peptides are ~500 for FAIMS/IMS separations and ~106 for 3-D FAIMS/IMS/MS, providing a potential platform for ultrahigh-throughput analyses of complex mixtures.
Among the greatest challenges of analytical chemistry today is characterizing samples of enormous complexity associated with systems biology research. For example, mammalian proteomes can comprise >20,000 different proteins even before counting post-translational modifications, and sequence and splicing variants.1 A proteolytic digestion of such a mixture following standard protocols of bottom-up proteomics1 would yield >106 distinct peptides, and more if missed cleavage sites due to the inevitable imperfections in enzyme activity are considered. Individual peptides are commonly identified and quantified using mass-spectrometry (MS) that offers excellent sensitivity, specificity, and dynamic range.1 However, no technique can presently characterize a significant percentage of the constituents in such a complex sample without extensive prior separations, and direct MS analyses generally identify with confidence only the most abundant proteins. “Top-down” analyses at the intact-protein level have similar limitations.
Accordingly, combinations of various separation techniques with MS have become preeminent bioanalytical technologies. The separations have conventionally been performed in condensed phases (e.g., liquid chromatography,2 LC, or capillary electrophoresis,3 CE, and gel techniques4). Single separation stages can provide peak capacities2 of ~102 – 103. This level is insufficient for many challenging applications: in a mixture of ~106 components, a separated fraction would still comprise ~103 – 104 co-eluting species on average, and substantially more in some cases. Hence large-scale proteomics often involves multidimensional separations using two or more different stages, followed by MS characterization. The best-established approach involves 2-D gels,4,5 where an isoelectric focusing (IEF) separation by isoelectric point is followed by electrophoretic (SDS-PAGE) separation by molecular size. Among liquid-phase separations, a combination of strong-cation exchange LC and reversed-phase (RP) LC (in one implementation known as MudPIT6–8) has gained broad acceptance.9–12 Other useful 2-D separations comprise anion exchange/RPLC,13 size-exclusion chromatography/RPLC,14 and other LC/LC combinations,15 RPLC/CE16,17 and micellar electrokinetic chromatography/CE,18 and CE/CE methods (e.g. IEF coupled to isotachophoresis/zone electrophoresis).19 Two-dimensional approaches can provide peak capacities of ~103 – 104 for proteolytic digests.5 Separations with additional dimensions, including combinations of methods at the intact protein and peptide level (i.e., with intermediate enzymatic digestion) can provide yet greater total peak capacities.
While 2-D condensed-phase separations are exceptionally powerful, they generally require ~10 hrs to several days,4–7 and longer if further dimensions are added. Such throughput effectively precludes many lines of biomedical research.
Physically, any separation derives from an unequal motion of different species in some medium, so the speed of condensed phase methods is inherently limited by the achievable molecular velocities. Typical velocities in gases are higher by orders of magnitude, enabling proportionally faster separations. Thus, the need for higher throughput has focused attention on electrophoretic separations in the gas phase which proceed ~103 – 104 times faster than those in condensed phases - on a time scale of milliseconds to seconds. These methods are ion mobility spectrometry (IMS)20–32 and field asymmetric waveform IMS (FAIMS)33–39, based on absolute and differential ion mobilities, respectively.
In IMS, ions travel through a fixed path inside an enclosure (typically a tube) filled with a non-reactive gas under the influence of a moderate electric field, E, created by voltages applied to surrounding electrodes. The measurement of drift velocity, v, determines the ion mobility, K:
| (1) |
The raw mobility derived from eq. (1) is normally converted to reduced mobility, K0, by adjusting the buffer gas pressure (P, Torr) and temperature (T, Kelvin) to standard conditions:
| (2) |
The mobility is related to orientationally averaged collision cross-section (rigorously the 1st-order collision integral) of the ion and gas molecule via the Mason-Schamp equation40 (3):
| (3) |
where z is the ion charge state, N is the gas number density, μ is the reduced mass of the ion/gas molecule pair, and k is the Boltzmann constant. The quantity for any collider pair can be computed using various treatments.41–43 This capability enables structural elucidation of ions by comparing mobilities calculated for candidate geometries with measurements.24,25,27,28,41–44
In FAIMS, ions are separated exploiting the dependence of ion mobility on the electric field. In pure gases, the K(E) function may be expressed36 as infinite series:
| (4) |
Terms beyond b(E/N)4 are generally insignificant at practical field intensities. The form of K(E) in heteromolecular gases is more complex, and FAIMS process in mixed and vapor-containing gas buffers is still not understood well.38,39 As E increases, K(E) may increase (A type ions), decrease (C type ions), or first increase and then decrease at still higher E values (B type ions).35 This phenomenon permits separating ions by the difference between mobilities at high and low E. In FAIMS, a periodic asymmetric waveform creates a time-dependent potential UD(t) in the analytical gap between a pair of electrodes (that may form a parallel planar, coaxial cylindrical, or concentric spherical geometry). The integral of UD(t) over period is null, but time-averaged positive and negative voltages differ. This waveform pushes all ions in the gap towards one of the electrodes where they are destroyed by neutralization. Selected ion species can be prevented from drifting towards either electrode and centered in the gap by a constant compensation voltage (CV) that, when co-applied with UD(t), cancels the net ion drift due to UD(t). The CV value depends on the species, and scanning CV yields a FAIMS spectrum of the ion mixture.
IMS was introduced in 1970’s as a portable economical alternative to MS for detection of airborne volatiles, e.g. environmental and industrial process contaminants, explosives, chemical warfare agents, and drugs.20–23 Over the last decade, two major technical developments have raised and broadened the analytical importance of IMS: (i) the effective coupling of IMS to MS,24 especially the advent of IMS/TOF instrumentation that enables a parallel dispersion of ion mixtures in mobility and mass/charge (m/z) dimensions,29,30 and (ii) interfacing of ESI and MALDI soft-ionization sources to IMS45 and IMS/MS,25,28 which has enabled many biomedical applications. Similarly for FAIMS, coupling to MS and ESI/MS35 has opened a range of environmental and biological applications.37
While FAIMS and IMS are extremely fast, their resolving power is limited: typically ~10 – 30 for FAIMS46 and ~50 – 200 for IMS.47–50 These values are obviously too low for complex biological mixtures, especially since IMS is only partially orthogonal to MS, and thus the useful peak capacity of IMS/MS is less than the product of individual IMS and MS peak capacities.51,52 The total peak capacity can be increased by adding a condensed-phase separation (e.g., RPLC) prior to FAIMS53 or IMS.31,54 While this hybrid 2-D strategy has merits, invoking a condensed-phase stage necessarily decreases the throughput significantly. It also restricts the analyte matrixes to those compatible with the condensed-phase technique, a well-known limitation of LC/ESI/MS.
Here we report the first gas-phase ion separations in two dimensions, achieved by joining FAIMS and IMS stages followed by TOF MS, and demonstrate the utility of FAIMS/IMS/MS for high-throughput analyses of complex mixtures.
EXPERIMENTAL METHODS
Key features of the IMS/MS platform with ion funnel interfaces
The new ESI/FAIMS/IMS/MS system (Fig. 1) was constructed using a previously detailed IMS/MS platform.55,56 Concisely, it consists of an IMS drift tube and a TOF MS interfaced using an electrodynamic ion funnel.57 The drift tube is a modular assembly of identical units, which provides a variable IMS length and ease of construction.56 Each unit comprises a housing with a stack of ring electrodes inside and vacuum flanges on both ends. Units are electrically insulated from each other by spacers and vacuum-sealed on O-rings. All IMS electrodes are consecutively connected via a resistor chain. The median ring of each unit is electrically shorted to its chamber, to minimize the voltage difference between any adjacent surfaces inside the IMS. This maximizes the IMS operating voltage achievable without electrical breakdown of the buffer gas. The present design includes 10 units with total length of 210 cm; further lengthening by adding units is straightforward.56 The drift voltage is generated by a high-voltage power supply and monitored by a custom probe. That voltage is applied to the first electrode and equally partitioned across the drift tube by a resistor chain. The drift tube is continuously filled with buffer gas, here dry N2. The pressure inside is controlled by a valve and monitored using the two capacitance manometers on the drift tube and preceding source chamber (Fig. 1).
Fig. 1.
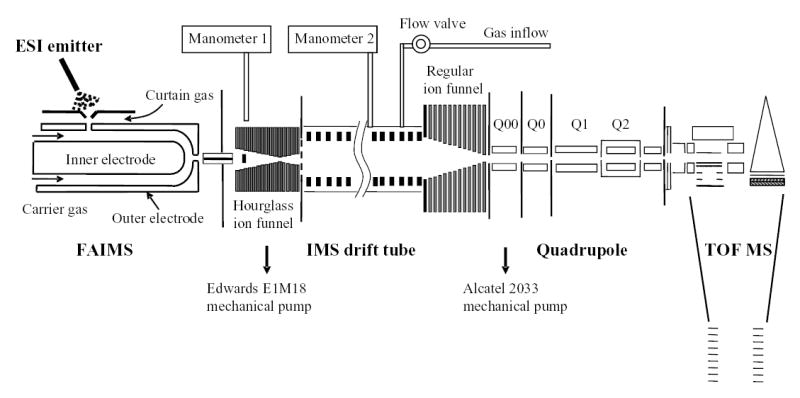
Schematic of the ESI/FAIMS/IMS/Q-TOF MS instrumentation.
Ion packets separated by IMS are analyzed by a Q-TOF (Sciex Q-Star) modified by removal of curtain gas-orifice interface and the addition of a small differentially pumped chamber Q00, housing a short quadrupole (Fig. 1). This stage is needed to maintain a low gas pressure in the next collisional cooling quadrupole (Q0), else excessive ion transit times through that region would degrade the IMS separation.56 The IMS and TOF pulsing sequences are integrated under the command of custom software that provides overall instrument control. This utility also receives data streaming from the TDC, converts them into 2-D IMS/MS frames, and histograms those into final IMS/MS maps.
The principal design feature is an ion funnel at the IMS terminus with the acceptance orifice approximately matching the IMS electrode aperture. The funnel consists of a stack of ring electrodes carrying an axial dc gradient, with opposite phases of a harmonic rf potential co-applied to neighboring electrodes.57 The ring apertures narrow along the stack, in the direction of ion motion through the funnel. Then ion packets entering the funnel are propelled axially by the dc field, while confined radially by the rf field. Ion funnels were extensively evaluated in various ESI/MS interfaces at ~1 – 10 Torr pressure, and proven to radially compress ion beams while providing a near-100% ion transmission over a broad m/z range.57,58 At API/MS interfaces, the gas dynamics caused by abrupt pressure drop from 1 atm to a few Torr limits the conditions for effective rf focusing in the funnel. The gas dynamics at IMS terminus is relatively insignificant, because (i) the pressure drop from IMS to MS is ~two orders of magnitude lower than that from API to MS and (ii) the funnel precedes the drop instead of being in the turbulent region after it. Therefore an ion funnel should be yet more effective at the IMS/MS interface. The present configuration achieves essentially perfect transmission through the IMS and into MS, even for IMS as long as 210 cm.56 Crucially, ion focusing in the funnel does not affect the IMS separation, in terms of either resolution or absolute mobility measured.56
Ions arriving from the source are conveyed into IMS by another ion funnel. Unlike those at API/MS interfaces elsewhere,57,58 the funnel leading to IMS must deliver discrete ion packets. With a continuous ion source such as ESI or ESI/FAIMS, high ion utilization requires an effective accumulation of ions between IMS pulses and their swift ejection into the drift tube, which calls for a substantial ion storage volume. Hence the funnel at IMS entrance is of the novel “hourglass” shape, with the conductance limit to IMS in the middle followed by a volume of several cm3 where ions are parked behind a mesh while the IMS gate is closed.55,56 The funnel features a jet disrupter that suppresses the turbulent gas flows hindering rf ion focusing.55,56,59
The FAIMS/IMS arrangement
The previous IMS/MS platform55, 56 summarized above was augmented by a FAIMS stage between the ESI source and IMS, enabling 2-D FAIMS/IMS separations. The FAIMS (Selectra, Ionalytics, Ottawa, Canada) was modified as described below. It comprises the electrode set effecting ion separation and the power unit that supplies requisite asymmetric waveform, including UD(t) (the sum of 0.75 and 1.5 MHz harmonics with 2:1 amplitude ratio) and CV, to the electrodes. The two electrodes are arranged in the coaxial cylinder geometry with hemispherical terminus.37,60 In the cylindrical region, the analytical gap width (gC) is 2 mm, defined by the internal electrode of OD = 16 mm and external electrode of ID = 20 mm. At the terminus, gH may be varied from 1.7 to 2.7 mm in 0.1 mm increments by translation of the inner electrode.61 This provides control of the FAIMS resolution that can be increased at the cost of sacrificing analytical sensitivity.46,61 Similarly to Guevremont et al.,61 we find the FAIMS sensitivity and resolution to maximize at gH = 2.0 mm and 2.5 – 2.6 mm, respectively, but the ion signal at gH ≥ 2.5mm is quite low. As a compromise, all measurements reported here are for gH = 2.3 mm.
Ions are generated using a nano-ESI emitter made by pulling sections of fused silica capillary (50-μm ID/150-μm OD, Polymicro Technologies, Phoenix, AZ) with a butane torch. Samples are infused at 0.4 μL/min by a microsyringe driven by a syringe pump (kd Scientific, Holliston, MA). The emitter is mechanically adjustable with respect to the ion inlet on the side of outer FAIMS electrode. The inlet uses a gas curtain-orifice design, where ions are desolvated in a counter flow of dry N2 while pulled into the sampling orifice by an electric field. Another stream of the same gas carries desolvated ions along the analytical gap through FAIMS. The total gas flow is regulated by the flow controller at 2 L/min.
Separations in FAIMS may utilize various gas buffers, with the choice strongly affecting the outcome.39,62 Most early work has employed pure gases (primarily air or N2), but FAIMS resolution and sensitivity often improve in gas mixtures where high-field ion mobilities exhibit a strong non-Blanc behavior.39,63 In particular, the 1:1 He/N2 mixture has proven a good choice for most analytes including protein digests,39,53,63,64 and is used here.
The outer FAIMS electrode is coupled to the capillary inlet (0.43 mm ID) into hourglass ion funnel (Fig. 1) using a custom peek adapter, with an ~0.5 mm air gap left for electrical insulation and to permit the outflow of excess FAIMS gas. Since the ions generated in ESI are already desolvated when injected into FAIMS and further by field heating inside, the capillary need not be heated and is held at room temperature.
All the components preceding the IMS, including both the Selectra electrodes and power supply, are electrically floated on the IMS drift voltage.65 This was implemented by floating all relevant ac and dc power supplies, with the high-voltage ac input supplied by an isolation transformer.56 Since the (grounded) control PC cannot communicate with a floated FAIMS via electrical cables, those were replaced by optical cables.65 For electrical isolation and safety reasons, the FAIMS power unit is enclosed in an insulating container secured inside a grounded metal cage surrounding the entire ESI/FAIMS/IMS system. Referenced to the floating voltage, the typical dc potentials on elements preceding IMS are: ESI needle (~2.0 kV), capillary (200 V), funnel entrance aperture (190 V), jet disrupter (~170 V), funnel exit aperture (40 V). These values are somewhat lower than those in the ESI/IMS/MS platform,56 because of the upper limit on Selectra electrode bias. Accordingly, the dc field in the funnel decreases to ~15 V/cm, well within the operational range. As the IMS gate voltages in “open” and “closed” states must bracket the bias of last funnel plate, those were also reduced to 25 V and 52 V, respectively. All above voltages are for positive ions and should be reversed for negative ion analyses. The voltages on elements of IMS and IMS/MS ion funnel remain as in the earlier ESI/IMS/MS platform.56
Instrumental evaluation procedure
The performance of ESI/FAIMS/IMS/MS system was tested using a digest of a pool of 11 common proteins (covering the mass range of 11 – 116 KDa that is representative of typical proteomes) mixed with 19 typical peptides (Table 1). The protein mixture was denatured in urea and thiourea, reduced by dithiothreitol, diluted 10x in 100 mM ammonium bicarbonate, and digested by trypsin (Promega, Madison, WI) in a 1:50 enzyme : protein ratio. Ideally, this would produce 401 tryptic peptides. The digest was cleaned using a C18 SPE column (Supelco, Bellefonte, PA), combined with a solution of 19 peptides, and dissolved in 50:49:1 methanol : deionized water : acetic acid to the concentrations listed in Table 1. All peptides and proteins used are available from Sigma (Table 1), and solvents are HPLC grade (Fisher Scientific).
Table 1.
Sample used for FAIMS/IMS/MS evaluation: components, Sigma catalog ##, and final concentrations of peptides and protein digests (mg/ml). Digested proteins are in boldface.
| Proteins and Peptides | Cat. # | Conc. |
|---|---|---|
| bovine serum albumin | A7368 | 0.195 |
| bovine carbonic anhydrase | C3934 | 0.200 |
| bovine beta-lactoglobulin | L3908 | 0.196 |
| bovine serotransferrin | T1408 | 0.194 |
| rabbit glyceraldehyde-3-phosphate dehydr. | G2267 | 0.198 |
| E. coli beta-galactosidase | G5635 | 0.204 |
| bovine alpha-lactalbumin | L6010 | 0.195 |
| equine skeletal muscle myoglobin | M0630 | 0.200 |
| chicken ovalbumin | A2512 | 0.198 |
| bovine cytochrome c | C2037 | 0.198 |
| rabbit phosphorylase b | P6635 | 0.198 |
| bradykinin fragment 2–9 | B1901 | 0.003 |
| des pro ala bradykinin | B4791 | 0.018 |
| bradykinin | B3259 | 0.048 |
| try bradykinin acetate salt | B4764 | 0.012 |
| fibrinopeptide A | F3254 | 0.006 |
| Tyr c peptide | C9781 | 0.018 |
| osteocalcin fragment 7–19 human | O3632 | 0.006 |
| syntide 2 | S2525 | 0.028 |
| leptin fragment 93–105 human | L7288 | 0.015 |
| [ala92]-peptide 6 | P7967 | 0.008 |
| ProteoMassäP14R MALDI-MS standard | P2613 | 0.005 |
| vasoactive intestinal peptide fragment 1–12 | V0131 | 0.014 |
| diazepam binding inhibitor | G9898 | 0.009 |
| epidermal growth factor receptor fragment | E9520 | 0.006 |
| 3X FLAG®peptide | F4799 | 0.003 |
| presenilin-1 N-terminal peptide | P2490 | 0.214 |
| dynorphin A porcine fragment 1–13 | D7017 | 0.062 |
| neurotensin | N6383 | 0.017 |
| angiotensin | A9650 | 0.024 |
The experimental sequence is illustrated in Fig. 2. First, an ion mixture is separated in FAIMS dimension only by Selectra operated in the CV scan mode (at the speed of 5 V/min), with IMS in the continuous transmission regime (entrance gate permanently open).56 This yields a CV spectrum usual for FAIMS/MS experiments.37 Then IMS is switched to regular operation (gate opened periodically to release ion packets), and a sequence of 2-D IMS/MS maps is acquired with Selectra stepping through a number of designated CVs with set dwell times (Fig. 2). Here, the whole CV range revealed in FAIMS is traversed with an ~1 V increment. In the end, the experiment yields a data set in three dimensions: CV, drift time, and m/z.
Fig. 2.
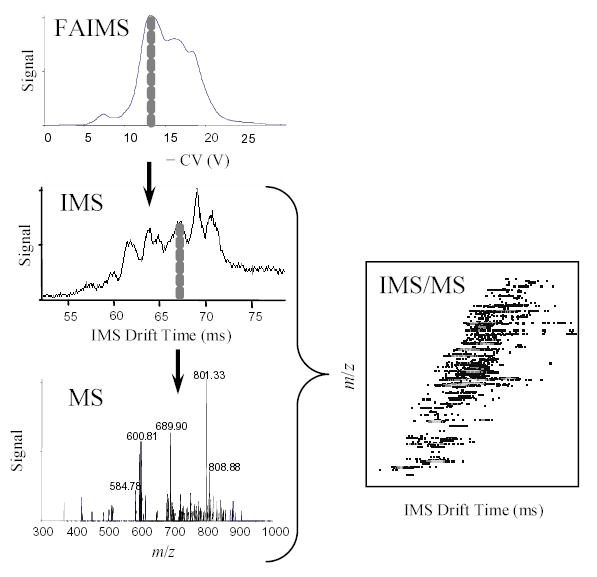
Diagram of the FAIMS/IMS/MS experimental sequence.
The upper limit of measurable m/z range (in any mode) is proportional to the TOF cycle period squared, but faster cycling improves the throughput and ion utilization efficiency. So one would choose the shortest period that still covers the full m/z range of analyzed ion mixture. The highest m/z observed with present sample is ~1100, allowing the period of 100 μs that corresponds to m/z up to ~1140. Some data were acquired with the 143 μs period that reveals m/z up to ~2200, to ensure that higher m/z were not missed.
The gas pressure in IMS was 4.00 ± 0.03 Torr. To maintain the buffer composition in IMS (N2) differing from that in FAIMS (1:1 He/N2), a gas flow out of the drift tube towards the ion source is critical.56 This is ensured by keeping the pressure in inlet funnel slightly (~30 mTorr) below that in IMS.56 The IMS pulsing period is generally set beyond the longest drift time of any analyte (here ~100 ms), else ions originating from different pulses may mix in the drift tube. However, when all species present have mobilities (and thus drift times) within a known limited range as happens for tryptic peptide ions generated by ESI, the throughput and sensitivity may be raised by multiplexing ion packets in the drift tube. This is employed here to a modest extent, with IMS period of 50 ms. To avoid a peak broadening in IMS, the injection pulse should be significantly shorter than the greater of diffusional peak width and detector channel width (i.e., the TOF cycle period).66 Considering that the diffusional peak width in these experiments was ~0.5 – 1 ms and the TOF period was < 0.14 ms, we chose the pulse duration of 0.1 ms. Under present conditions, the IMS resolving power is ~100 for singly-charged ions.56
RESULTS
Characteristics of FAIMS/IMS/MS measurements
Peptides of all charge states behave as C-type ions in FAIMS with either N2 or 1:1 He/N2 buffer,53,63 and thus are analyzed in the “P2” mode where both the dispersion voltage (DV) and CV are negative.35 Here we use DV = 4 kV, the maximum DV amplitude available, which typically provides the best separations. The CV spectrum obtained under these conditions is shown in Fig. 3. The spectrum spans the { 6 V; 28 V} range, in agreement with findings for other tryptic digests: { 7 V; 35 V} for a mixture of 13 proteins63 and { 8 V; 25 V} for that of other 8 proteins.53
Fig. 3.
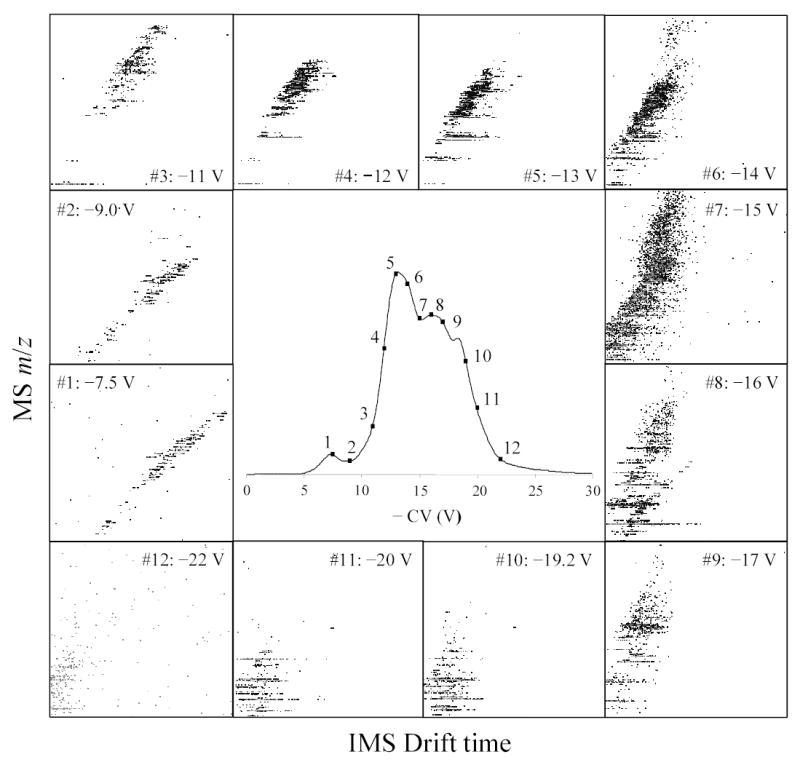
FAIMS CV spectrum for the test analyte mixture (central panel), and IMS/MS maps at 12 (out of 16 measured) CV values across the spectrum, as labeled (panels 1 – 12). All maps are for IMS drift times of 50 – 100 ms (horizontal axes) and m/z of 400 – 1200 (vertical axes). The four maps not shown were acquired at CV = 12.2, 12.5, 17.5 and 20.8 V.
The CV-selected IMS/MS maps were obtained for 16 CVs between 7.5 V and 22 V - the range of FAIMS spectrum with significant intensity (Fig. 3). Agglomeration of these maps creates a global IMS/MS map that is typical of tryptic digests in ESI/IMS/TOF studies (Fig. 4).49,54 All 16 maps were processed to pinpoint spots that correspond to distinct ions, with charge states determined from the MS isotopic pattern. We found ~10 – 70 spots per map depending on signal intensity at a particular CV, with at least ~360 unique spots out of >600 total (Fig. 5). By general location of spots, the maps in Fig. 3 fall into three groups: I for │CV│ of < 10 V, II for ~ (11 – 17) V, and III for > 18 V. Virtually all peptides in group I (~100 unique spots) have z = 1, while in II (~200 unique spots) and III (~60 unique spots) most have z = 2 and some have z = 3. This pattern is consistent with the known charge state separation of peptides in FAIMS.53,63,67
Fig. 4.
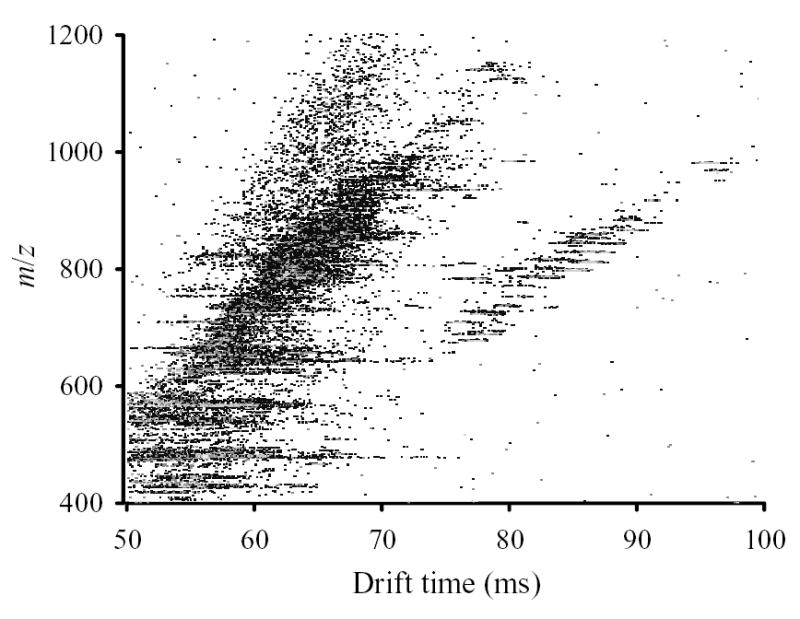
Summary IMS/MS map of test analyte compiled from CV-selected maps.
Fig. 5.
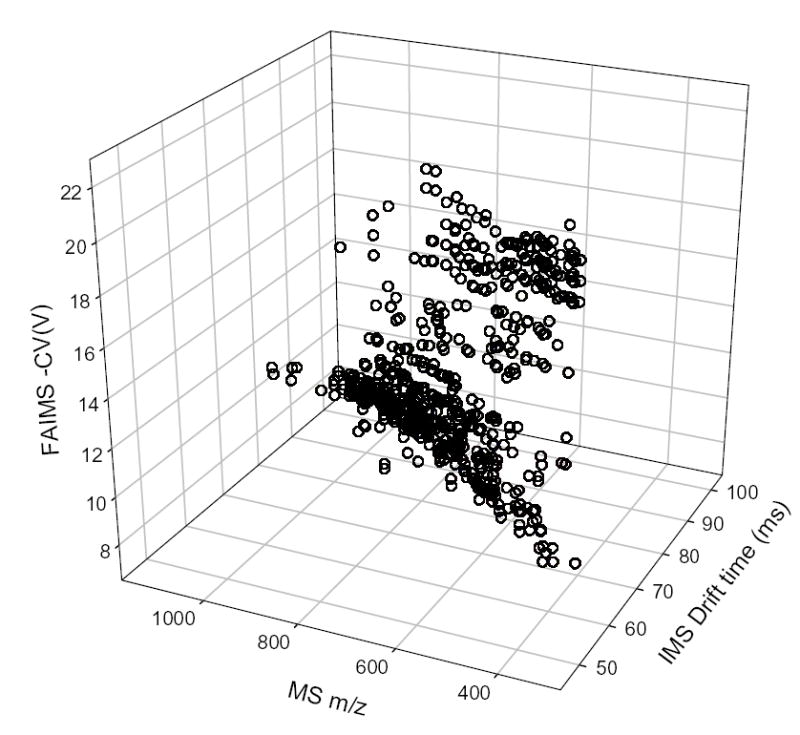
Dispersion of distinct peptide identified in 3-D FAIMS/IMS/MS space.
As tryptic peptides with z = 1 and z ≥ 2 occupy different parts of IMS/MS separation space,49,54 naturally the maps of groups I and II grossly differ (Fig. 3). This might suggest that FAIMS pre-fractionates species that would be distinguished in IMS anyway, i.e. that FAIMS and IMS separations are not orthogonal. If this were true, adding FAIMS to IMS/MS would serve no purpose. To understand this crucial issue, one should compare the actual spots in maps within each group. For example, maps #1 and #2 of group I (Fig. 3) contain 71 and 47 distinct ions, respectively. These spots occupy essentially the same separation space in the two maps. This is not surprising as, with any IMS buffer gas, the standard deviation of representative singly-charged tryptic peptides from the linear regression in IMS/MS graphs51,52,68 is ~3 – 3.5%, with extreme deviations of ~10%. (Combined data from maps #1 and #2 exhibit similar statistics.) However, only 10 out of 118 total spots coincide within (liberally expanded) 2-D error margin of IMS/MS measurement and hence may be common (Fig. 6). Similarly, spots in maps #6 and #9 of group II for doubly-charged peptides cover nearly the same area (Fig. 3). However, none of the spots identified in map #9 is found in map #6 (Fig. 6). These results clearly bear out the analytical benefit of FAIMS filtering prior to IMS/MS analyses.
Fig. 6.
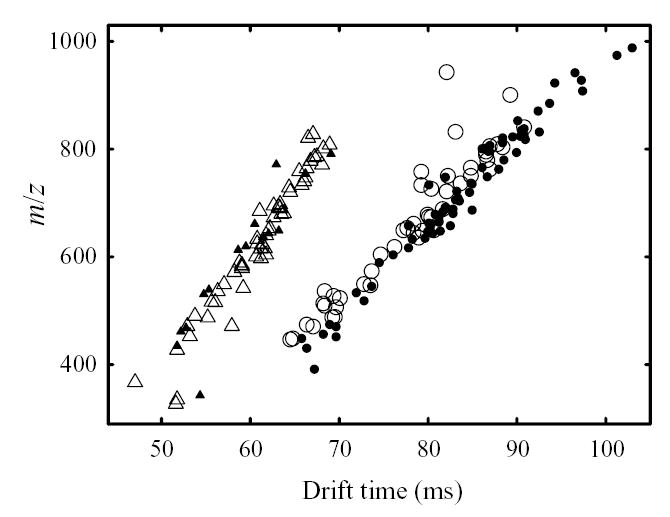
Distinct species (deisotoped data) found in selected IMS/MS maps of group I (circles, empty for CV = 7.5 V and filled for 9 V) and group II (triangles, empty for CV = 14 V and filled for 17 V).
The selection of CVs depends on experimental priorities. First, one may seek to cover the whole CV spectrum or focus on a specific range, e.g. that encompassing doubly-charged peptide ions.53 Second, one may choose a denser CV sampling grid for maximum coverage, or a sparser one for higher throughput. A low overlap between the spots in some IMS/MS maps of the same group raises the question of CV grid density needed for good coverage. Maps #6 and #9 with zero overlap differ by 3.0 V in CV, and maps #1 and #2 with 8% overlap differ by 1.5 V. As expected, maps at more closely spaced CVs have a more similar content: the fraction of shared spots increases to ~60% for a difference of 1 V (maps #6 and #7), ~85% for 0.75 V (e.g., maps #10 and #11), and ~95% for 0.2 V (maps not shown). Hence, 1 V is a reasonable CV step, though a slightly denser grid may be desired to ensure complete sample coverage and define the CV for each species more precisely.
For maximum coverage, the CV step should be somewhat smaller than full width at half maximum (fwhm) of CV peaks for individual ions. Generally the peaks in a CV spectrum broaden at higher absolute CV.69 For example, mean fwhm and standard deviations in present FAIMS data at CV = 7.5, 13, and 20.5 V are respectively 0.65 ± 0.15 V, 1.1 ± 0.15 V, and 2.5 ± 0.7 V: fwhm roughly scales with │CV│. (Absolute values should not be compared to previous reports63 because of different FAIMS geometries.) The peak broadening at higher │CV│ increases the correlation between IMS/MS maps measured at equal CV spacing, e.g. maps at CV of 19.2 and 20.7 V share ~65% of spots vs. ~10% in maps at 7.5 and 9 V that also are 1.5 V apart. A more sophisticated strategy would be to use CV step sizes that vary with CV in proportion to the typical fwhm of the ions of interest. In particular, a constant relative CV step could be employed.
The orthogonality between FAIMS and IMS and the overall peak capacity of separations
To explore the orthogonality between dimensions of FAIMS/IMS/MS further, we collapsed the 3-D plot in Fig. 5 onto constituent 2-D planes. The projection on IMS/MS plane showing a clear separation of singly- and multiply-charged peptides along different trend lines (Fig. 4) is well-known.49,54 The projection on FAIMS/MS plane (Fig. 7a) is also similar to previous findings,53,63,67 and shows essentially no correlation between CV and m/z values. Separations in the FAIMS and IMS dimensions are also substantially independent (Fig. 7b), though there is a modest correlation as peptides with z = 1 tend to have both lower mobility and lower │CV│ than those with z ≥ 2. It remains to be seen whether that correlation is general or specific to peptides. Regardless, there is no obvious correlation for ions of any particular charge state, including z = 1.
Fig. 7.
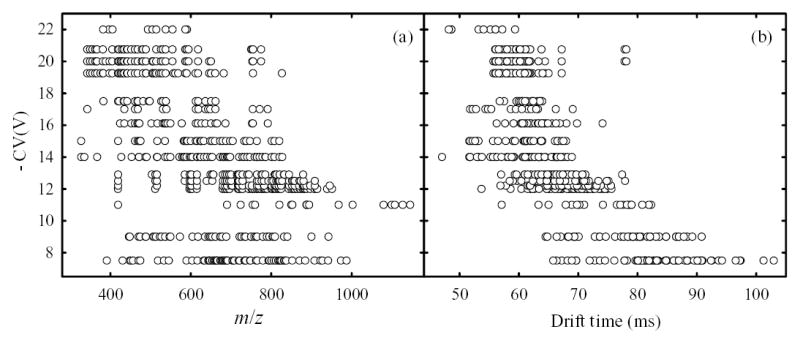
Dispersions of distinct peptide spots in the FAIMS/MS (a) and FAIMS/IMS (b) planes confirm the orthogonality of FAIMS separations to MS and IMS.
Fundamentally, IMS and FAIMS should be substantially orthogonal: IMS measures mobility while FAIMS measures its derivative with respect to electric field, and a function and its derivative are not a priori correlated. This surmise was supported by comparison of FAIMS and IMS data for a limited set of peptide ions.67 Experiments combining FAIMS with energy-loss measurements led to the same inference70,71 and also suggested a similar orthogonality between FAIMS and IMS for intact proteins.71 This work shows that orthogonality directly and harnesses it to boost the overall peak capacity and specificity obtainable using gas-phase separations.
The peptides studied here were spread over a CV space of ~20 to 25 V, with the mean peak fwhm of ~1 – 1.5 V. Hence, the FAIMS peak capacity is ~15 – 20. The IMS separation space occupied at any CV is ~20 – 30 ms, and thus the effective peak capacity (given the present IMS peak width of ~0.6 – 1 ms) is ~30. Therefore, the FAIMS/IMS 2-D peak capacity (adjusted for the correlation between two dimensions) is ~500, which is comparable to high quality 1-D LC separations requiring several hours.2 In contrast, a FAIMS/IMS analysis may (if signal intensity is sufficient) be completed within a single FAIMS scan that, for a CV range of 25 V, may require less than a minute. Indeed, in 50 s one can step through 25 CV values with 1 V increments and 2 s dwell times, acquiring 40 elementary IMS/MS frames during each (i.e., using 50 ms IMS period). This suggests the possibility of an orders-of-magnitude acceleration of analyses using FAIMS/IMS/MS compared to LC/MS.
CONCLUSIONS
We have developed and demonstrated two-dimensional gas-phase ion separations prior to MS by combining FAIMS and IMS. The desirability of such a combination had been noted,67,72,73 but coupling FAIMS to IMS/MS has been impractical because of low sensitivity arising from a combination of relatively low duty cycle of FAIMS (due to its filtering nature), significant ion losses at the ESI/IMS interface, and additional major losses (>90% and often >99%) at the IMS/MS junction.56 The present FAIMS/IMS is integrated and interfaced to MS using ion funnels that provide an essentially lossless ion transmission from the IMS drift tube to the MS.56 This potentially raises the sensitivity of FAIMS/IMS/MS to that of FAIMS/MS without IMS.
The present ESI/FAIMS/IMS/MS peptide analyses show a substantial orthogonality between FAIMS and IMS separations, thus establishing the value of adding a FAIMS prior to IMS/MS. The 2-D FAIMS/IMS peak capacity for tryptic peptides is ~500, which is comparable with high quality condensed phase separations that are orders of magnitude slower. With the present TOF MS peak capacity of ~104, assuming only 20% independence between IMS and MS dimensions, the 3-D FAIMS/IMS/MS peak capacity is ~500 × 0.2 × 104 = 106. Even higher peak capacities, conservatively 1000 – 1500 for FAIMS/IMS and ~5 × 10⁶ for FAIMS/IMS/MS, would be feasible using an IMS with the maximum reported resolving power (>150 for singly charged ions47–50) and/or a FAIMS with somewhat higher resolution (e.g., achieved via mechanical or operational modifications46 or analyte-specific optimization of buffer gas composition38,39) in conjunction with the higher MS resolution obtainable from state-of-the-art orthogonal TOF instrumentation.
Tryptic peptide ions derived from ESI constitute a set of low chemical and structural diversity spanning a limited m/z range. More diverse mixtures (e.g., including metabolites, nucleotides, lipids, or whole proteins) inhabit a broader separation space in both FAIMS and IMS dimensions,74,75 resulting in peak capacities up to ~4000 for FAIMS/IMS (~25 for FAIMS × ~160 for IMS) and ~2 – 3 × 10⁷ for FAIMS/IMS/TOF. Thus, the utility of FAIMS/IMS/MS platform extends to applications well beyond bottom-up proteomics, e.g., characterization of gas-phase macromolecular conformations (to be described elsewhere).
Finally, the FAIMS/IMS combination does not have to be coupled to MS, but may be operated with a Faraday cup or other detector, as in existing stand-alone FAIMS or IMS devices. The advantage of FAIMS/IMS over either FAIMS or IMS in achievable resolution and peak capacity will allow addressing many specificity challenges faced by present FAIMS or IMS analyses (e.g., for detection of volatiles), while retaining the benefits of atmospheric-pressure operation without MS: small footprint, light weight, ruggedness, and low cost. This may make FAIMS/IMS attractive for many field applications.
Acknowledgments
The authors thank Dr. R. Guevremont, Dr. R. Purves, and others at Ionalytics for their continued guidance on the operation of the Selectra FAIMS system and sharing unpublished work, G. Anderson, M. Buschbach, D. Prior, C. Goddard, M. Gritsenko, and H. Mottaz (PNNL) for their critical help with instrumental development and experimental work, and Professor P. Thibault (Univ. de Montreal) for providing his FAIMS/MS data for tryptic peptides. Portions of this work were supported by PNNL Laboratory Directed Research and Development Program and the NIH National Center for Research Resources (RR 18522). Pacific Northwest National Laboratory is operated by the Battelle Memorial Institute for the U.S. Department of Energy through contract DE-AC05-76RLO1830.
References
- 1.Aebersold R, Mann M. Nature. 2003;422:198. doi: 10.1038/nature01511. [DOI] [PubMed] [Google Scholar]
- 2.Shen Y, Zhao R, Berger SJ, Anderson GA, Rodriguez N, Smith RD. Anal Chem. 2002;74:4235. doi: 10.1021/ac0202280. [DOI] [PubMed] [Google Scholar]
- 3.Shen Y, Xiang F, Veenstra TD, Fung EN, Smith RD. Anal Chem. 1999;71:5348. doi: 10.1021/ac9909305. [DOI] [PubMed] [Google Scholar]
- 4.Shevchenko A, Wilm M, Vorm O, Mann M. Anal Chem. 1996;68:850. doi: 10.1021/ac950914h. [DOI] [PubMed] [Google Scholar]
- 5.Gygi SP, Corthals GL, Zhang Y, Rochon Y, Aebersold R. Proc Natl Acad Sci USA. 2000;97:9390. doi: 10.1073/pnas.160270797. [DOI] [PMC free article] [PubMed] [Google Scholar]
- 6.Washburn MP, Wolters D, Yates JR. Nature Biotechnol. 2001;19:242. doi: 10.1038/85686. [DOI] [PubMed] [Google Scholar]
- 7.Wolters DA, Washburn MP, Yates JR. Anal Chem. 2001;73:5683. doi: 10.1021/ac010617e. [DOI] [PubMed] [Google Scholar]
- 8.Skop AR, Liu HB, Yates J, Meyer BJ, Heald R. Science. 2004;305:61. doi: 10.1126/science.1097931. [DOI] [PMC free article] [PubMed] [Google Scholar]
- 9.Froehlich JE, Wilkerson CG, Ray WK, McAndrew RS, Osteryoung KW, Gage DA, Phinney BS. J Proteome Res. 2003;2:413. doi: 10.1021/pr034025j. [DOI] [PubMed] [Google Scholar]
- 10.Gaucher SP, Taylor SW, Fahy E, Zhang B, Warnock DE, Ghosh SS, Gibson BW. J Proteome Res. 2004;3:495. doi: 10.1021/pr034102a. [DOI] [PubMed] [Google Scholar]
- 11.Shen YF, Jacobs JM, Camp DG, Fang RH, Moore RJ, Smith RD, Xiao WZ, Davis RW, Tompkins RG. Anal Chem. 2004;76:1134. doi: 10.1021/ac034869m. [DOI] [PubMed] [Google Scholar]
- 12.Qian WJ, Liu T, Monroe ME, Strittmatter EF, Jacobs JM, Kangas LJ, Petritis K, Camp DG, Smith RD. J Proteome Res. 2005;4:53. doi: 10.1021/pr0498638. [DOI] [PubMed] [Google Scholar]
- 13.Wagner K, Miliotis T, Marco-Varga T, Bischoff R, Unger KK. Anal Chem. 2002;74:809. doi: 10.1021/ac010627f. [DOI] [PubMed] [Google Scholar]
- 14.Opiteck GJ, Jorgenson JW, Anderegg RJ. Anal Chem. 1997;69:2283. doi: 10.1021/ac961156d. [DOI] [PubMed] [Google Scholar]
- 15.Evans CR, Jorgenson JW. Anal Bional Chem. 2004;378:1952. doi: 10.1007/s00216-004-2516-2. [DOI] [PubMed] [Google Scholar]
- 16.Bushey MM, Jorgenson JW. Anal Chem. 1990;62:978. doi: 10.1021/ac00201a015. [DOI] [PubMed] [Google Scholar]
- 17.Lewis KC, Opiteck GJ, Jorgenson JW, Sheeley D. J Am Soc Mass Spectrom. 1997;69:2283. [Google Scholar]
- 18.Rocklin RD, Ramsey RS, Ramsey JM. Anal Chem. 2000;72:5244. doi: 10.1021/ac000578r. [DOI] [PubMed] [Google Scholar]
- 19.Mohan D, Pasa-Tolic L, Masselon CD, Tolic N, Bogdanov B, Hixson KK, Smith RD, Lee CS. Anal Chem. 2003;75:4432. doi: 10.1021/ac0342572. [DOI] [PubMed] [Google Scholar]
- 20.Eiceman GA, Leasure CS, Vandiver VJ. Anal Chem. 1986;58:76. [Google Scholar]
- 21.Hill HH, Jr, Siems WF, St Louis RH, McMinn DG. Anal Chem. 1990;62:A1201. doi: 10.1021/ac00222a001. [DOI] [PubMed] [Google Scholar]
- 22.Przybylko ARM, Thomas CLP, Anstice PJ, Fielden PR, Brokenshire J, Irons F. Anal Chim Acta. 1995;311:77. [Google Scholar]
- 23.Lopez-Avila V, Hill HH. Anal Chem. 1997;69:289R. [Google Scholar]
- 24.Bowers MT, Kemper PR, von Helden G, van Koppen PAM. Science. 1993;260:1446. doi: 10.1126/science.260.5113.1446. [DOI] [PubMed] [Google Scholar]
- 25.Von Helden G, Wyttenbach T, Bowers MT. Science. 1995;267:1483. doi: 10.1126/science.267.5203.1483. [DOI] [PubMed] [Google Scholar]
- 26.Clemmer DE, Hudgins RR, Jarrold MF. J Am Chem Soc. 1995;117:10141. [Google Scholar]
- 27.Ho KM, Shvartsburg AA, Pan B, Lu ZY, Wang CZ, Wacker JG, Fye JL, Jarrold MF. Nature. 1998;392:582. [Google Scholar]
- 28.Shvartsburg AA, Hudgins RR, Dugourd P, Jarrold MF. Chem Soc Rev. 2001;30:26. [Google Scholar]
- 29.Guevremont R, Siu KWM, Wang JY, Ding LY. Anal Chem. 1997;69:3959. doi: 10.1021/ac970359e. [DOI] [PubMed] [Google Scholar]
- 30.Hoaglund CS, Valentine SJ, Sporleder CR, Reilly JP, Clemmer DE. Anal Chem. 1998;70:2236. doi: 10.1021/ac980059c. [DOI] [PubMed] [Google Scholar]
- 31.Lee YJ, Hoaglund-Hyzer CS, Srebalus Barnes CA, Hilderbrand AE, Valentine SJ, Clemmer DE. J Chromatogr B. 2002;782:343. doi: 10.1016/s1570-0232(02)00569-x. [DOI] [PubMed] [Google Scholar]
- 32.Collins DC, Lee ML. Anal Bioanal Chem. 2002;372:66. doi: 10.1007/s00216-001-1195-5. [DOI] [PubMed] [Google Scholar]
- 33.Buryakov IA, Krylov EV, Nazarov EG, Rasulev UK. Int J Mass Spectrom Ion Processes. 1993;128:143. [Google Scholar]
- 34.Buryakov IA. Talanta. 2003;61:369. doi: 10.1016/S0039-9140(03)00305-9. [DOI] [PubMed] [Google Scholar]
- 35.Purves RW, Guevremont R, Day S, Pipich CW, Matyjaszczyk MS. Rev Sci Instrum. 1998;69:4094. [Google Scholar]
- 36.Guevremont R, Barnett DA, Purves RW, Viehland LA. J Chem Phys. 2001;114:10270. [Google Scholar]
- 37.Guevremont R. J Chromatogr A. 2004;1058:3. [PubMed] [Google Scholar]
- 38.Eiceman GA, Krylov EV, Krylova NS, Nazarov EG, Miller RA. Anal Chem. 2004;76:4937. doi: 10.1021/ac035502k. [DOI] [PubMed] [Google Scholar]
- 39.Shvartsburg AA, Tang K, Smith RD. Anal Chem. 2004;76:7366. doi: 10.1021/ac049299k. [DOI] [PubMed] [Google Scholar]
- 40.Mason EA, McDaniel EW. Transport Properties of Ions in Gases. Wiley; NY: 1988. [Google Scholar]
- 41.Shvartsburg AA, Jarrold MF. Chem Phys Lett. 1996;261:86. [Google Scholar]
- 42.Mesleh MF, Hunter JM, Shvartsburg AA, Schatz GC, Jarrold MF. J Phys Chem. 1996;100:16082. [Google Scholar]
- 43.Shvartsburg AA, Liu B, Siu KWM, Ho KM. J Phys Chem A. 2000;104:6152. [Google Scholar]
- 44.Jackson KA, Horoi M, Chaudhuri I, Frauenheim T, Shvartsburg AA. Phys Rev Lett. 2004;93 doi: 10.1103/PhysRevLett.85.546. # 013401. [DOI] [PubMed] [Google Scholar]
- 45.Wittmer D, Chen YH, Luckenbill BK, Hill HH., Jr Anal Chem. 1994;66:2348. [Google Scholar]
- 46.Shvartsburg AA, Tang K, Smith RD. J Am Soc Mass Spectrom. 2005;16:2. doi: 10.1016/j.jasms.2004.09.009. [DOI] [PubMed] [Google Scholar]
- 47.Dugourd Ph, Hudgins RR, Clemmer DE, Jarrold MF. Rev Sci Instrum. 1997;68:1122. [Google Scholar]
- 48.Wu C, Siems WF, Asbury GR, Hill HH., Jr Anal Chem. 1998;70:4929. doi: 10.1021/ac980414z. [DOI] [PubMed] [Google Scholar]
- 49.Srebalus CA, Li J, Marshall WS, Clemmer DE. Anal Chem. 1999;71:3918. doi: 10.1021/ac9903757. [DOI] [PubMed] [Google Scholar]
- 50.Asbury GR, Hill HH. J Microcolumn Sep. 2000;12:172. [Google Scholar]
- 51.Shvartsburg AA, Siu KWM, Clemmer DE. J Am Soc Mass Spectrom. 2001;12:885. doi: 10.1016/S1044-0305(01)00269-0. [DOI] [PubMed] [Google Scholar]
- 52.Ruotolo BT, Gillig KJ, Stone EG, Russell DH. J Chromatogr B. 2002;782:385. doi: 10.1016/s1570-0232(02)00566-4. [DOI] [PubMed] [Google Scholar]
- 53.Venne K, Bonneil E, Eng K, Thibault P. Anal Chem. 2005;77:2176. doi: 10.1021/ac048410j. [DOI] [PubMed] [Google Scholar]
- 54.Myung S, Lee YJ, Moon MH, Taraszka J, Sowell R, Koeniger S, Hilderbrand AE, Valentine SJ, Cherbas L, Cherbas P, Kaufmann TC, Miller DF, Mechref Y, Novotny MV, Ewing MA, Sporleder CR, Clemmer DE. Anal Chem. 2003;75:5137. doi: 10.1021/ac030107f. [DOI] [PubMed] [Google Scholar]
- 55.Smith RD, Tang K, Shvartsburg AA. # 6,818,890. US Patent. 2004
- 56.Tang K, Shvartsburg AA, Lee HN, Prior DC, Buschbach MA, Li F, Tolmachev AV, Anderson GA, Smith RD. Anal Chem. 2005;77:3330. doi: 10.1021/ac048315a. [DOI] [PMC free article] [PubMed] [Google Scholar]
- 57.Kim T, Tolmachev AV, Harkewicz R, Prior DC, Anderson GA, Udseth HR, Smith RD, Bailey TH, Rakov S, Futrell JH. Anal Chem. 2000;72:2247. doi: 10.1021/ac991412x. [DOI] [PubMed] [Google Scholar]
- 58.Belov ME, Gorshkov MV, Udseth HR, Anderson GA, Smith RD. Anal Chem. 2000;72:2271. doi: 10.1021/ac991360b. [DOI] [PubMed] [Google Scholar]
- 59.Kim T, Tang K, Udseth HR, Smith RD. Anal Chem. 2001;73:4162. doi: 10.1021/ac010174e. [DOI] [PubMed] [Google Scholar]
- 60.Guevremont R, Purves R. J Am Soc Mass Spectrom. 2005;16:349. doi: 10.1016/j.jasms.2004.11.013. [DOI] [PubMed] [Google Scholar]
- 61.Guevremont R, Thekkadath G, Hilton CK. J Am Soc Mass Spectrom. 2005;16:948. doi: 10.1016/j.jasms.2005.03.001. [DOI] [PubMed] [Google Scholar]
- 62.Barnett DA, Ells B, Guevremont R, Purves RW, Viehland LA. J Am Soc Mass Spectrom. 2000;11:1125. doi: 10.1016/S1044-0305(00)00187-2. [DOI] [PubMed] [Google Scholar]
- 63.Barnett DA, Ells B, Guevremont R, Purves RW. J Am Soc Mass Spectrom. 2002;13:1282. doi: 10.1016/S1044-0305(02)00527-5. [DOI] [PubMed] [Google Scholar]
- 64.McCooeye M, Ding L, Gardner GJ, Fraser CA, Lam J, Sturgeon RE, Mester Z. Anal Chem. 2003;75:2538. doi: 10.1021/ac0342020. [DOI] [PubMed] [Google Scholar]
- 65.Tang K, Shvartsburg AA, Smith RD. US patent pending
- 66.Rokushika S, Hatano H, Baim MA, Hill HH., Jr Anal Chem. 1985;57:1902. [Google Scholar]
- 67.Guevremont R, Barnett DA, Purves RW, Vandermey J. Anal Chem. 2000;72:4577. doi: 10.1021/ac0000271. [DOI] [PubMed] [Google Scholar]
- 68.Ruotolo BT, McLean JA, Gillig KJ, Russell DH. J Mass Spectrom. 2004;39:361. doi: 10.1002/jms.592. [DOI] [PubMed] [Google Scholar]
- 69.Shvartsburg AA, Tang K, Smith RD. J Am Soc Mass Spectrom. 2004;15:1487. doi: 10.1016/j.jasms.2004.06.018. [DOI] [PubMed] [Google Scholar]
- 70.Purves RW, Barnett DA, Ells B, Guevremont R. Rapid Commun Mass Spectrom. 2001;15:1453. doi: 10.1002/rcm.390. [DOI] [PubMed] [Google Scholar]
- 71.Purves RW, Barnett DA, Ells B, Guevremont R. J Am Soc Mass Spectrom. 2000;11:738. doi: 10.1016/S1044-0305(00)00136-7. [DOI] [PubMed] [Google Scholar]
- 72.Guevremont R. Can J Anal Sci Spect. 2004;49:105. [Google Scholar]
- 73.Guevremont R, Purves R, Barnett D. US Patent Application. 2003/0089847 A1.
- 74.Woods AS, Ugarov M, Egan T, Koomen J, Gillig KJ, Fuhrer K, Gonin M, Schultz JA. Anal Chem. 2004;76:2187. doi: 10.1021/ac035376k. [DOI] [PubMed] [Google Scholar]
- 75.Jackson SN, Wang HYJ, Woods AS. J Am Soc Mass Spectrom. 2005;16:133. doi: 10.1016/j.jasms.2004.10.002. [DOI] [PubMed] [Google Scholar]


