

Abstract
Retrovirus particle assembly is mediated by the Gag protein. Gag is a multi-domain protein containing discrete domains connected by flexible linkers. When recombinant HIV-1 Gag protein (lacking myristate at its N terminus and the p6 domain at its C terminus) is mixed with nucleic acid, it assembles into virus-like particles (VLPs) in a fully defined system in vitro. However, this assembly is defective in that the radius of curvature of the VLPs is far smaller than that of authentic immature virions. This defect can be corrected to varying degrees by addition of inositol phosphates to the assembly reaction. We have now explored the binding of inositol hexakisphosphate (IP6) to Gag and its effects upon the interactions between Gag protein molecules in solution. Our data indicate that basic regions at both ends of the protein contribute to IP6 binding. Gag is in monomer-dimer equilibrium in solution, and mutation of the previously described dimer interface within its capsid domain drastically reduces Gag dimerization. In contrast, when IP6 is added, Gag is in monomer-trimer rather than monomer-dimer equilibrium. The Gag protein with a mutation at the dimer interface also remains almost exclusively monomeric in IP6; thus the “dimer interface” is essential for the trimeric interaction in IP6. We discuss possible explanations for these results, including a change in conformation within the capsid domain induced by the binding of IP6 to other domains within the protein. The participation of both ends of Gag in IP6 interaction suggests that Gag is folded over in solution, with its ends near each other in three-dimensional space; direct support for this conclusion is provided in a companion manuscript. As Gag is an extended rod in immature virions, this apparent proximity of the ends in solution implies that it undergoes a major conformational change during particle assembly.
Keywords: HIV-1, virus assembly, analytical ultracentrifugation, inositol phosphates, protein-protein interaction
Introduction
The principal structural component of a retro-virus particle is the virus-coded Gag protein.1 In the context of the mammalian cell, expression of the protein is sufficient for the efficient production of virus-like particles. However, several lines of evidence indicate that protein–RNA, as well as protein–protein, interactions contribute to particle assembly.1–7 Gag always contains at least three domains, designated (from N to C terminus) the matrix (MA), capsid (CA), and nucleocapsid (NC) domains. After the assembled particle is released from the host cell, Gag is cleaved by the viral protease, resulting in the production of free MA, CA, and NC proteins, and frequently other, virus-specific cleavage products. These cleavages lead to an overall structural rearrangement of the immature particle and its conversion to a mature, fully infectious particle.
The analysis of the assembly process was dramatically simplified by the demonstration that recombinant Gag protein can spontaneously assemble into virus-like particles (VLPs) in a defined system in vitro, in which the protein is simply mixed with nucleic acid under appropriate buffer conditions.4 In the case of avian retroviruses,4 Mason-Pfizer monkey virus,8 murine retroviruses (unpublished results), and HIV-1 Gag with a substantial deletion in its MA domain,9,10 the VLPs closely resemble immature particles formed in vivo (except for the absence of the membrane that encloses authentic virions). In contrast, HIV-1 Gag protein with an intact MA domain (termed Δp6 because it lacks the p6 domain found at the extreme C terminus of authentic HIV-1 Gag) assembles under these conditions into VLPs that are much smaller than authentic HIV-1 particles.11 These VLPs have a diameter of only 25–30 nm, while retrovirus particles assembled in vivo have a diameter of ~100–150 nm. We reported earlier that addition of inositol phosphates (IPs) to the assembly reaction corrects the radius of curvature with which the protein assembles, leading to the formation of 100–150 nm diameter particles.12
Ultimately, the formation of a rather regular three-dimensional structure (the VLP) must derive from the interactions between its constituent Gag molecules. In turn, the ability of IPs to alter the VLP structure in a defined in vitro system suggests that they can directly influence Gag–Gag interactions. Here, we have analyzed the interactions of Gag molecules with each other and with IPs. Since nucleic acids were not included in these experiments, the protein remained in solution rather than assembling into VLPs, so that discrete interactions could be detected. Our results indicate that both the MA and NC domains of Gag contribute to its interaction with IPs; this finding suggests that the protein is folded over in solution, placing these domains near each other in three-dimensional space despite the fact that they are at opposite ends of the protein. We also found that Gag is in monomer-dimer equilibrium in solution. The dimeric contact between Gag molecules is evidently via the previously described dimer interface in the C-terminal domain (CTD) of CA,13,14 since mutation of a pair of key residues at this interface greatly reduces the affinity of Gag molecules for each other. Finally, IP6 binding directly affects Gag–Gag interaction, as expected: in the presence of this assembly cofactor, Gag is in monomer-trimer equilibrium rather than monomer-dimer equilibrium. Gag with a mutation at the “dimer interface” is also impaired with respect to trimerization, raising the possibility that the same region of the protein is involved in both dimeric and trimeric interactions.
Results
Binding of IP6 to Gag
Since IP5 and IP6 have dramatic effects on VLP assembly in vitro,12 it was of considerable interest to define their interactions with pure Gag protein. The Gag protein used in all experiments described here is Δp6, which differs from authentic Gag protein in that it lacks both the myristate modification at the extreme N terminus and the p6 domain at its C terminus.11 We measured binding of [3H]IP6 to Gag with a pelleting assay, as described in Materials and Methods.15 (Radioactive IP5 is not readily available from commercial sources, and we have only studied IP6 here. The effects of IP5 and IP6 on assembly are similar, although not identical.12) Figure 1(a) shows binding isotherms obtained at 0.2, 0.3, 0.4, and 0.5 M NaCl. It is evident that the number of IP6 molecules binding to a Gag molecule is quite sensitive to the ionic strength of the solution: approximately five molecules bind in 0.2 M NaCl, but only one binds in 0.5 M NaCl. Data presented below indicate that the protein in these assays is probably a mixture of monomers and oligomers; it is possible that the oligomeric state of the protein affects its IP6-binding properties. We have not attempted to dissect this potential complexity in these experiments.
Figure 1.
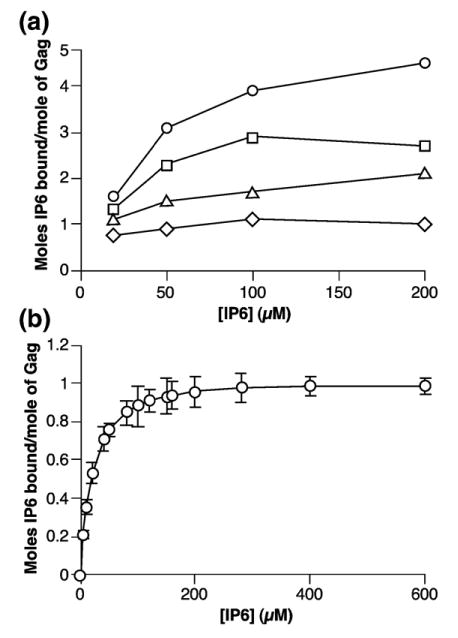
Binding of [3H]IP6 to Gag. (a) Binding curves at 0.2 M (circles), 0.3 M (squares), 0.4 M (triangles), and 0.5 M (diamonds) NaCl. (b) Expanded binding curve at 0.5 M NaCl. Data from eight individual binding experiments were pooled and then fit to a hyperbolic decay model. The graph is plotted as a binding isotherm. The error-bars show the standard deviations of the values.
We analyzed the binding at 0.5 M NaCl in somewhat greater detail. As shown in Figure 1(b), these binding data are all compatible with a single binding system, with a Kd of ~18 μM. Thus, under these relatively stringent conditions, Gag appears to have a single IP6 binding site. As the stringency is reduced, additional IP6 molecules can bind (Figure 1(a)), presumably more weakly.
In an effort to localize the binding site that is resistant to 0.5 M NaCl, we tested a panel of deletions, truncations, and mutant Gag proteins for their ability to bind IP6. As shown in Table 1 (fourth column), C-terminally truncated Gag proteins, including a protein lacking only the NC domain (MA-CA), showed no significant binding under these conditions. However, Gag proteins with alterations in the MA domain, including the 8N mutant, which differs from wild-type Gag only in that eight basic residues in the MA domain have been replaced with asparagine,16 also failed to bind IP6 under these conditions. Thus the single “binding site” retained in 0.5 M NaCl evidently involves both the N-terminal, MA domain and the C-terminal, NC domain.
Table 1.
IP6 binding to Gag derivatives
| Construct | Structurea | Binding (0.2M NaCl)b | Binding (0.5M NaCl)b |
|---|---|---|---|
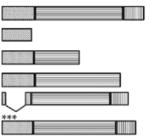
| Δp6 |
|
5 +/−0.5 | 1 |
| MA | ~0.2 | 0 | |
| MA-NTD | ~0.3 | 0 | |
| MA-CA | 2 +/−0.5 | −0.1 | |
| Δ16-99 | 4 +/−0.5 | −0.1 | |
| 8N | 4 +/−0.5 | 0.15 +/−0.05 |
The three segments of Gag depicted are (left to right) MA (diagonal stripes), CA (horizontal stripes), and NC (vertical stripes).
Moles IP6 bound/mole of protein.
We also estimated the number of IP6 molecules binding to the proteins in 0.2 M NaCl. As shown in the third column of Table 1, removal of the NC domain (in MA-CA) reduces the binding somewhat, but removal of the CTD of CA (in the truncation mutants MA or MA-NTD) has a drastic effect. Thus the binding that occurs under these less stringent ionic conditions may involve the CTD directly, or may depend upon oligomerization of Gag (see below). We have not investigated this weaker binding further.
We also identified residues involved in IP6 binding by a footprinting approach. Recent lysine surface topology studies using mass spectrometric footprinting enabled us to identify Gag residues interacting with IP5 and phosphatidyl inositol 4,5-bisphosphate.17 Here, we used a similar method to compare the surface topologies of lysine and arginine residues in free Gag and Gag-IP6 complexes. 20 μM Gag solutions were analyzed directly or were mixed with 50, 100, or 150 μM IP6 to form Gag-IP6 complexes before modification.
Mass spectrometric footprinting of free Gag indicated that 24 lysine residues (residues 18, 26, 30, 32, 95, 103, 110, 112, 113, 114, 157, 272, 290, 302, 314, 335, 359, 388, 391, 397, 410, 411, 415, and 424) and ten arginine residues (residues 20, 22, 39, 43, 275, 286, 294, 384, 403, and 406) were readily accessible to N-hydroxysuccinimidobiotin (NHS-biotin) and p-hydroxyphenylglyoxal (HPG) modifications, respectively. Of the 34 basic residues modified in the free polyprotein, only the peptides containing residues K30 and K32, K290, K314, K359 and K410, K411, and K415 were significantly protected in the presence of IP6 (Figure 2(a) and data not shown).
Figure 2.
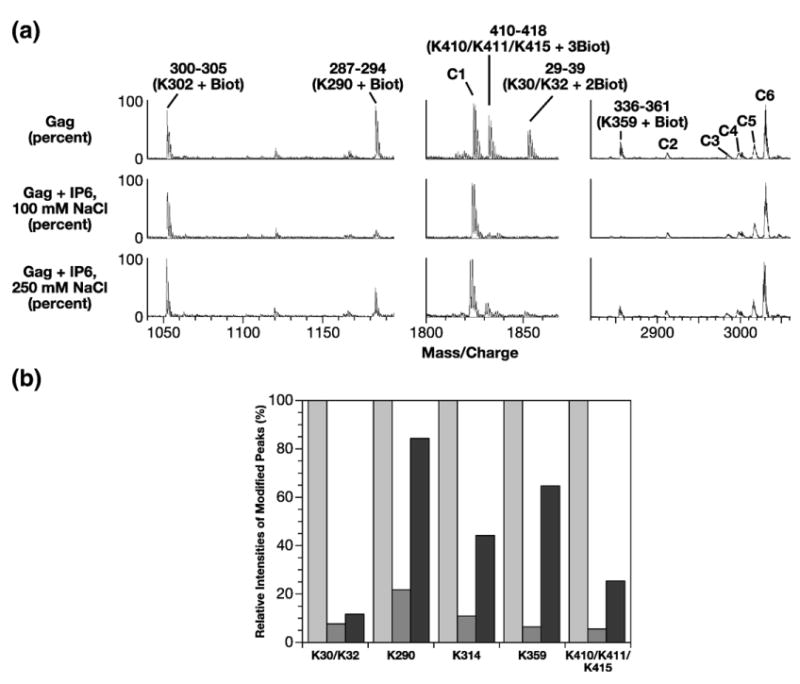
Identification of IP6 binding sites in Gag by mass spectrometric protein footprinting. (a) Segments of MALDI-ToF data showing IP6 protection of lysine residues in Gag at different NaCl concentrations. (Top) 20 μM Gag was treated with 400 μM NHS-biotin in buffer containing 100 mM NaCl. Intensities of the modified peaks at 250 mM NaCl were very similar (data not shown). (Middle) 100 μM IP6 and 20 μM Gag were pre-incubated in buffer containing 100 mM NaCl and then exposed to 400 μM NHS-biotin. (Bottom) same as middle panel, but in 250 mM NaCl. Five biotinylated peptide peaks are labeled. The start and end positions of the amino acids as well as biotinylated lysine residues are indicated. For example, peak 29–39 (K30/K32+2Biot) corresponds to the Gag peptide spanning amino acid residues 29 to 39 in which two lysine residues (K30 and K32) are biotinylated. The peaks C1 to C6 are unmodified Gag peaks that serve as internal controls. The 300–305 peptide peak with biotinylated K302 also serves as an internal control as this peak did not show a significant change in the presence of added ligand. (b) Relative protections of the modified peptide peaks by IP6 at different NaCl concentrations. The intensities of each biotinylated peak upon modification of free Gag are considered 100% (light gray columns). Relative intensities of the modified peaks for Gag+IP6 at 100 mM NaCl and 250 mM NaCl are depicted in dark gray and black columns, respectively. The results represent an average of three experiments, with values all within 5% of the mean. Only peaks that displayed detectable protections (K30/K32, K290, K314, K359 and K410/K411/K415) were quantified.
In order to distinguish between higher and lower affinity binding sites, we compared the protection of these lysine residues by IP6 in the presence of 100 mM and 250 mM NaCl (Figure 2(a)). (Little protection is observed at 0.5 M NaCl; this is probably because the IP6:Gag complex is somewhat unstable under these conditions, allowing NHS-biotin transitory access to susceptible residues.) Representative analysis of fragments by mass spectrometry and quantitative analysis are depicted in Figure 2(a) and (b), respectively. As noted above, the intensities of the peptide peaks containing modified lysine residues K30/K32, K290, K314, K359 and K410/K411/K415 were all significantly reduced by IP6 at the lower ionic strength. Raising the NaCl concentration to 250 mM increased the susceptibility of these lysine residues to NHS-biotin modification, but the protection of K30/32 in the MA domain and of K410/K411/K415 in the NC domain was still quite strong at this salt concentration (black bars in Figure 2(b)). While we cannot exclude the possibility that protection against NHS-biotin modification results from IP6-induced changes in Gag conformation or Gag–Gag interaction, it seems likely that the protection of these lysine residues at 250 mM NaCl results from direct binding of IP6 to these basic stretches in the protein. The protection of residues in both the MA and NC domains, even at this more stringent ionic strength, is fully consistent with the direct binding measurements shown in Table 1.
Monomer-dimer equilibrium of Gag protein
In our initial biochemical experiments with the Gag protein, we noted that its mobility in gel filtration columns was a function of its concentration. An example of this behavior is shown in Figure 3(a). A series of Gag solutions (in buffer containing 0.5 M NaCl, as in all experiments described here unless otherwise specified), ranging from 7.5 to 44 μM, was passed over a Superose 12 column that was connected to a static light-scattering (SLS) detector. The elution times of the protein were monitored by absorbance, and the weight-average molecular weights of the eluted proteins were also determined simultaneously from the SLS readings on the eluates. Bovine serum albumin (BSA) was also fractionated on the column as a control. It can be seen that the Gag peak eluted at ~36.6 min in the case of the most concentrated solution, but at ~38.2 min in the most dilute solution. The time of elution decreased continuously with increasing concentration over this concentration range. In addition, the apparent molecular weights obtained from the SLS readings are shown above the elution profiles. In each case, the Figure presents both the data-points (colored dots) and the apparent molecular weight averaged over the peak (horizontal lines). Notably, the SLS readings show that the apparent molecular weight increases from 5.0×10⁴ to 5.9 × 10⁴ with increasing Gag concentration. Moreover, the data-points for each peak are higher in the center of the peak (where the protein concentration is highest) than at the sides of the peak. This fluctuation across the peak, which is most notable with the highest Gag concentrations, is not seen with the BSA control (blue line). While the lower Gag concentrations eluted more slowly than BSA (as expected, since the molecular weight (MW) of Gag is 50 kDa while that of BSA is 68 kDa), the higher concentrations eluted more rapidly. The apparent molecular weight of BSA obtained by SLS measurements on the column fractions was 6.5×10⁴ Da, nearly identical to its actual molecular weight. Thus, the measurements performed here all show that the apparent molecular weight of Gag increases as a function of its concentration, strongly suggesting that it undergoes oligomerization under our solution conditions.
Figure 3.
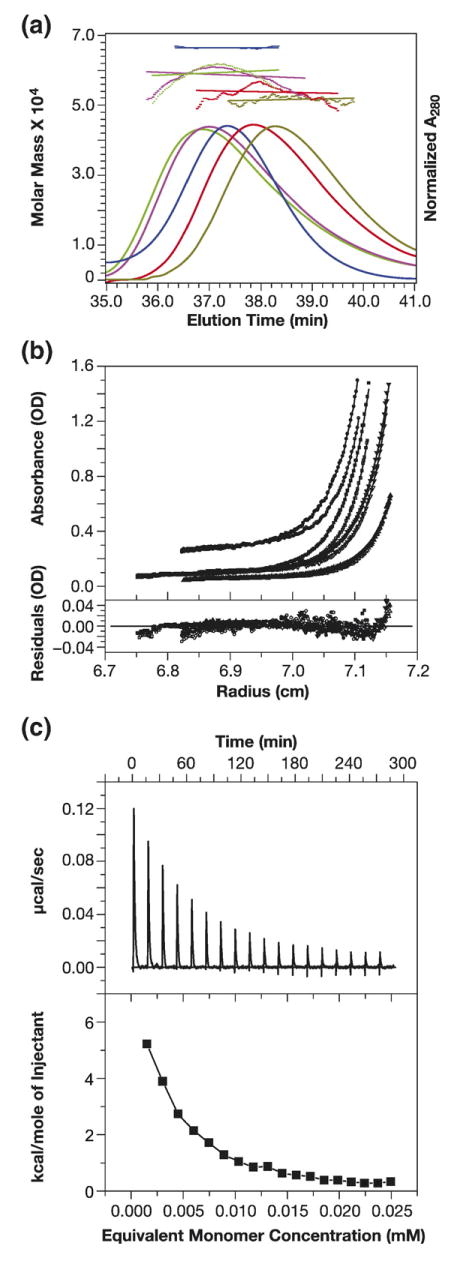
Gag protein is in monomer-dimer equilibrium. (a) Size-exclusion chromatography and SLS of HIV-1 Gag at different concentrations. A Superose 12 column was loaded with Gag solutions at the following concentrations: 44 μM (blue-green); 36 μM (magenta); 14.8 μM (orange); and 7.5 μM (dull green). Elution of protein was simultaneously monitored by A280, giving rise to the elution profiles, and by SLS, yielding the data-points above the elution profiles. The points indicate the molar mass of the protein in each fraction. These masses in turn were averaged over the breadth of each peak, producing the horizontal lines above the elution profiles. BSA (1.5 mg/ml) (dark blue) was also chromatographed as a control. (b) SE analysis of Gag oligomerization. Solutions of Gag at 2 μM (triangles), 6 μM (inverted triangles), 12 μM (squares), and 30 μM (circles) were centrifuged to equilibrium at 18,000 (filled symbols) and 20,000 rpm (open symbols). The data-points were globally fit to a model of dimeric association with a log Ka of 5.259. The top panel shows the eight equilibrium A280 profiles, while the bottom panel shows the residuals from the fit. Fitting the data to a model of trimeric association gave a much poorer fit (higher χ2 and significant curvature of the residuals), while fitting to a model allowing both dimerization and trimerization was only marginally superior to the simple monomer-dimer model. (c) ITC analysis of dissociation of Gag. A Gag solution (150 μM) was diluted in a VP-ITC Microcalorimeter as described in Materials and Methods. The heat taken up over the course of the experiment is shown in the upper panel, while the lower panel shows the cumulative heat uptake as a function of the total amount of Gag released into the mixing chamber.
As a more rigorous approach to the analysis of this putative oligomerization, we also analyzed Gag protein by sedimentation equilibrium (SE) experiments. Gag solutions at four different concentrations, ranging from 2 to 30 μM, were subjected to SE analysis at 18,000 and 20,000 rpm. Since CA protein has previously been shown to dimerize,14 the self-association of Gag was modeled as a monomer-dimer equilibrium. All eight profiles were analyzed to obtain a global fit with a monomer-dimer association model, assuming the monomer mass to be 50,169 Da. The top panel in Figure 3(b) superimposes the eight profiles. The continuous line through each data set is the non-linear regression fit to the data and to a Ka of 1.816×10⁵ M−1 for dimeric association of the monomers, with a global reduced chi-square χ2 =2.6657 for the fit. The bottom panel shows a plot of the respective residuals for each fit. It is evident that (with the exception of the 2 μM samples (triangles), which have the lowest signal:noise ratio) the residuals are all close to zero and mostly randomly distributed. The determined association constant corresponds to a Kd =5.5 μM.
To further examine the validity of this analysis, we tested the SE data against another model for Gag oligomerization. Assuming that Gag could form trimers as well as dimers did not significantly improve the fit: the Ka for dimerization was virtually unchanged under this model, and the level of trimers would be extremely small (less than 1% of Gag would be trimeric, while >80% would be dimeric, in a 100 μM (=5 mg/ml) solution) (data not shown).
We also analyzed the self-association properties of Gag by isothermal titration calorimetry (ITC). A concentrated Gag solution was diluted into the ITC cell and the heat taken up was monitored. As shown in Figure 3(c) (upper panel), the first injections of concentrated protein solution into buffer in the cell produced a significant endothermic effect. Then, as the concentration of protein in the cell increased, the amount of absorbed heat decreased. Eventually, the protein “saturated” the cell and continued injection of protein into the cell did not lead to further heat uptake.
The integrated heats of injection gave a curve (lower panel) that was typical for molecular dissociation.18 The processing of this curve yielded a Ka of 6.7×10⁴ M−1 (corresponding to a Kd of 14(±9) μM), in excellent agreement with the SE results presented above. The enthalpy of dissociation was determined to be 30.9(±9.1) kcal/mol and the entropy was 81.4(±31.8) cal/mol K.
Monomer-trimer equilibrium of Gag in the presence of IP6
Because IP6 dramatically alters the assembly properties of Gag, we also analyzed the oligomerization of the protein in the presence of IP6. This was accomplished using 6, 12, and 30 μM Gag solutions in the presence of a 1:1 molar ratio of IP6 at three rotor speeds in order to perform a global analysis of the self-association. These nine data sets were analyzed globally by non-linear regression analysis. For clarity of presentation we only show the data and fits in Figure 4 for four of the nine SE scans. We first attempted to fit the data with a monomer-dimer association model, but the fit was poor (χ2 =12.195). Changing the model to a monomer-dimer-tetramer association gave a worse fit. In contrast, good fits to the data were obtained with a monomer-trimer association model as shown in Figure 4. The continuous line through each data set is the nonlinear regression fit to the data for a fixed sequence monomer molar mass value of 50,169 and the determined Ka of 6.714× 10⁹ M−2. The bottom panel shows a plot of the respective residuals for each fit. The χ2 value for the entire nine data sets is 3.555. This Ka means that half of the protein would be trimeric at a total concentration of ~14 μM. Assuming that the protein could form dimers as well as trimers yielded a Ka for dimerization of 1.107 × 10³ M−1 and a Ka for trimerization of 6.745×10⁹ M−2, with a χ2 value of 3.578 for the fit. These association constants would indicate that even at 100 μM, <1% of the protein would be dimeric, while ~85% would be trimeric. It is clear that including the ability to dimerize as well as trimerize, does not significantly improve the fit, since there would be almost no dimers formed under our experimental conditions, and the Ka for trimerization is unchanged by allowing dimer as well as trimer formation. We conclude that IP6 causes Gag to shift from monomer-dimer to monomer-trimer equilibrium.
Figure 4.
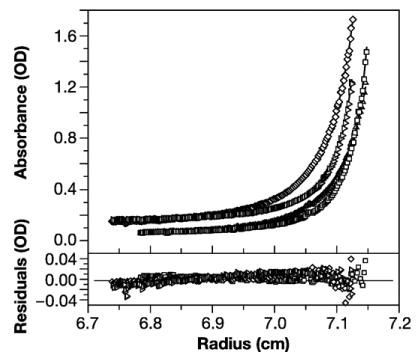
SE analysis of Gag oligomerization in the presence of equimolar IP6. The top panel shows the overlay of the absorbance versus radius profiles of four scans obtained at sedimentation equilibrium at 280 nm for the following experimental conditions: 16,000 rpm for protein (and IP6) concentrations of 6 μM (open triangles) and 30 μM (open diamonds) respectively; and the same protein solutions at 20,000 rpm (6 μM, open squares) and (30 μM, open right facing triangles). Continuous lines show the best fit to the exponential distributions from nonlinear global regression analysis of the data for a monomer to trimer model using a fixed sequence monomer molar mass value of 50,169. A log Ka of 9.814 was obtained from this global analysis. A monomer-dimer model gave an extremely poor fit, while the fit to a monomer-dimer-trimer model was slightly worse than the monomer-trimer model. Residuals of the fitted lines to the experimental data are displayed in the lower panel with the corresponding symbols listed above. The best fit rms error is 0.0083.
It has previously been reported9,12,19 that a Gag protein lacking residues 16 through 99 in its MA domain forms VLPs with the correct radius of curvature even in the absence of IPs. Since wild-type Gag requires IPs for this type of assembly and since IPs shift the oligomeric interaction between Gag molecules from dimeric to trimeric, it seemed possible that the deleted protein would form trimers in solution without addition of IPs. However, as shown in Figure 5, Δ16–99 Gag protein is in monomer-dimer equilibrium in solution. The analysis gave a log Ka of 5.368, corresponding to a Kd of 4.3 μM, very similar to that for Gag (Figure 3(b)). These assays for oligomerization were performed at 0.5 M NaCl; since no binding of IP6 to Δ16–99 Gag was detected at this salt concentration (Table 1), we assume that this ligand would not affect the oligomeric state of the protein under our experimental conditions.
Figure 5.
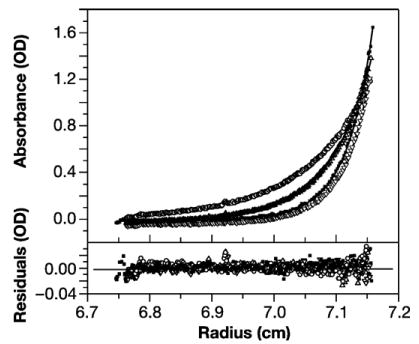
Δ16–99 Gag is in monomer-dimer equilibrium. The top panel shows the overlay of the absorbance versus radius profiles of four scans obtained at sedimentation equilibrium at 280 nm for the following experimental conditions: 19,000 rpm for protein concentrations of 12 μM (filled squares) and 18 μM (open inverted triangles), respectively; and the latter protein solution at 12,000 rpm (open circles) and 15,000 rpm (open triangles). Continuous lines show the best fit to the exponential distributions from non-linear global regression analysis of the data for a monomer to dimer model using a fixed sequence monomer molar mass value of 40,410. A log Ka of 5.368 was obtained from this global analysis. Residuals of the fitted lines to the experimental data are displayed in the lower panel with the corresponding symbols listed above. The best fit rms error is 0.0054.
A mutation in the CA domain inhibits both dimerization and trimerization of Gag
HIV-1 CA has previously been shown to be in monomer-dimer equilibrium in solution.13,14,20 The dimeric interface has been characterized by X-ray crystallography14,21 and has been studied in detail using a number of approaches.22–24 The interface centers around residues tryptophan 184 and methionine 185 of CA (i.e. residues 316 and 317 of Gag, counting from the initiator methionine), and evidently plays an important role in formation of the conical core of the mature particle after the release of CA from Gag by proteolysis.14,25–27 To test the possibility that Gag protein is dimerizing via the same interface, we mutated both of these residues to alanine. The mutant protein (designated WM Gag) was then subjected to SE analysis as described above. Species analysis was performed on SE profiles of WM Gag at a loading concentration of 12.8 μM (=0.64 mg/ml), centrifuged at 16,000, 18,000 and 20,000 rpm. Under these conditions, an ideal single-component model gave a good fit to the data, and the non-linear global regression model gave a molar mass of 51,069 Da, a 2% deviation from the sequence molar mass for WM Gag (data not shown). Thus, WM Gag is predominantly monomeric at the concentration employed in the experiment. However, species analysis of a larger SE data set, including higher protein concentrations (20, 40, and 60 μM) centrifuged at 10,000 and 12,000 rpm, indicated the presence of some ~100 kDa as well as ~50 kDa molecules in the solution. We therefore globally fit the entire data set to a monomer-dimer equilibrium model (a subset of the data is shown in Figure 6(a)). We obtained an excellent fit (χ2 = 1.524), in which the Ka for dimerization was 1.9×10³ M−1, corresponding to a Kd of ~0.53 mM. A solution of 100 μM WM Gag would then contain ~1/5 of its protein in dimeric form. Postulating the ability to form trimers in addition to dimers did not significantly improve the fit (χ2 =1.48). In conclusion, these results strongly suggest that Gag dimerizes via the previously characterized dimer interface in the CTD of CA, and that changing Trp316 and Met317 to alanine reduces the affinity at this interface by about two orders of magnitude.
Figure 6.
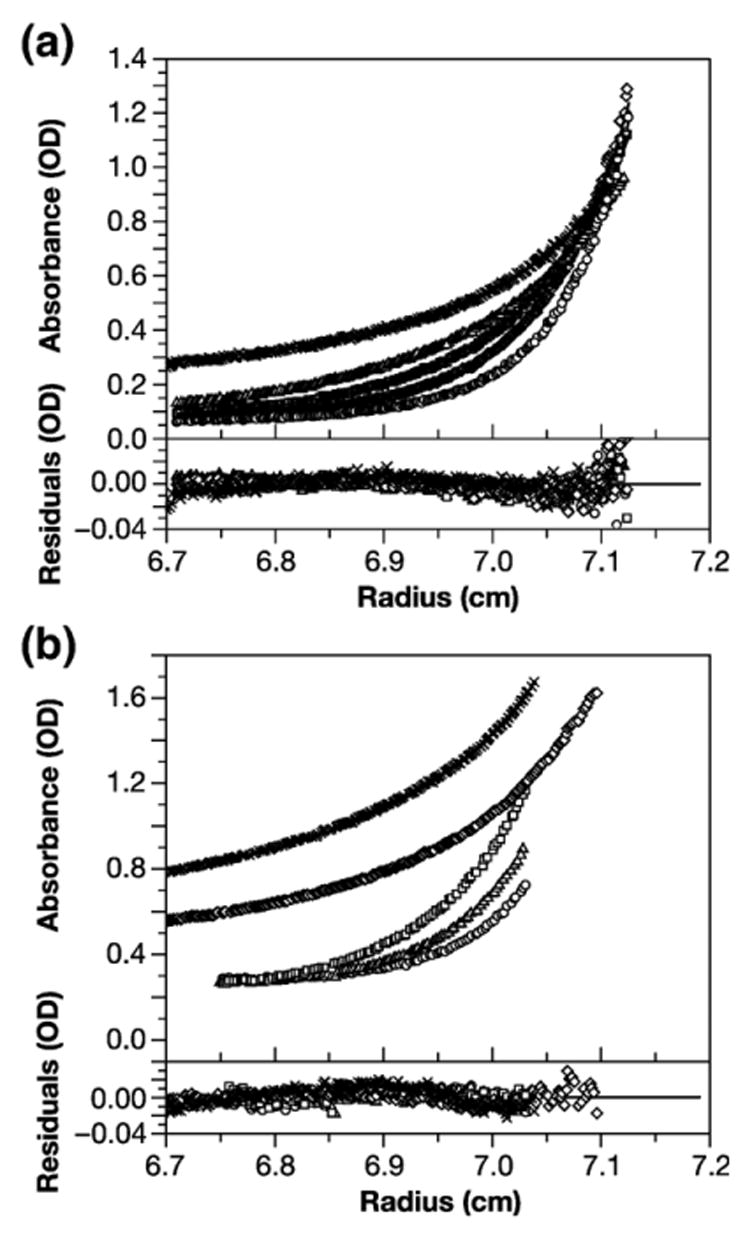
SE analysis of oligomerization of WM Gag protein. (a) WM Gag (12.8 μM) was centrifuged to equilibrium at 16,000, 18,000 and 20,000 rpm, and solutions at 20, 40, and 60 μM were analyzed at 10,000 and 12,000 rpm. Profiles of the latter series were monitored at both 254 nm and 280 nm. The results were globally fit to a monomer-dimer equilibrium model; the fit gave a log Ka of 3.28. Upper panel: A280 profiles from 12.8 μM at 12,000 (diamonds), 14,000 (squares), 16,000 (triangles), and 20,000 (circles) rpm, and A254 profile of 60 μM at 12,000 rpm (xs); lower panel: residuals from the global fit. The best fit rms error is 0.0032. (b) WM Gag was centrifuged to equilibrium in equimolar IP6. SE profiles were taken from 6, 12, and 18 μM WM Gag at 16,000, 18,000 and 20,000 rpm, and from 20, 40, and 60 μM WM Gag at 10,000 and 12,000 rpm. The Figure shows the profiles at 18 μM centrifuged at 16,000 (squares), 18,000 (triangles), and 20,000 (circles) rpm, and solutions of 40 (diamonds) and 60 (xs) μM at 12,000 rpm. All results were globally fit to a monomer-trimer model, giving a Ka of 8.51×10⁶ M−2. Upper panel, absorbance profiles; lower panel, residuals from the global fit. The best fit rms error is 0.0030.
We also tested the WM Gag protein for its ability to oligomerize in the presence of IP6. The SE profiles of a portion of the data are shown in Figure 6(b). While the mutant protein was largely monomeric at low concentrations, the best fit (shown in the Figure) was obtained by assuming that WM Gag, like its wild-type counterpart (Figure 4), is in monomer-trimer equilibrium. The Ka for this equilibrium, obtained by a global fit of data at 12, 20, 40, and 60 μM, was 8.5×10⁶ M−2, or more than two orders of magnitude weaker than the wild-type equilibrium. The χ2 for this fit was 1.519. This Ka would mean that only at a total concentration of 400 μM (=20 mg/ml) would half the protein be in trimers. We also fit the data to a model in which the protein was in monomer-dimer equilibrium. This analysis yielded a Ka of 1.4×10³ M−1, but the χ2 value for this fit was 1.796, or somewhat less satisfactory than the monomer-trimer model. With the weak association that is characteristic of WM Gag, the data do not permit a truly definitive conclusion as to the nature of the oligomerization of the mutant protein in IP6. Nevertheless, it is clear that the trimerization of Gag observed in IP6 is dependent on Trp316 and Met317 in the dimer interface in CA.
Oligomeric interactions between WM and wild-type Gag
It was also of interest to estimate the ability of WM Gag to co-oligomerize with wild-type Gag. As one approach to this question, we produced WM Gag protein in the presence of the tryptophan analog 5-hydroxytryptophan. The resulting protein, in which some of the tryptophan residues are replaced by the analog, absorbs light at wavelengths longer than 280 nm. In order to measure the ability of a WM Gag molecule to participate, together with wild-type Gag, in oligomer formation, we then performed SE analysis on this protein (using absorbance at 306 nm to specifically follow the labeled mutant protein) in the presence of an equal amount of unlabeled wild-type Gag.
The results of this experiment are shown in Figure 7. The profiles were modeled on the assumption that three types of dimer would be formed in this mixture: homodimers of wild-type; homodimers of WM Gag; heterodimers between wild-type and WM Gag; and higher order oligomers as described in Materials and Methods. The Kas for the first two reactions were fixed at 1.8×10⁵ and 1.9×10³ M−1, respectively (Figures 3(b) and 6(a) above). Using the SEDPHAT software then enabled us to solve for the Ka of the heterodimeric interaction. Global fits to the data obtained with mixtures containing 3, 6, and 9 μM of each of the proteins, each analyzed at 14,000, 16,000 and 18,000 rpm, yielded Ka values for the heterodimeric association of 7.6×10³–2.0×10⁴ M−1. In other words, the dimeric affinity of the “half-interface” between these two proteins is ~1/10–1/20 of that between two wild-type Gag molecules. It was necessary to postulate the formation of higher-order oligomers in order to obtain satisfactory fits, although the fits gave negligible amounts of these species.
Figure 7.
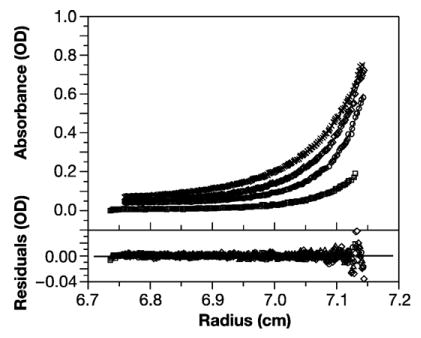
Analysis of hydroxytryptophan-containing WM Gag in the presence of equal amounts of unsubstituted wild-type Gag. Solutions containing 3 μM, 6 μM, and 9 μM each of WM Gag containing hydroxytryptophan and wild-type Gag containing only normal tryptophan were centrifuged at 14,000, 16,000 and 18,000 rpm and monitored at 306 nm. The data were globally fit as described in Materials and Methods, assuming monomer-dimer equilibria with log Ka values of 5.3 (wild-type homodimers) and 3.1 (WM Gag homodimers). This fit gave a log Ka of 3.9 for wild-type:WM Gag heterodimers. Upper panel, profiles at 18,000 rpm for the 3 μM mixture (squares) and at 14,000 (xs), 16,000 (diamonds), and 18,000 (circles) rpm for the 9 μM mixture; lower panel, residuals. The best fit rms error is 0.0021.
We also attempted to analyze the equimolar mixture between labeled WM Gag and unlabeled wild-type Gag in the presence of equimolar IP6. A species analysis of the SE profile indicated that the WM Gag was present in molecules of ~150 kDa as well as ~50 kDa, suggesting that it can participate in trimer formation together with wild-type Gag (data not shown). However, there is, to our knowledge, no software available to model the SE profile of this complex mixture, in which we would expect to find two homotrimers and, perhaps, two distinct hetero-trimeric species (1 wild-type:2 WM and 2 wild-type:1 WM) as well. We are therefore unable to determine the relative amounts of these two species.
Discussion
Recombinant HIV-1 Gag protein is capable of assembly into VLPs in a defined system in vitro. We have reported12 that several properties of the VLPs, including their radius of curvature, are dramatically affected by addition of IP5 or related compounds to the assembly reactions. Here, we have investigated the interaction of the HIV-1 Gag protein with IP6, along with the interactions between Gag molecules in solution. Our key findings can be briefly summarized as follows.
First, the data indicate that basic regions at both ends of the Gag protein participate in interactions with IP6, even under ionic conditions limiting this interaction to a single IP6 molecule per Gag molecule. Second, Gag is in monomer-dimer equilibrium in solution. Third, addition of IP6 shifts this oligomerization to monomer-trimer, rather than monomer-dimer equilibrium.
Interactions with IP6
We found (Figure 1) that the binding of IP6 to Gag is strongly affected by the ionic strength of the medium. This observation suggests that electrostatic forces play a major role in the binding, as might be expected from the extremely high charge density of the IP6 molecule. Two independent approaches, i.e. measurements of binding to mutant or truncated Gag proteins (Table 1) and identification of surface residues protected by IP6 from chemical modification (Figure 2), implicated both the MA and NC domains in IP6 binding. It seems unlikely that either of these domains of Gag can influence the conformation of the other, since there are several flexible regions between them.14,28,29–32 Thus, the IP6 binding studies lead us to favor the idea that a Gag molecule is folded over in solution, with its N and C-terminal domains near each other in three-dimensional space. Biophysical studies in the accompanying article50 provide direct support for the hypothesis that Gag is folded over in solution even in the absence of IP6. Thus, this conformation is not induced by IP6 binding, although it could be stabilized by IP6.33 It should be noted that a recent study implicated a different set of basic residues in the interaction of MA protein with phosphatidylinositol 4,5-bisphosphate, a molecule closely related to IP6.34
Monomer-dimer equilibrium of Gag
As noted above, the CTD of free CA protein contains a well-characterized dimer interface.13,14,21,22–24 Several lines of evidence indicate that Gag dimerizes via this same interface. We found that the Kd for Gag dimerization, 5.5 μM (Figure 3), is very similar to that of isolated CA protein (10–18 μM).14 Dimerization of Gag is exothermic, with a ΔH of 30.9 kcal/mol (Figure 3(c)); this magnitude suggests the possibility of a major role for hydrogen bonds and/or salt-bridges in the dimeric linkage between Gag molecules. Dimers of the CTD of CA are apparently held together by both of these types of bonds.21 Moreover, deletion of the majority of the MA domain does not significantly affect the Kd for dimerization of Gag (Figure 5). Finally, mutation of a pair of key residues, i.e. W316 and M317 (residues 184 and 185 of CA), within the dimer interface of CA greatly attenuates the tendency of Gag to dimerize (Figure 6(a)). In turn, this mutant protein remains almost entirely monomeric at concentrations as high as 20 μM; we have exploited this property in a biophysical analysis of the mutant protein (accompanying article50).
Monomer-trimer equilibrium of Gag in IP6
Remarkably, addition of IP6 alters the interaction between Gag molecules, resulting in a monomer-trimer, rather than monomer-dimer equilibrium (Figure 4). It seems likely that the threefold interaction is determined by protein–protein interactions between the MA domains, since free MA protein crystallizes as a trimer,35,36 and since histidine-tagged recombinant MA and MA-CA proteins can apparently trimerize spontaneously.37 However, it is interesting that WM Gag, bearing a mutation at the dimer interface in the CTD of the CA domain, is also greatly impaired in its ability to trimerize in IP6. Thus, the dimer interface within CA is crucial for the trimeric interaction (Figure 6).
One explanation for this property of WM Gag is that dimerization is a prerequisite for trimerization. For example, perhaps trimers are formed by addition of a monomer to a pre-formed dimer. Alternatively, it is possible that IP6 switches the CTD region into an alternative conformation, in which Trp316 and Met317 participate directly in a threefold contact between Gag molecules. Unfortunately, we were unable to quantify the ability of WM Gag to participate in trimerization together with wild-type Gag, and thus could not distinguish between these possibilities. We also have no information on the relative orientations of the molecules in Gag oligomers.
It is intriguing to note that this shift in CTD conformation, if it occurs, would be dictated by the binding of IP6 to the MA (or, conceivably, NC) domain. This suggests that conformational information might be transmitted between the different domains of Gag, despite the presence of one flexible linker between MA and NTD30 and another between NTD and CTD.14,28,29 While there is no direct evidence that the structure of CTD can be affected by MA, the change in conformation of the NTD upon its release from MA is well-documented,28,30,38,39 and the NTD and CTD of free CA protein can evidently interact with each other.40,41 Another report has also raised the possibility that the CTD domain of Gag exhibits domain-swapping, relative to its structure in free CA protein.42
Implications for HIV-1 particle assembly
It was reported earlier that Gag protein with a large deletion in its MA domain (Δ16–99) does not require IP5 or IP6 (IP5/6) for assembly of full-sized VLPs.9,12,19 As might be expected, the absence of most of the MA domain greatly reduced the affinity of this protein for IP6 (Table 1). The ability of Δ16–99 Gag to form full-sized VLPs without IP5/6 suggests that the latter cofactor, with its high negative charge density, is needed to overcome repulsive interactions between basic residues in MA that might interfere with proper assembly. We found (Figure 5) that the deleted protein dimerizes in solution (these SE measurements were made at 0.5 M NaCl, where there is no detectable interaction of this protein with IP6). This result may indicate that trimerization in solution is not essential for correct VLP assembly. However, the assembly analyses are performed at much lower ionic strength (0.1 M NaCl); thus, it is also possible that Δ16–99 Gag, lacking stretches of basic residues in MA, switches spontaneously to trimeric interaction in the assembly reactions. In any case, the fact that this protein, lacking most of its MA domain, does not trimerize (in 0.5 M NaCl) is further evidence for the idea that residues within MA direct the trimerization of Gag when IP6 is added.
In some ways, the binding of IP6 to the MA domain of Gag seems to mimic myristylation of the N terminus of MA or MA-CA.43 In both cases, the protein trimerizes in relatively concentrated solutions. Further, if a CA moiety is present, then the CA domain enhances the trimerization reaction. This analogy raises the possibility that the IP5/6 requirement for correct assembly in vitro12 only arises because our recombinant Gag protein lacks the myristate modification. It would be of great interest to determine whether myristylated Gag protein, which would presumably trimerize in solution, would form full-size VLPs in a defined system containing only nucleic acid as cofactor. We have thus far been unable to produce myristylated Gag in soluble form (data not shown). Functional replacement of the myristate group with IP5/6 would be remarkable, since these two small molecules are extremely dissimilar in their chemical characteristics.
While our data here and in the accompanying paper50 indicate that Gag is folded over in solution, an immature retrovirus particle is composed of highly elongated, rod-shaped Gag molecules.10,44,45 Our results thus imply that a Gag molecule must undergo a drastic conformational change during the process of assembly. It should be noted that the VLPs assembled in the absence of IP5/6 are so small (25–30 nm in diameter)11 that they cannot be composed of radially arranged 20–25 nm rods, as in authentic immature particles. We therefore believe that Gag is folded over in these small VLPs, as well as in free solution. One hypothesis that is consistent with the entire body of data is the following: Gag is compact in solution. Binding to nucleic acid causes it to assemble into VLPs, but does not induce the extension of the protein, so that the VLPs are very small. IP5/6 binds to a Gag molecule at both ends in solution, perhaps stabilizing the folded conformation.33 However, when both IP5/6 and nucleic acid are present, nucleic acid displaces the IP5/6 from the NC domain, finally allowing extension of Gag and assembly into full-sized VLPs. (It is also possible that phosphatidylinositol (4,5) bisphosphate, rather than IP5/6, modulates the assembly of HIV-1 virions at the plasma membrane of the virus-producing cell.46) Current experiments are exploring the conformation of the protein in the presence of nucleic acid and/or IPs.
Materials and Methods
Protein expression and purification
Escherichia coli BL21(DE3)pLysS cells expressing the protein of interest were grown and induced for protein expression as described.11 Proteins were purified by a protocol described previously11 with some modifications. The frozen bacterial pellet was resuspended on ice in lysis buffer (20 mM Tris-HCl (pH 7.4), 0.5 M NaCl, 10% (v/v) glycerol, 400 μM ZnCl2, 1 mM phenylmethylsulfonyl fluoride (PMSF), 10 mM β-mercaptoethanol, 1 mM Tris(2-carboxyethyl)phosphine, 0.05% NP40) to make a 10% (w/v) bacterial homogenate. The cells were broken by sonication, insoluble debris was removed by centrifugation, and soluble protein was precipitated with 30% saturated ammonium sulfate. The precipitate was resuspended in lysis buffer without glycerol and the expressed protein was purified by phosphocellulose (Whatman P11) chromatography. The purified proteins were stored in storage buffer (20 mM Tris-HCl (pH 7.4), with 0.5 M NaCl, 1 mM PMSF and 10 mM dithiothreitol (DTT)) at 5–10 mg/ml. Protein concentrations were determined by spectrophotometry in 6 M guanidine hydrochloride; whenever they were compared, these absorbance results were always consistent with colorimetric (Bradford) assays. The two zinc fingers per molecule in a Gag preparation were found by flame atomic absorption spectrophotometry to be 75–82% occupied with zinc. Purified HIV-1 MA, MA-NTD, and MA-CA proteins were kind gifts from Dr Wesley I. Sundquist, University of Utah. The plasmid expressing “8N” Gag, in which residues 15, 18, 20, 22, 26, 27, 28, and 30 (all lysine or arginine) are replaced by asparagine,16 was constructed by replacement of a restriction fragment in the original Δp6 expression vector with a fragment amplified from pGEM 3Z/T7 8N (a kind gift from Dr Marilyn Resh, Memorial Sloan-Kettering Cancer Center).
Unless specified otherwise, all analyses of Gag and WM Gag proteins were conducted in 0.5 M NaCl/20 mM Tris (pH 7.4). For SE experiments, the proteins were further purified on a Superose 12 column (Amersham) before use.
WM Gag in which tryptophan residues were partially replaced by hydroxytryptophan was produced as described.47 BL21/λDE3 bacteria auxotrophic for tryptophan (a kind gift from A.R. Merrill, University of Guelph) were transformed both with our bacterial WM Gag expression vector and with a plasmid expressing pLysE, and were induced in minimal medium containing a mixture of tryptophan and hydroxytryptophan.
Mutagenesis
Mutations were introduced into the Δp6 Gag bacterial expression vector by overlap extension PCR.48 The entire Δp6 open reading frame was sequenced to confirm the presence of the desired mutation and the absence of any other changes from the wild-type sequence.
IP6 binding measurements
Binding of [3H]IP6 (Perkin-Elmer) to proteins was measured as described.15 Binding assays were performed in 20 mM Tris (pH 7.4), 1 mM EDTA, 10 mM DTT in the presence of the indicated NaCl concentration. Proteins were at 2 μM, together with IgG as carrier at 1 mg/ml. Radioactive IP6 bound to protein was collected by precipitation with 20% (w/w) polyethylene glycol 8000. Unlabeled IP6 was from Calbiochem.
Mapping IP6 binding site by footprinting
The methods used for identifying surface lysine residues that are protected by IP6 have been described.17 Briefly, Gag at 20 μM is exposed to NHS-biotin (Pierce) in 50 mM Hepes (pH 7.5), 0.1 M NaCl, 2 mM β-mercaptoethanol, 1 mM DTT, and biotinylated lysine residues are identified by mass spectrometry. We used 400 μM NHS-biotin for footprinting because preliminary experiments showed that this concentration did not significantly disrupt a pre-formed complex between IP6 and Gag.
We also monitored surface accessibility of arginine residues as follows. Free Gag or pre-formed Gag-IP6 complexes were subjected to HPG (Pierce, Rockford, IL) modification in 50 mM Hepes, 50 mM boric acid (pH 8.0), 2 mM β-mercaptoethanol, 1 mM DTT, 100 mM (or, where indicated, 250 mM) NaCl. HPG reacts with guanidino groups on arginine residues resulting in a 132 Da increment. The reactions were carried out at 37 °C for 60 min and were quenched with 10 mM (final concentration) arginine in its free amino acid form.
Size-exclusion chromatography and light scattering
A Rainin HPXL solvent delivery system connected to a Rainin Dynamax UV-1 detector and a Wyatt systems Dawn EOS static light scattering detector was used to study the properties of the proteins on a Superose 12 (GE Healthcare) column. Data collected simultaneously from light detectors 5 through 18 (with the exception of detector 13) were used for SLS. ASTRA software from Wyatt was used to analyze the light scattering data. All studies were done in 20 mM Tris HCl (pH 7.4), 0.5 M NaCl, 1 mM PMSF as a solvent system. The purified proteins were thawed rapidly in a water bath at 30 °C and then filtered through Pall Microsep centrifugal filtration devices with 300 or 1000 kDa cutoff, prior to chromatography. Protein concentration was then determined and 50 μl samples were injected into the column, which had been previously equilibrated with at least ten bed volumes of solvent. BSA (Sigma) was used with every run to calibrate the system.
Sedimentation equilibrium measurements
SE analysis was carried out in an Optima XL-A analytical ultracentrifuge (Beckman-Coulter Instruments). 1 mM DTT was included in the buffer used in these experiments. The biophysical foundation of this methodology has been reviewed recently.49 Cells with 12 mm optical path length were loaded with 180 μl of the protein solution, while 3 mm cells contained 50 μl. Sedimentation equilibrium absorbance data at radial increments of 0.001 cm with ten repeats were obtained at rotor speeds indicated in the Figure legends. All SE experiments were performed at 4 °C. Where necessary to avoid saturation of the absorbance measurements, cells with optical path lengths of 0.3 mm rather than 1.2 mm were used, and absorbance was monitored at 254 rather than 280 nm. The public domain software program SEDPHAT, developed by Peter Schuck, was used for the analysis of the sedimentation equilibrium data as described†. In the SE analysis the measure for the goodness of fit used in the SEDPHAT software program is the “reduced chi-square” as described‡.
Hydroxytryptophan-containing protein was analyzed in the presence of unsubstituted protein by following absorbance at 306 nm. The molar extinction coefficient ε306 of the substituted WM Gag was measured as 17,454 cm−1 M−1, while unsubstituted wild-type protein had a value of 870 cm−1 M−1.
SE profiles of mixtures of wild-type Gag and hydroxytryptophan-containing WM Gag were modeled by assuming that each of the two species could form homodimers. In addition, it was assumed that they could associate to form heterodimers and either of two heterotrimers, as well as tetramers, as follows:
Isothermal titration calorimetry
The protein dimer dissociation studies were performed with a VP-ITC Microcalorimeter (MicroCal LLC, Northampton, MA) at 25 °C. In a typical experiment, 15–20 aliquots, each 15 μl, of 0.1–0.2 mM protein solution in a buffer mixture were injected into the ITC cell (volume ~ 1.4 ml).
The integrated dilution heat values were adjusted in order to eliminate the post-dilution thermal effects. The resulting heats of dissociation were fit using MicroCal's Dimer Dissociation Model software to yield the dissociation constant and enthalpy of dissociation.18 It should be noted that the lower panel in Figure 3(c), depicting the cumulative heat taken up upon dilution of the Gag protein, should not be compared to a binding isotherm; rather, it shows the total concentration of Gag at which the ratio of the monomeric to the dimeric form of the protein in the lower (diluted) chamber of the calorimeter is becoming constant.
Acknowledgments
We thank Dr Joan C. May and Joseph J. Prograr (Food and Drug Administration) for measurements of the zinc content of Gag protein; Dr Wes Sundquist for purified MA, MA-NTD, and MA-CA proteins; Gerry Prentice and Dr A.R. Merrill for E. coli auxotrophic for tryptophan and for very helpful advice; Dr Marilyn Resh for the 8N plasmid; Richard Frederickson for invaluable assistance with graphics; and Dr Alex Wlodawer (NCI) for the use of an analytical ultracentrifuge. This project has been funded in whole or in part with federal funds from the National Cancer Institute, National Institutes of Health, under contract N01-CO-12400. The content of this publication does not necessarily reflect the views or policies of the Department of Health and Human Services, nor does mention of trade names, commercial products, or organizations imply endorsement by the U.S. Government. This Research was supported in part by the Intramural Research Program of the NIH, National Cancer Institute, Center for Cancer Research.
Abbreviations used
- MA
matrix
- CA
capsid
- NC
nucleocapsid
- VLP
virus-like particle
- IP
inositol phosphate
- IP5
D-myo-inositol 1,3,4,5,6-pentakisphosphate
- IP6
D-myo-inositol hexakisphosphate
- NTD
N-terminal domain of capsid
- CTD
C-terminal domain of capsid
- SLS
static light scattering
- SE
sedimentation equilibrium
- ITC
isothermal titration calorimetry
- NHS-biotin
N-hydroxysuccinimidobiotin
- IP5/6
inositol pentakisphosphate or inositol hexakisphosphate
- HPG
p-hydroxyphenylglyoxal
Footnotes
Present address: S. J. Campbell, James A. Baker Institute for Animal Health, Hungerford Hill Road, Cornell University, Ithaca, NY 14853, USA.
References
- 1.Swanstrom R, Wills JW. Synthesis, assembly, and processing of viral proteins. In: Coffin JM, Hughes SH, Varmus HE, editors. Retro-viruses. Cold Spring Harbor Laboratory Press; Plainview, NY: 1997. –263.pp. 334 [PubMed] [Google Scholar]
- 2.Jowett J, Hockley D, Nermut M, Jones I. Distinct signals in human immunodeficiency virus type 1 Pr55 necessary for RNA binding and particle formation [published erratum appears in J Gen Virol 1993 May;74(5):943] J Gen Virol. 1992;73:3079–3086. doi: 10.1099/0022-1317-73-12-3079. [DOI] [PubMed] [Google Scholar]
- 3.Bennett RP, Nelle TD, Wills JW. Functional chimeras of the Rous sarcoma virus and human immunodeficiency virus gag proteins. J Virol. 1993;67:6487–6498. doi: 10.1128/jvi.67.11.6487-6498.1993. [DOI] [PMC free article] [PubMed] [Google Scholar]
- 4.Campbell S, Vogt VM. Self-assembly in vitro of purified CA-NC proteins from Rous sarcoma virus and human immunodeficiency virus type 1. J Virol. 1995;69:6487–6497. doi: 10.1128/jvi.69.10.6487-6497.1995. [DOI] [PMC free article] [PubMed] [Google Scholar]
- 5.Sandefur S, Varthakavi V, Spearman P. The I domain is required for efficient plasma membrane binding of human immunodeficiency virus type 1 Pr55Gag. J Virol. 1998;72:2723–2732. doi: 10.1128/jvi.72.4.2723-2732.1998. [DOI] [PMC free article] [PubMed] [Google Scholar]
- 6.Muriaux D, Mirro J, Harvin D, Rein A. RNA is a structural element in retrovirus particles. Proc Natl Acad Sci USA. 2001;98:5246–5251. doi: 10.1073/pnas.091000398. [DOI] [PMC free article] [PubMed] [Google Scholar]
- 7.Khorchid A, Halwani R, Wainberg MA, Kleiman L. Role of RNA in facilitating Gag/Gag-Pol interaction. J Virol. 2002;76:4131–4137. doi: 10.1128/JVI.76.8.4131-4137.2002. [DOI] [PMC free article] [PubMed] [Google Scholar]
- 8.Klikova M, Rhee SS, Hunter E, Ruml T. Efficient in vivo and in vitro assembly of retroviral capsids from Gag precursor proteins expressed in bacteria. J Virol. 1995;69:1093–1098. doi: 10.1128/jvi.69.2.1093-1098.1995. [DOI] [PMC free article] [PubMed] [Google Scholar]
- 9.Gross I, Hohenberg H, Wilk T, Wiegers K, Grättinger M, Müller B, et al. A conformational switch controlling HIV-1 morphogenesis. EMBO J. 2000;19:103–113. doi: 10.1093/emboj/19.1.103. [DOI] [PMC free article] [PubMed] [Google Scholar]
- 10.Wilk T, Gross I, Gowen BE, Rutten T, de Haas F, Welker R, et al. Organization of immature human immunodeficiency virus type 1. J Virol. 2001;75:759–771. doi: 10.1128/JVI.75.2.759-771.2001. [DOI] [PMC free article] [PubMed] [Google Scholar]
- 11.Campbell S, Rein A. In vitro assembly properties of human immunodeficiency virus type 1 Gag protein lacking the p6 domain. J Virol. 1999;73:2270–2279. doi: 10.1128/jvi.73.3.2270-2279.1999. [DOI] [PMC free article] [PubMed] [Google Scholar]
- 12.Campbell S, Fisher RJ, Towler EM, Fox S, Issaq HJ, Wolfe T, et al. Modulation of HIV-like particle assembly in vitro by inositol phosphates. Proc Natl Acad Sci USA. 2001;98:10875–10879. doi: 10.1073/pnas.191224698. [DOI] [PMC free article] [PubMed] [Google Scholar]
- 13.Rose S, Hensley P, O'Shannessy DJ, Culp J, Debouck C, Chaiken I. Characterization of HIV-1 p24 self-association using analytical affinity chromatography. Proteins: Struct Funct Genet. 1992;13:112–119. doi: 10.1002/prot.340130204. [DOI] [PubMed] [Google Scholar]
- 14.Gamble TR, Yoo S, Vajdos FF, von Schwedler UK, Worthylake DK, Wang H, et al. Structure of the carboxyl-terminal dimerization domain of the HIV-1 capsid protein. Science. 1997;278:849–853. doi: 10.1126/science.278.5339.849. [DOI] [PubMed] [Google Scholar]
- 15.Fleischer B, Xie J, Mayrleitner M, Shears SB, Palmer DJ, Fleischer S. Golgi coat-omer binds, and forms K(+)-selective channels gated by, inositol polyphosphates. J Biol Chem. 1994;269:17826–17832. [PubMed] [Google Scholar]
- 16.Zhou W, Parent LJ, Wills JW, Resh MD. Identification of a membrane-binding domain within the amino-terminal region of human immunodeficiency virus type 1 Gag protein which interacts with acidic phospholipids. J Virol. 1994;68:2556–2569. doi: 10.1128/jvi.68.4.2556-2569.1994. [DOI] [PMC free article] [PubMed] [Google Scholar]
- 17.Shkriabai N, Datta SA, Zhao Z, Hess S, Rein A, Kvaratskhelia M. Interactions of HIV-1 Gag with assembly cofactors. Biochemistry. 2006;45:4077–4083. doi: 10.1021/bi052308e. [DOI] [PubMed] [Google Scholar]
- 18.Burrows SD, Doyle ML, Murphy KP, Franklin SG, White JR, Brooks I, et al. Determination of the monomer-dimer equilibrium of interleukin-8 reveals it is a monomer at physiological concentrations. Biochemistry. 1994;33:12741–12745. doi: 10.1021/bi00209a002. [DOI] [PubMed] [Google Scholar]
- 19.Facke M, Janetzko A, Shoeman RL, Krausslich HG. A large deletion in the matrix domain of the human immunodeficiency virus gag gene redirects virus particle assembly from the plasma membrane to the endoplasmic reticulum. J Virol. 1993;67:4972–4980. doi: 10.1128/jvi.67.8.4972-4980.1993. [DOI] [PMC free article] [PubMed] [Google Scholar]
- 20.Ehrlich LS, Agresta BE, Carter CA. Assembly of recombinant human immunodeficiency virus type 1 capsid protein in vitro. J Virol. 1992;66:4874–4883. doi: 10.1128/jvi.66.8.4874-4883.1992. [DOI] [PMC free article] [PubMed] [Google Scholar]
- 21.Worthylake DK, Wang H, Yoo S, Sundquist WI, Hill CP. Structures of the HIV-1 capsid protein dimerization domain at 2.6 A resolution. Acta Crystallog sect D. 1999;55:85–92. doi: 10.1107/S0907444998007689. [DOI] [PubMed] [Google Scholar]
- 22.Mateu MG. Conformational stability of dimeric and monomeric forms of the C-terminal domain of human immunodeficiency virus-1 capsid protein. J Mol Biol. 2002;318:519–531. doi: 10.1016/S0022-2836(02)00091-8. [DOI] [PubMed] [Google Scholar]
- 23.del Alamo M, Neira JL, Mateu MG. Thermodynamic dissection of a low affinity protein-protein interface involved in human immunodeficiency virus assembly. J Biol Chem. 2003;278:27923–27929. doi: 10.1074/jbc.M304466200. [DOI] [PubMed] [Google Scholar]
- 24.Del Alamo M, Mateu MG. Electrostatic repulsion, compensatory mutations, and long-range non-additive effects at the dimerization interface of the HIV capsid protein. J Mol Biol. 2005;345:893–906. doi: 10.1016/j.jmb.2004.10.086. [DOI] [PubMed] [Google Scholar]
- 25.Li S, Hill CP, Sundquist WI, Finch JT. Image reconstructions of helical assemblies of the HIV-1 CA protein. Nature. 2000;407:409–413. doi: 10.1038/35030177. [DOI] [PubMed] [Google Scholar]
- 26.von Schwedler UK, Stray KM, Garrus JE, Sundquist WI. Functional surfaces of the human immunodeficiency virus type 1 capsid protein. J Virol. 2003;77:5439–5450. doi: 10.1128/JVI.77.9.5439-5450.2003. [DOI] [PMC free article] [PubMed] [Google Scholar]
- 27.Ganser-Pornillos BK, von Schwedler UK, Stray KM, Aiken C, Sundquist WI. Assembly properties of the human immunodeficiency virus type 1 CA protein. J Virol. 2004;78:2545–2552. doi: 10.1128/JVI.78.5.2545-2552.2004. [DOI] [PMC free article] [PubMed] [Google Scholar]
- 28.Gamble TR, Vajdos FF, Yoo S, Worthylake DK, Houseweart M, Sundquist WI, Hill CP. Crystal structure of human cyclophilin A bound to the amino-terminal domain of HIV-1 capsid. Cell. 1996;87:1285–1294. doi: 10.1016/s0092-8674(00)81823-1. [DOI] [PubMed] [Google Scholar]
- 29.Gitti RK, Lee BM, Walker J, Summers MF, Yoo S, Sundquist WI. Structure of the amino-terminal core domain of the HIV-1 capsid protein. Science. 1996;273:231–235. doi: 10.1126/science.273.5272.231. [DOI] [PubMed] [Google Scholar]
- 30.Tang C, Ndassa Y, Summers MF. Structure of the N-terminal 283-residue fragment of the immature HIV-1 Gag polyprotein. Nature Struct Biol. 2002;9:537–543. doi: 10.1038/nsb806. [DOI] [PubMed] [Google Scholar]
- 31.De Guzman RN, Wu ZR, Stalling CC, Pappalardo L, Borer PN, Summers MF. Structure of the HIV-1 nucleocapsid protein bound to the SL3 psi-RNA recognition element. Science. 1998;279:384–388. doi: 10.1126/science.279.5349.384. [DOI] [PubMed] [Google Scholar]
- 32.Amarasinghe GK, De Guzman RN, Turner RB, Chancellor KJ, Wu ZR, Summers MF. NMR structure of the HIV-1 nucleocapsid protein bound to stem-loop SL2 of the psi-RNA packaging signal. Implications for genome recognition. J Mol Biol. 2000;301:491–511. doi: 10.1006/jmbi.2000.3979. [DOI] [PubMed] [Google Scholar]
- 33.Macbeth MR, Schubert HL, Vandemark AP, Lingam AT, Hill CP, Bass BL. Inositol hexakisphosphate is bound in the ADAR2 core and required for RNA editing. Science. 2005;309:1534–1539. doi: 10.1126/science.1113150. [DOI] [PMC free article] [PubMed] [Google Scholar]
- 34.Saad JS, Miller J, Tai J, Kim A, Ghanam RH, Summers MF. Structural basis for targeting HIV-1 Gag proteins to the plasma membrane for virus assembly. Proc Natl Acad Sci USA. 2006;103:11364–11369. doi: 10.1073/pnas.0602818103. [DOI] [PMC free article] [PubMed] [Google Scholar]
- 35.Massiah MA, Worthylake D, Christensen AM, Sundquist WI, Hill CP, Summers MF. Comparison of the NMR and X-ray structures of the HIV-1 matrix protein: evidence for conformational changes during viral assembly. Protein Sci. 1996;5:2391–2398. doi: 10.1002/pro.5560051202. [DOI] [PMC free article] [PubMed] [Google Scholar]
- 36.Hill CP, Worthylake D, Bancroft DP, Christensen AM, Sundquist WI. Crystal structures of the trimeric human immunodeficiency virus type 1 matrix protein: implications for membrane association and assembly. Proc Natl Acad Sci USA. 1996;93:3099–3104. doi: 10.1073/pnas.93.7.3099. [DOI] [PMC free article] [PubMed] [Google Scholar]
- 37.Morikawa Y, Zhang WH, Hockley DJ, Nermut MV, Jones IM. Detection of a trimeric human immunodeficiency virus type 1 Gag intermediate is dependent on sequences in the matrix protein, p17. J Virol. 1998;72:7659–7663. doi: 10.1128/jvi.72.9.7659-7663.1998. [DOI] [PMC free article] [PubMed] [Google Scholar]
- 38.von Schwedler UK, Stemmler TL, Klishko VY, Li S, Albertine KH, Davis DR, Sundquist WI. Proteolytic refolding of the HIV-1 capsid protein amino-terminus facilitates viral core assembly. EMBO J. 1998;17:1555–1568. doi: 10.1093/emboj/17.6.1555. [DOI] [PMC free article] [PubMed] [Google Scholar]
- 39.Mortuza GB, Haire LF, Stevens A, Smerdon SJ, Stoye JP, Taylor IA. High-resolution structure of a retroviral capsid hexameric amino-terminal domain. Nature. 2004;431:481–485. doi: 10.1038/nature02915. [DOI] [PubMed] [Google Scholar]
- 40.Lanman J, Sexton J, Sakalian M, Prevelige PE., Jr Kinetic analysis of the role of intersubunit interactions in human immunodeficiency virus type 1 capsid protein assembly in vitro. J Virol. 2002;76:6900–6908. doi: 10.1128/JVI.76.14.6900-6908.2002. [DOI] [PMC free article] [PubMed] [Google Scholar]
- 41.Lanman J, Lam TT, Barnes S, Sakalian M, Emmett MR, Marshall AG, Prevelige PE. Identification of novel interactions in HIV-1 capsid protein assembly by high-resolution mass spectrometry. J Mol Biol. 2003;325:759–772. doi: 10.1016/s0022-2836(02)01245-7. [DOI] [PubMed] [Google Scholar]
- 42.Ivanov D, Stone JR, Maki JL, Collins T, Wagner G. Mammalian SCAN domain dimer is a domain-swapped homolog of the HIV capsid C-terminal domain. Mol Cell. 2005;17:137–143. doi: 10.1016/j.molcel.2004.12.015. [DOI] [PubMed] [Google Scholar]
- 43.Tang C, Loeliger E, Luncsford P, Kinde I, Beckett D, Summers MF. Entropic switch regulates myristate exposure in the HIV-1 matrix protein. Proc Natl Acad Sci USA. 2004;101:517–522. doi: 10.1073/pnas.0305665101. [DOI] [PMC free article] [PubMed] [Google Scholar]
- 44.Fuller SD, Wilk T, Gowen BE, Krausslich HG, Vogt VM. Cryo-electron microscopy reveals ordered domains in the immature HIV-1 particle. Curr Biol. 1997;7:729–738. doi: 10.1016/s0960-9822(06)00331-9. [DOI] [PubMed] [Google Scholar]
- 45.Yeager M, Wilson-Kubalek EM, Weiner SG, Brown PO, Rein A. Supramolecular organization of immature and mature murine leukemia virus revealed by electron cryo-microscopy: implications for retroviral assembly mechanisms. Proc Natl Acad Sci USA. 1998;95:7299–7304. doi: 10.1073/pnas.95.13.7299. [DOI] [PMC free article] [PubMed] [Google Scholar]
- 46.Ono A, Ablan SD, Lockett SJ, Nagashima K, Freed EO. Phosphatidylinositol (4,5) bisphosphate regulates HIV-1 Gag targeting to the plasma membrane. Proc Natl Acad Sci USA. 2004;101:14889–14894. doi: 10.1073/pnas.0405596101. [DOI] [PMC free article] [PubMed] [Google Scholar]
- 47.Mohammadi F, Prentice GA, Merrill AR. Protein-protein interaction using tryptophan analogues: novel spectroscopic probes for toxin-elongation factor-2 interactions. Biochemistry. 2001;40:10273–10283. doi: 10.1021/bi011035u. [DOI] [PubMed] [Google Scholar]
- 48.Sambrook J, Russell DW. Molecular Cloning: A Laboratory Manual. 3. Cold Spring Harbor Laboratory Press; Cold Spring Harbor, New York: 2001. [Google Scholar]
- 49.Lebowitz J, Lewis MS, Schuck P. Modern analytical ultracentrifugation in protein science: a tutorial review. Protein Sci. 2002;11:2067–2079. doi: 10.1110/ps.0207702. [DOI] [PMC free article] [PubMed] [Google Scholar]
- 50.Datta SAK, Curtis JE, Ratcliff W, Clark PK, Crist RM, Lebowitz J, et al. Conformation of the HIV-1 Gag protein in solution. J Mol Biol. 2006;365:812–824. doi: 10.1016/j.jmb.2006.10.073. [DOI] [PMC free article] [PubMed] [Google Scholar]