

Abstract
Quantification of gene expression provides valuable information regarding the response of cells or tissue to stimuli and is often accomplished by monitoring the level of messenger RNA (mRNA) being transcribed for a particular protein. While numerous methods are commonly used to monitor gene expression, including northern blotting, real time polymerase chain reaction and RNase protection, each has its own drawbacks and limitations. Capillary electrophoresis with laser induced fluorescence (CE-LIF) can reduce protocol time, eliminate the need for radioactivity and provide superior sensitivity and dynamic range for quantification of RNA. In addition, CE-LIF can be used to directly determine the amount of an RNA species present, something which is difficult and not normally accomplished using current methods. Gene expression is detected using a fluorescently labeled riboprobe specific for a given RNA species. This direct approach was validated by analyzing levels of 28S RNA and also used to determine the amount of Discoidin Domain Receptor 2 mRNA in cardiac tissue.
Keywords: RNA, gene expression, capillary electrophoresis, fluorescence
INTRODUCTION
The analysis of gene expression is a common experiment conducted routinely in many laboratories. Profiling gene expression provides valuable insight into genes involved in normal cell/tissue homeostasis, organism development and information about genes, that when their expression is up or down-regulated, lead to disease. A number of methods are currently employed to examine gene expression with the most common being: Northern blotting, RNase Protection Assay (RPA) and Real-time Polymerase Chain Reaction (RT-PCR). Each of these methods has advantages and disadvantages mainly relating to sample size, cost, time involved, use of radioactivity, transcript information and sensitivity, which is estimated to vary from 10,000 copies of mRNA (Northern blotting) to theoretically 1 copy (RT-PCR) [1]. However, to be quantitative, all of these methods require some type of standard curve to provide a direct concentration or copy number of the mRNA and are instead most commonly used to provide a relative measure of change. In most cases, information regarding changes in gene expression obtained by these methods involves relative changes in the intensity (either from densitometric analysis or fluorescence) which is normalized to an internal control gene with the data being presented as percent or fold increase/decrease compared to control. If a quantitative answer is desired, a time consuming standard curve must be generated using known concentrations of RNA, which may be difficult if the RNA is in short supply.
The use of capillary electrophoresis with laser induced fluorescence (CE-LIF) is an attractive alterative for the quantitation of gene expression. CE-LIF provides a fast, sensitive and non-radioactive means to detect molecules [2]. Several studies have used CE-LIF to examine the expression of a number of genes including leptin [3], cytokeratin 20 [4] and glyceraldehyde-3-phosphate dehydrogenase [5]; however, in each of these cases the RNA was first subjected to reverse transcription followed by PCR and the PCR product was then analyzed by CE-LIF. Two studies [2,6] have reported using a small fluorescently tagged oligonucleotides to quantify the expression of specific genes, but due to the nature of their experiment no size information was obtained. In addition, CE-LIF has been shown to be sensitive enough to detect the total RNA present in a single isolated cell [7,8]. The method described herein is applicable to any RNA for which some sequence information is known and represents the first direct quantitation of multiple gene expression in which the size of the target gene is maintained.
MATERIALS AND METHODS
Preparation of Fluorescently Labeled Riboprobes
Fluorescently labeled 28S and DDR2 riboprobes were prepared using the pTRI-RNA-28S plasmid (Ambion) and a fragment of the rat DDR2 gene generated by RT-PCR using primers DDR2-6 (5’-AATGATCCCGATTCCCAGAATG-3’) and DDR2-15 (5’-TCCCATGTCGGTTACGCCAG-3’) and cloned into the pCRII vector (Invitrogen). In vitro transcription of both plasmids to produce RNA was accomplished using the MAXIscript in vitro transcription kit (Ambion). Briefly, 1 μg of linearized plasmid DNA was combined with 2 μl 10X Transcription buffer, 10 μl nuclease-free water, 1 μl each of 10 mM ATP, CTP, GTP, 0.6 μl 10mM UTP, 0.4 μl 1 mM Alexa Fluor 488-5-UTP (28S and DDR2) or 0.4 μl BODIPY TR-14-UTP (28S; Molecular Probes) and 15 U/ml T7 or SP6 RNA Polymerase. To allow for sizing of RNA species during capillary electrophoresis, molecular weight makers were transcribed and labeled as described above with Alexa Fluor 488-5-UTP using the Century Marker Template (Ambion). The reaction was incubated 16-18 hours in a 37 ºC water bath followed by treatment with DNase I (15 min, 37 ºC) to digest plasmid DNA. Unincorporated nucleotides were removed using a Micro Bio-Spin 30 chromatography column (BioRad) and the concentration of the probe determined spectrophotometrically using absorbance at 260 nm. Quality and purity of synthesized probe was evaluated by denaturing agarose gel electrophoresis and capillary electrophoresis as described below.
Hybridization of Fluorescently tagged Riboprobe to Total RNA
To determine if a specific RNA could be detected in a total RNA sample using CE-LIF, 488-28S riboprobe was hybridized to 5 μg of total RNA. Total RNA was isolated from 3–4 day neonatal rat hearts using RNA STAT-60 (Tel-Test) according to the manufacturer’s directions and the concentration determined by absorbance at 260nm. RNA was combined with 488-28S riboprobe and precipitated at −20ºC for 30 min using 5M NH4OAc and 95% EtOH. The precipitated product was subjected to centifugation at 14,000 rpm for 15 min and the resulting pellet air dried. The pellet was resuspended in hybridization buffer (40mM PIPES, 1mM EDTA, 0.4M NaCl, 80% formamide), boiled for 3–4 min and incubated overnight at 42ºC. The hybridized sample was re-precipitated as described above and the resulting pellet resuspended in 10 μl of DEPC-water. Simultaneous hybridization of both 488-DDR2 and Bodipy-28S riboprobes was carried out as described above. Samples were placed in the P/ACE MDQ instrument and maintained at 4ºC until injection.
Capillary Electrophoresis with Laser-Induced Fluorescence
Fluorescent riboprobes were further analyzed by CE-LIF using a Beckman P/ACE MQD capillary electrophoresis system equipped with 488 nm and 635 nm lasers. Experiments were conducted using a 50 μm i.d. uncoated silica capillary (Beckman) with an effective length of 28 cm to the detection window and a total length of 40 cm. Prior to initial use, the capillary was conditioned by alternating pressure rinses (20 p.s.i) with methanol, 1N HCl, de-ionized water, 0.1N NaOH and 1X TBE (0.1M Tris pH 8.3, 0.1M Boric acid, 2mM EDTA). Size separation of migrating species was accomplished using a previously described hydroxypropylmethylcellulose (HPMC) matrix [7] composed of 1% HPMC (MW ~10,000), 0.5% poly(vinylpyrrolidone) (MW ~1,000,000) and 6% mannitol in 1X TBE. Immediately prior to use the HPMC matrix was passed through a 0.45 μm filter followed by sonication to remove air bubbles. Ten second pressure injections (0.5 p.s.i.) were used to introduce sample into the capillary and electrophoretic separation was accomplished using 8.0 kV constant voltage, reverse polarity and 1X TBE buffer for 40 min. Figure 1 summarizes the hybridization of probe to the target RNA and the electrophoretic separation. To quantify the level of gene expression, the area under the curve representing the free fluorescent probe and the target RNA bound to the fluorescent probe was determined using Beckman 32Karat software.
Figure 1.

Schematic Using CE-LIF to Quantify RNA Expression. Fluorescently tagged riboprobe is added in excess to a sample of RNA and allowed to undergo hybridization of the labeled riboprobe to target RNA. The sample, containing free probe, unhybridized RNA and probe-target hybrids, is injected into a silica capillary containing a sieving matrix which will separate the various components of the hybridization reaction based upon their size. Using a fluorescence detector, as the various components of the hybridization reaction pass through the detection window, only those with the fluorescent molecule incorporated (free probe or probe-target hybrids) will be detected. Since the probe is much smaller than the target-probe hybrid it passes through the detection window first followed at a later time by the target-probe hybrid.
RESULTS
Overview of RNA quantitation using CE-LIF
The goal of this work was to develop a rapid method for the direct quantitation of RNA species. Fluorescently tagged riboprobe is prepared against the target RNA and hybridized, in excess, to total RNA. Using an RNA probe instead of a DNA probe takes advantage of the increased stability of RNA-RNA hybrids compared to RNA-DNA hybrids [9, 10]. The hybridization reaction is then applied to a silicon capillary filled with a sieving matrix and under constant voltage the unhybridized probe, which is smaller than the hybridized target, migrates faster passing through the detection window first followed by the hybridized target. The resulting electropherogram thus provides not only quantitative information regarding the abundance of the target species (obtained by measuring the area under the curve) but also will reveal if multiple transcripts of a target are also present.
Characterization of Fluorescent Riboprobes
After removal of unincorporated nucleotides, riboprobes were examined both by agarose gel electrophoresis and CE-LIF to check probe purity and integrity. Figure 2 shows electropherograms from three representative 488-28S rRNA probe synthesis reactions along with the fluorescently transcribed molecular weight markers. Each sample contained 50 ng/μl and approximately 15 nl were injected into the capillary meaning approximately 0.78 ng of riboprobe was present in each run. For each probe reaction, one major peak was detected which migrated between 15 and 17.5 minutes. Using T7 RNA polymerase to transcribe the TRI-RNA-28S rRNA plasmid, a 155 base riboprobe was produced. The fluorescent riboprobe produced in these reactions migrates between the 100 and 200 base RNA markers as would be expected for a probe of this size (Figure 2). Analysis by denaturing agarose gel electrophoresis also showed a single band whose migration was consistent with a riboprobe of this size (data not shown). Identical results were obtained when the 28S rRNA riboprobe was produce with the Bodipy-UTP. A similar analysis was conducted with the 488-DDR2 probe, demonstrating that upon transcription with SP6 polymerase, a 492 base riboprobe was produced.
Figure 2.
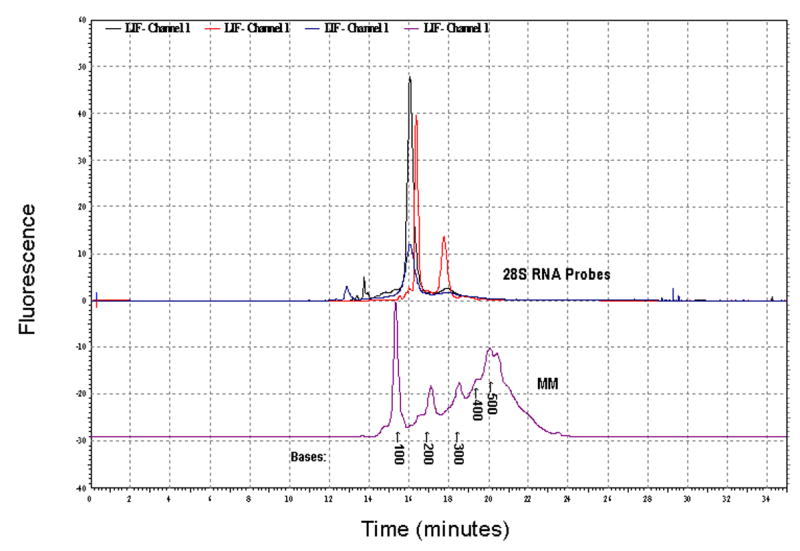
Characterization of Fluorescently labeled 28S rRNA Riboprobe. Multiple electropherograms representing independent probe synthesis reactions have been overlaid and are shown in the upper portion of this figure with a fluorescently labeled molecular weight marker (MM) shown in the lower portion. In each of the probe reactions, a major peak migrating between 15 and 17.5 minutes was observed. This migration time, when compared to the migration times for the molecular weight markers, would equate to a probe 155 bases in length.
Determination of 28S rRNA present in 5 μg of Total RNA
A representative electropherogram is shown for the hybridization of 5 μg of total RNA (Figure 3). In all hybridization reactions two peaks were observed, an initial fast migrating peak due to free, unhybridized fluorescent probe and a second slower migrating peak due to the 28S rRNA-fluorescent probe hybrid. The veracity of the method presented here was verified by performing a series of CE runs using decreasing amounts of RNA. Figure 4 shows the area of the probe:target hybrid peak obtained across a range from 10 μg to 0.6 μg total RNA in the sample. The linear fit demonstrates that, as would be expected, change in mass of input RNA results in a proportional change in probe:target hybrid signal.
Figure 3.
Post-hybridization Electropherogram. A representative electropherogram is shown for the hybridization of 5 μg of total RNA with the 488-28S probe. Note a small fluorescent peak corresponding to unhybridized, free probe migrating around 15 minutes and a second larger peak, representing the 28S RNA-488-28S probe hybrid was also detected.
Figure 4.
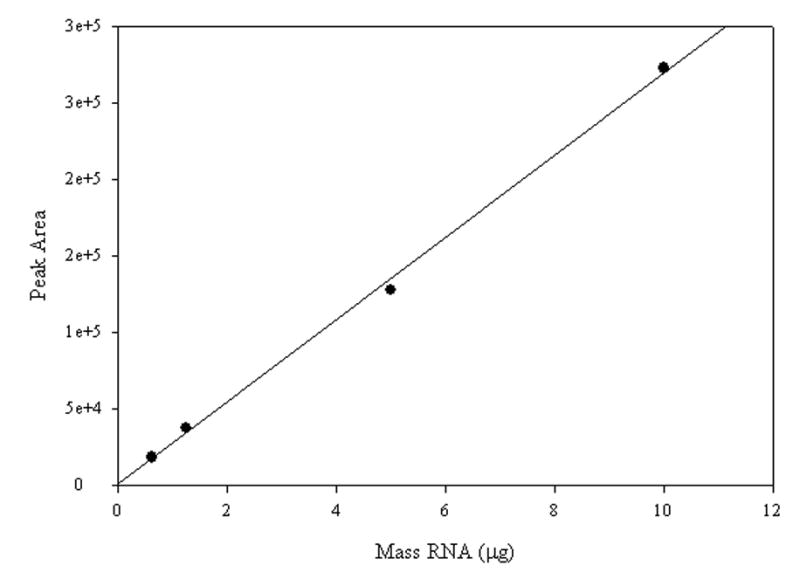
Probe:target peak area vs. total RNA. Plotting probe:target peak area against total RNA over a range of input RNA masses produced a linear response whose best fit straight line has an R2 = 0.998.
To determine the amount of 28S rRNA present in 5 μg of total RNA and at what point the probe was present in excess, binding curves were constructed from experiments in which the amount of total RNA in the hybridization reaction remained constant and the amount of 488-28S rRNA riboprobe was varied. Given a 1:1 binding between labeled riboprobe and target RNA, the area under the peak (denoted as hybridized product in Figure 3) represents the amount of target RNA present. The graph in Figure 5 shows peak area plotted versus amount of probe and is fit to the equation describing a single site binding event. It is evident from this plot that saturation of target RNA occurred and the resulting Kd value obtained was 33 ng for 5 μg of total RNA. Since Kd represents the half-maximal concentration of probe, this would correspond to 66 ng of 28S rRNA riboprobe hybridized to 5 μg of total RNA. This Kd value equates to 2.5 μg of 28S rRNA in a 5 μg sample of total RNA.
Figure 5.
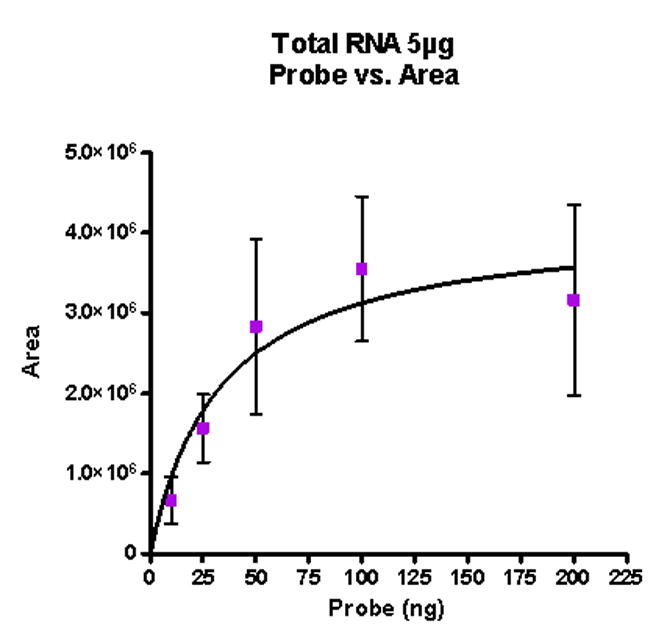
Analysis of 488-28S rRNA riboprobe binding to 28S RNA. Using a single site binding model, , a binding curve was generated for 5 μg of total RNA hybridized to 488-28S rRNA riboprobe. This curve demonstrates the hybridization reaction reached saturation at sufficient probe concentration, with a Kd value of 33 ng (5 μg of total RNA) for the probe target sequence. Since Kd is the half-maximal concentration of target RNA sequence, 2Kd represents the amount of target sequence present at saturation, corresponding to 66 ng.
Simultaneous Detection of Multiple Genes using CE-LIF
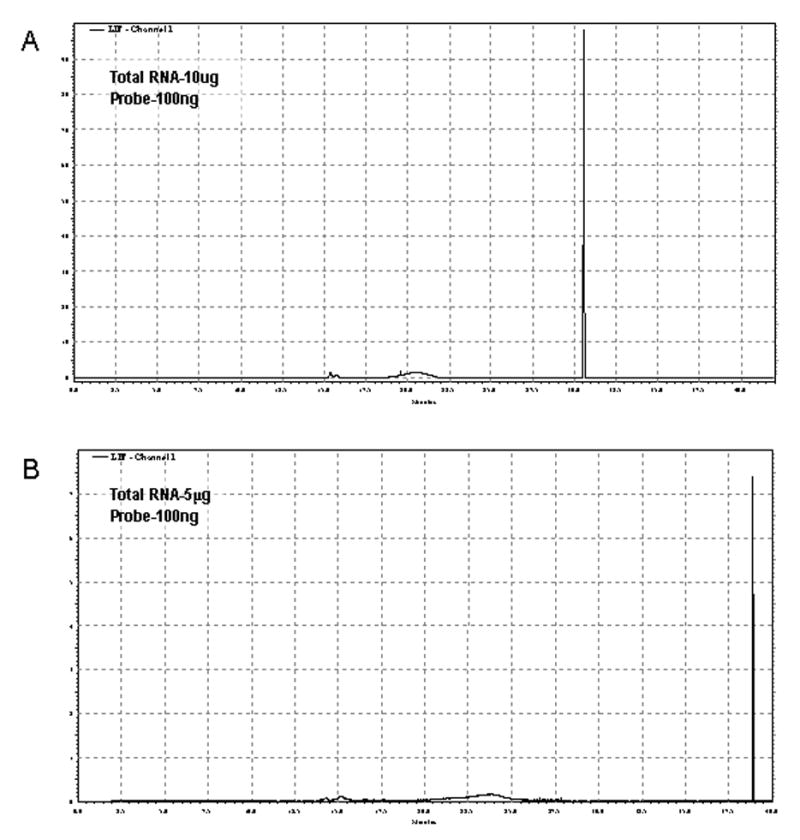
While the analysis of a single gene can provide valuable information regarding changes in expression, the simultaneous quantitation of multiple transcripts is advantageous, especially if the amount of RNA is limited. To determine if CE-LIF could be used to distinguish multiple target genes, 488-DDR2 and Bodipy-28S rRNA riboprobes (200 ng each) were prepared and simultaneously hybridized to 10 μg of total RNA isolated from rat heart. Representative electropherograms are shown in Figure 6. Given the separation in emission wavelengths between the Alexa488 and Bodipy fluorphores (520 nm and 625 nm), no bleed through fluorescence was anticipated and electropherograms collected on unhybridized probe in both fluorescence channels demonstrated this was the case (data not shown). The DDR2 mRNA has been detected as single or multiple transcripts ranging in size from 4.5 kb to 9.5kb in length depending upon the tissue source of the RNA [11, 12]. A single DDR2 transcript which migrated at 39.5 minutes was detected. This is in agreement with literature reports for only one transcript of DDR2 being present in the heart [12]. Concentration of an RNA can be determined directly using the following equation, [mRNA] = [probe](Ahybrid/(Ahybrid + Aprobe) [6], where Ahybrid and Aprobe are the area under the curve for the target RNA-probe hybrid and the free, unhybridized probe respectively and [probe] and [mRNA] are the concentration of probe used in the experiment and the calculated concentration of mRNA. Analysis using this equation revealed that the DDR2 mRNA was present at a concentration of 0.26 ± 0.01 ng/μl. In addition, given the size of the riboprobe used in these experiments (492 bases), the DDR2 mRNA would essentially co-migrate with the 28S RNA (~4.7 kb RNA plus 155 base probe) as shown in Figure 6. This result demonstrates not only the ability to quantitate multiple RNA species simultaneously but also to resolve multiple species with similar sizes.
Figure 6.
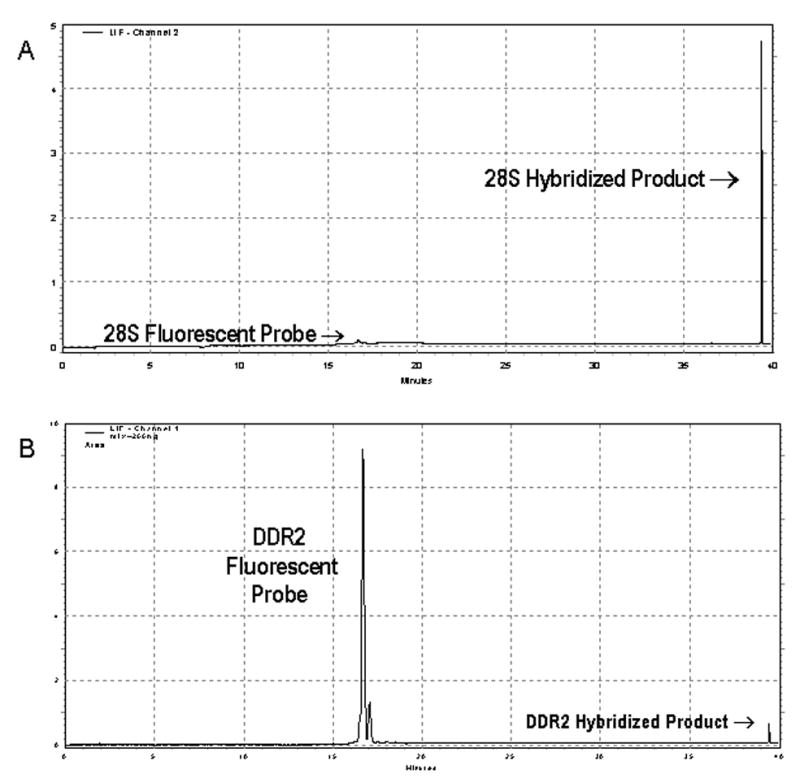
Simultaneous Multiple Gene Expression Analysis using CE-LIF. Representative electropherograms are shown for a single sample hybridized simultaneously with (A) Bodipy-28S probe using a 635 nm laser and (B) 488-DDR2 probe excited with at 488 nm laser. Note the significant difference in the target-probe hybrid peaks for the 28S and DDR2 probes showing that the mRNA for DDR2 is expressed at a much lower level compared with 28S RNA in a sample in which the same amount of both probes is used. The large free DDR2 probe peak indicates that this hybridization reaction was conducted at saturating levels of DDR2 probe.
DISCUSSION
By combining solution hybridization with the rapid analysis of capillary electrophoresis and the sensitivity of fluorescence detection, we have developed a method which combines the best of current RNA analysis protocols. Using fluorescently tagged riboprobes instead of DNA probes takes advantage of the increased stability of an RNA-RNA hybrid compared to an RNA-DNA hybrid [9,10] and since the fluorescent tag is incorporated during the transcription reaction, multiple fluorophores can be incorporated into a single probe allowing greater sensitivity in detection. In addition the use of longer riboprobes, compared to short, end-labeled oligonucleotides, provides for increases both in sensitivity as noted above as well as increased target specificity. Regarding time commitment, compared to Northern blotting and RPAs which require 3–5 days to complete an experiment, hybridization and analysis can be done in 24 hours using our method. The protocol described herein used standard solution hybridization conditions, but the use of rapid hybridization solutions could further reduce the total experimental time to just under 2 hours. The most significant point regarding this method is that similar to another recently described application of CE-LIF [6], it does not require the use of a standard curve or internal standard by which gene expression must be normalized. We have provided two examples of how the direct determination of an RNA species may be made either through the use of a binding curve to determine the concentration of an RNA species or using the fluorescence from both the free probe and bound target to calculate RNA concentration. The use of capillary electrophoresis to directly quantitate gene expression will extend our understanding of how gene expression is regulated and provide significantly more rapid screens for RNA levels.
To validate that CE-LIF would provide an accurate measure of RNA level, we chose to initially examine the expression of 28S ribosomal RNA. 28S is the most abundant RNA present in a cell, representing approximately 55% of the total RNA pool. Based on this, in a 5 μg sample of total RNA there would be 2.75 μg of 28S rRNA which equals 67 ng of probe target sequence contained within the 28S rRNA. Using a fluorescently tagged 28S rRNA riboprobe, the amount of probe required to saturate binding to 28S rRNA within 5 μg of total RNA as determined by CE-LIF was 66 ng, equaling 2.5 μg of 28S rRNA in these samples. This number is in good agreement with the known amount of 28S rRNA present. The use of smaller quantities of RNA will require riboprobes with increased specific activity and therefore higher sensitivity to detect low abundance RNAs. By incorporating fluorescently tagged nucleotides directly into the riboprobe during the synthesis reaction rather than the addition of a single fluorphore at the end of an oligonucleotide, probes containing multiple fluorophores with high specific activity are produced making our method is ideally suited for examining low abundance RNA species. To test this, the expression of DDR2, a gene whose expression level has not been reported, was examined. Hybridization of the 488-DDR2 riboprobe to 10 μg of total RNA and subsequent area under the curve analysis revealed that the concentration of DDR2 in total RNA isolated from cardiac tissue was 0.26 ± 0.01 ng/μl. This report is the first direct, quantitative measure of DDR2 expression in cardiac tissue and demonstrates that CE-LIF can be used to quantify the expression of low abundance mRNAs.
Several studies have also used CE-LIF to analyze RT-PCR products of individual genes [3–5] or to qualitatively detect multiple PCR products [13, 14]. The method described herein is the first report of direct analysis of mRNA or rRNA in which not only the quantity of RNA species can be detected but also the size of the RNA. Our method combines the best features of both RNase protection assays, the use of solution hybridization which will tolerate some target degradation, and Northern blotting, previously the only method which could provide information about RNA size. In addition, because mRNA species can be separated by size it will also be possible using a single probe to determine if an mRNA is present as multiple sized transcripts within a given cell/tissue. A recent application of CE-LIF to mRNA analysis examined the level of green fluorescent protein mRNA over-expressed in E. Coli [6] and demonstrated that a linear response is obtained using a similar approach to the one presented here. While this study also reported direct quantitation of a specific mRNA species, the use of single-stranded DNA binding protein to bind excess DNA probe and separate it from DNA-mRNA hybrids in an open tubular capillary provides no information regarding the size of the mRNA target.
The potential for using CE-LIF for the direct detection of gene expression extends beyond the basic science applications into the clinical setting enabling disease detection and diagnosis on a rapid and quantitative scale. A number of studies have described the use of RT-PCR for the detection of bacteria and other infections agents [15], although purely at a qualitative level. Using fluorescent probes specific for bacterial or viral RNAs could dramatically decrease the time between sample collection and determining both the amount and identity of pathogen present. Given the development of relatively inexpensive, commercial microfluidics platforms currently used exclusively for assessment of total RNA integrity, the adaptation of our methodology for use on those systems would further reduce both the analysis time and the amount of RNA necessary for gene expression analysis.
Acknowledgments
The authors would like to thank Dr. Jeffrey Patton for many helpful scientific discussions and critical reading of this manuscript. This work was supported by NIH grants HL73937 and P20-RR16434.
Footnotes
Abbreviations used: CE, capillary electrophoresis; LIF, Laser-induce-fluorescence; RPA, RNase protection assay; DDR2, discoidin domain receptor-2; EtOH, ethanol, NH4OAC, ammonium acetate; PIPES, piperazine-1,4-bis(2-ethanesulfonic acid); HPMC, hydroxypropylmethylcellulose.
References
- 1.Reue K. mRNA quantitation techniques: considerations for experimental design and application. J Nutr. 1998;128:2038–2044. doi: 10.1093/jn/128.11.2038. [DOI] [PubMed] [Google Scholar]
- 2.Kolesar JM, Allen PG, Doran CM. Direct quantification of HIV-1 RNA by capillary electrophoresis with laser-induced fluorescence. J Chromatogr B. 1997;697:189–194. doi: 10.1016/s0378-4347(97)00334-4. [DOI] [PubMed] [Google Scholar]
- 3.Richards MP, Ashwell CM, McMurtry JP. Analysis of leptin gene expression in chickens using reverse transcription polymerase chain reaction and capillary electrophoresis with laser-induced fluorescence detection. J Chromatogr A. 1999;853:321–335. doi: 10.1016/s0021-9673(99)00576-2. [DOI] [PubMed] [Google Scholar]
- 4.van Eekelen JAM, Shammas FV, Wee L, Heikkila R, Osland A. Quantitative analysis of Cytokeratin 20 gene expression using RT-PCR and capillary electrophoresis with fluorescent DNA detection. Clin Biochem. 2000;33:457–464. doi: 10.1016/s0009-9120(00)00155-7. [DOI] [PubMed] [Google Scholar]
- 5.Fasco MJ, Treanor CP, Spivack S, Figge HL, Kaminsky LS. Beckman Application Information. Nucleic Acids. 1994;A1788A:1–5. [Google Scholar]
- 6.Al-Mahrouki AA, Krylov SN. Calibration-free quantitative analysis of mRNA. Anal Chem. 2005;77:8072–8030. doi: 10.1021/ac051471c. [DOI] [PubMed] [Google Scholar]
- 7.Han F, Lillard SJ. In situ sampling adn separation of RNA from individual mammalian cells. Anal Chem. 2000;72:4073–4079. doi: 10.1021/ac000428g. [DOI] [PubMed] [Google Scholar]
- 8.Han F, Lillard SJ. Monitoring differential synthesis of RNA in individual cells by capillary electrophoresis. Anal Biochem. 2002;302:136–143. doi: 10.1006/abio.2001.5519. [DOI] [PubMed] [Google Scholar]
- 9.Bodkin DK, Knudson DL. Assessment of sequence relatedness of double-stranded RNA genes by RNA-RNA blot hybridization. J Virol Methods. 1985;10:45–52. doi: 10.1016/0166-0934(85)90087-4. [DOI] [PubMed] [Google Scholar]
- 10.Casey J, Davidson N. Rates of formation and thermal stabilities of RNA:DNA and DNA:DNA duplexes at high concentrations of formamide. Nucl Acids Res. 1977;4:1539–1552. doi: 10.1093/nar/4.5.1539. [DOI] [PMC free article] [PubMed] [Google Scholar]
- 11.Lai C, Lemke G. Structure and expression of the Tyro 10 receptor tyrosine kinase. Oncogene. 1994;9:877–883. [PubMed] [Google Scholar]
- 12.Ferri N, Carragher NO, Raines EW. Role of Discoidin Domain Receptors 1 and 2 in human smooth muscle cell-mediated collagen remodeling. Am J Pathol. 2004;164:1575–1585. doi: 10.1016/S0002-9440(10)63716-9. [DOI] [PMC free article] [PubMed] [Google Scholar]
- 13.Odin E, Wettergren Y, Larsson L, Larson PA, Gustavsson B. Rapid method for relative gene expression determination in human tissues using automated capillary gel electrophoresis and multicolor detection. J Chromatogr B. 1999;734:47–53. doi: 10.1016/s0378-4347(99)00333-3. [DOI] [PubMed] [Google Scholar]
- 14.Zabzdyr JL, Lillard SJ. A qualitative look at multiplex gene expression of single cells using capillary electrophoresis. Electrophoresis. 2005;26:137–145. doi: 10.1002/elps.200406126. [DOI] [PubMed] [Google Scholar]
- 15.Espy MJ, Uhl JR, Sloan LM, Buckwalter SP, Jones MF, Vetter EA, Yao JD, Wengenack NL, Rosenblatt JE, Cockerill FR, Smith TF. Real-time PCR in clinical microbiology: applications for routine laboratory testing. Clin Microbiol Rev. 2006;19:165–256. doi: 10.1128/CMR.19.1.165-256.2006. [DOI] [PMC free article] [PubMed] [Google Scholar]