

Abstract
Approaches were examined for reducing acoustic noise levels heard by subjects during functional magnetic resonance imaging (fMRI), a technique for localizing brain activation in humans. Specifically, it was examined whether a device for isolating the head and ear canal from sound (a “helmet”) could add to the isolation provided by conventional hearing protection devices (i.e., earmuffs and earplugs). Both subjective attenuation (the difference in hearing threshold with versus without isolation devices in place) and objective attenuation (difference in ear-canal sound pressure) were measured. In the frequency range of the most intense fMRI noise (1–1.4 kHz), a helmet, earmuffs, and earplugs used together attenuated perceived sound by 55–63 dB, whereas the attenuation provided by the conventional devices alone was substantially less: 30–37 dB for earmuffs, 25–28 dB for earplugs, and 39–41 dB for earmuffs and earplugs used together. The data enabled the clarification of the relative importance of ear canal, head, and body conduction routes to the cochlea under different conditions: At low frequencies (≤500 Hz), the ear canal was the dominant route of sound conduction to the cochlea for all of the device combinations considered. At higher frequencies (>500 Hz), the ear canal was the dominant route when either earmuffs or earplugs were worn. However, the dominant route of sound conduction was through the head when both earmuffs and earplugs were worn, through both ear canal and body when a helmet and earmuffs were worn, and through the body when a helmet, earmuffs, and earplugs were worn. It is estimated that a helmet, earmuffs, and earplugs together will reduce the most intense fMRI noise levels experienced by a subject to 60–65 dB SPL. Even greater reductions in noise should be achievable by isolating the body from the surrounding noise field.
I. INTRODUCTION
Functional magnetic resonance imaging (fMRI) is widely used to map the activity patterns of the human brain during sensory stimulation or the performance of a cognitive task. However, the high-level sound, or “acoustic noise,” produced by the imaging equipment can be problematic for some fMRI investigations, particularly those focused on the central auditory system. Typically, subjects wear standard hearing protection devices during fMRI (i.e., earmuffs or earplugs; Savoy et al., 1999), but this is not sufficient for achieving the quiet conditions more typical of physiological and psychophysical studies of hearing. The noise can be loud enough to mask the perception of sound stimuli (Shah et al., 1999; Eden et al., 1999), even when earmuffs and earplugs are worn. In addition, the noise itself can evoke brain activity, which can then obscure the activity produced by the intended stimuli (Bandettini et al., 1998; Ulmer et al., 1998; Talavage et al., 1999; Edmister et al., 1999). fMRI paradigms that modify the timing of image acquisitions can be used to reduce the influence of the noise on brain activation (e.g., Edmister et al., 1999; Hall et al., 1999), but these modified paradigms compromise the temporal resolution or data-taking efficiency of the fMRI technique (see Melcher et al., 1999, for a discussion).
Acoustic noise in the imaging environment can arise from several sources. The most intense noise is from the imager gradient coils that produce spatially and temporally varying magnetic fields used in acquiring an image (e.g., Cohen, 1998). This “gradient noise” occurs synchronously with each image acquisition and has the same predominant frequency as the current driving the gradient coils (e.g., Hurwitz et al., 1989; Schmitt et al., 1998; Ravicz et al., 2000). We found that peak gradient-noise levels during fMRI reached 123 dB re 20 μPa in a 1.5-Tesla (T) imager and 138 dB in a 3-T imager; the gradient-noise spectra (calculated over a 10-ms window coinciding with the highest- amplitude noise) showed a prominent maximum at 1 kHz for the 1.5-T imager (115 dB SPL) and at 1.4 kHz for the 3-T imager (131 dB SPL—Ravicz et al., 2000). 1 (Figure 4 contains examples of noise waveforms.) Other sources of noise include (a) a pump for liquid helium used to cool the imager's static magnet, and (b) the air-handling system in the imager room. Pump and air-handling noise levels at our installation were 71 dB(A)(80 dB SPL unweighted) with spectral peaks at 125, 240, and 490 Hz (Ravicz et al., 2000). Other authors have reported similar gradient and background noise levels for comparable imagers (e.g., Prieto et al., 1998).
FIG. 4.
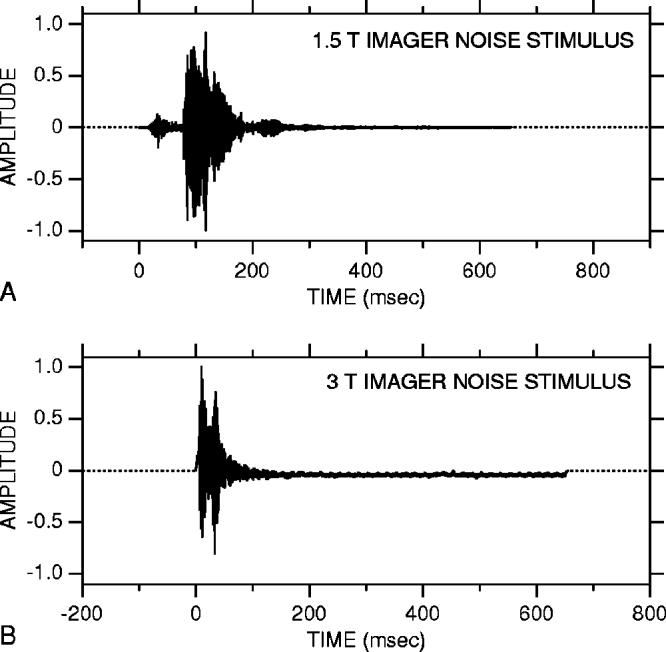
Imager noise stimuli. In each panel, the waveform from 0 to 650 ms is imager noise recorded in 1.5-T (A) and 3-T imagers (B); the remainder is zero padding (dotted line) for a 1-s presentation period. The high-intensity portions of the noise waveforms [e.g., 80–150 ms in (A), 5–40 ms in (B)] are due to gradient coil activity. The waveforms have been normalized to their respective peaks.
Earmuffs and earplugs cannot reduce fMRI acoustic noise to subaudible levels because there is a fundamental limit to their effectiveness. The limit arises because there are multiple routes by which sound is conducted to a subject's cochlea (e.g., von Gierke, 1956). These multiple routes are shown schematically in Fig. 1. Earmuffs and earplugs reduce conduction along the ear canal; however, sound impinging on a subject can still be conducted through the subject's head and body to the cochlea (von Gierke, 1956; Zwislocki, 1957; Berger, 1983). 2 This sound can be conducted (a) directly to the cochlea; (b) to the middle ear and then to the cochlea; or (c) through the walls of the ear canal and along the ear canal to the middle ear and cochlea (Khanna et al., 1976). When no hearing protection devices are worn, sound at the external ear conducted along the ear canal dominates the perceived sound. However, when earmuffs and earplugs are used together to reduce conduction along the ear canal, conduction through the subject's head and body can become significant (Zwislocki, 1957; Berger, 1983), and protecting the ears further will not reduce the level of perceived sound. Shielding the head and body as well as the ears should, however, produce reductions (von Gierke, 1956).
FIG. 1.
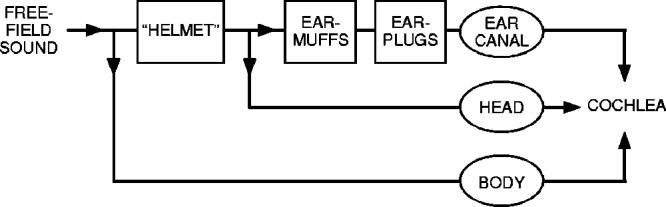
Block diagram of sound conduction from the free field to the cochlea. Sound is conducted along three routes, labeled with ovals: along the ear canal, through the head, and through the body. As indicated, earmuffs and earplugs reduce sound conduction along the ear-canal route. A helmet enclosing the head is expected to reduce conduction along both the head and ear-canal routes.
The sound attenuation provided by earmuffs and earplugs has been reported in several previous studies (Berger, 1983; Berger and Kerivan, 1983; Berger et al., 1998; Casali et al., 1995), but the efficacy of devices for shielding the head or body remains largely unexamined. In subjects wearing earmuffs and earplugs, Nixon and von Gierke (1959) found that cotton applied over the head (but not the earmuffs) could attenuate the perceived level of free-field sound (confirming that the attenuation provided by earmuffs and earplugs was indeed limited by conduction through the head). However, they did not examine the degree of isolation that might be achieved by shielding the ear as well as the head, nor did they attempt to test a shielding device for use in practice.
The objective of the present study was to build on the experiments of Nixon and von Gierke by testing a device for isolating both the ear canal and the head from sound (Fig. 1). Because our particular interest was to reduce the imaging noise perceived by subjects during fMRI, we designed a head-shielding device (a “helmet”) that could eventually be used during imaging experiments. We investigated the attenuation provided by (a) a helmet used with earmuffs, and (b) a helmet used with earmuffs and earplugs together. We measured both (1) subjective attenuation, the attenuation of perceived sound (an indicator of the attenuation of sound reaching the cochlea), and (2) objective attenuation, the attenuation of sound pressure in the ear canal. To determine whether or not the helmet could provide substantial additional attenuation beyond that provided by earmuffs and earplugs, it was necessary to assess the attenuation provided by earmuffs and earplugs under the same experimental conditions (even though the attenuation of earmuffs and earplugs has been examined previously, e.g., Berger et al., 1998).
The data gathered in these investigations provided an opportunity to clarify the relative importance of the various sound conduction routes to the cochlea, particularly at high frequencies where fMRI noise levels are highest. While it is known that ear canal, head, and body conduction can all contribute to perceived sound, the relative importance of these routes at a quantitative level remains largely unresolved. From an fMRI standpoint, we were interested in understanding the conduction routes because this information can be used to design further noise reduction strategies.
II. METHODS
A. Subjects
Subjects were adult volunteers (eight men, two women) with no auditory complaints or known hearing loss. Measurements were generally made in one ear; in three subjects, measurements were made in both ears. Experiments were conducted in accordance with a protocol approved by the Human Studies Committee of the Massachusetts Eye and Ear Infirmary, and informed consent was obtained from all subjects.
B. Devices tested
We tested several devices for isolating a subject's ears and head from sound: earplugs, earmuffs, and helmets.
The earplugs and earmuffs tested were commercial models commonly used for hearing protection. Earplugs were chosen from among five models of compressible foam earplugs of different sizes and Noise Reduction Ratings (NRRs; EPA,1979): E·A·R E·Z·Fit (NRR=28 dB), Howard Leight Max-Lite (NRR=33 dB), Howard Leight Laser-Lite (NRR=32 dB), Lab Safety Supply Sound Defense (NRR=29 dB), Moldex Spark Plug (NRR=31 dB). Earplug model and size were chosen by the investigators and subject for a snug yet comfortable fit in the ear canal. Preliminary tests indicated that other types of earplugs, such as PVC, molded rubber/plastic, clay, or cotton/fiberglass, were almost always less comfortable and often less effective for subjects. Earmuffs were Howard Leight QM-26 dielectric muffs (NRR=25 dB), nonmetallic, and therefore MRI compatible, which included a hard thermoplastic shell and PVC-covered foam cushions.
Two helmets for reducing sound transmission to a subject's head were tested. The first helmet was large enough to fit loosely over the head of a subject wearing earmuffs (Fig. 2). This free-standing helmet consisted of a sheet of foam– barrier–foam composite (Netwell FBF-1), comprising a layer of 1/4-in. acoustic foam, a heavy barrier layer of 1/8-in.-thick vinyl (1 lb/in.2), and a layer of 1-in. acoustic foam. The composite was rolled into a cylinder (1-in. foam layer inside) and sealed top and bottom with a circular piece of the same composite. The bottom of the helmet was removable and was slit to allow installation around a subject's neck. Any gaps between the subject's neck and the helmet were filled by a laboratory towel. There was no contact between the helmet and earmuffs and no contact between the helmet and the subject except at the neck and shoulders. A second, larger helmet (which fit over and was supported by a mockup of an imager head coil) was constructed from a barrier–foam composite without the 1-in. foam layer (E·A·R E-0-10-25). The composite was oriented so the 1/4-in. foam layer was between the barrier layer and the mock head coil. This second helmet was also sealed at the top and bottom as described above for the first helmet. Ventilation air for the subject (8–9 l/min.) was provided through a long (∼8m) tube running from a bottle of medical-grade compressed air through the wall of the helmet near the subject's neck to the space under the helmet and exhausted through the towel.
FIG. 2.

Realistic view of a subject wearing the first helmet and earmuffs. The helmet is shown cut away to illustrate how it fit loosely over the head of a subject wearing earmuffs; in actuality, it enclosed the subject's entire head.
The materials used for the helmets were chosen for (1) a high attenuation rating [STC=27–34 (Sound Transmission Class, e.g., Warnock and Quirt, 1998)]; (2) a barrier layer that is among the heaviest available in standard products; and (3) a foam decoupling layer. (The foam layer of the second helmet isolated the barrier layer from the mock head coil.) Although we did not explicitly try different materials, we do not expect that other, similar commercially available materials will provide significantly more attenuation unless their STC is higher. Because the helmets were constructed of composites with similar attenuation ratings,3 we expected that the two helmets would provide similar attenuations. In fact, they did, so we do not distinguish between the two helmets in the results.
C. Measurement techniques
The effect of each isolation device or combination of devices (earmuffs, earplugs, helmet) was assessed two ways. “Subjective” attenuation was computed from differences in behavioral threshold to various sound stimuli [Sound Field Real Ear At Threshold (REAT)]. “Objective” attenuation was computed from measurements of sound pressure magnitude in a subject's ear canal [Insertion Loss by Microphone In Real Ear (MIRE)—Berger, 1986b]. In each case, measurements made with the subject wearing one or more isolation devices were compared with measurements with no devices worn (see Fig. 3). Subjective attenuations were computed from measurements of behavioral threshold (in dB) as
| (1a) |
Similarly, objective attenuations were computed from measurements of ear-canal sound pressure PEC (normalized by stimulus level. as
| (1b) |
FIG. 3.
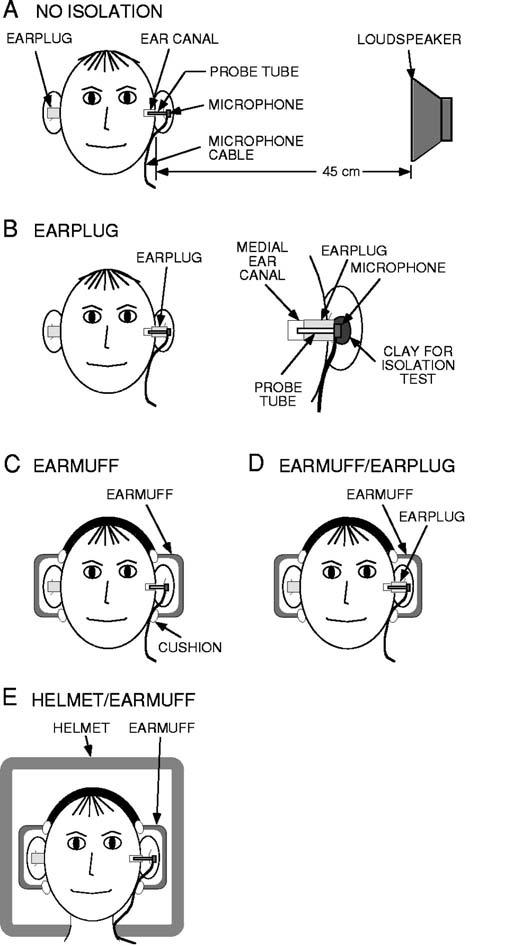
Diagram of techniques used to measure sound pressure in the ear canal and behavioral thresholds. Measurements were made with no isolation (A) and with different combinations of test devices: earplugs (B, left panel), earmuffs (C), earmuffs and earplugs together (D), a helmet and earmuffs together (E), and a helmet with earmuffs and earplugs together (not shown). Details of the attachment between the earplug, microphone, and probe tube are shown in (B), right panel; also shown is the position of the clay used to test whether the microphone was acoustically isolated from the sound field outside the ear.
Measurements were performed with a subject seated in a soundproofed, acoustically deadened chamber at the Eaton-Peabody Laboratory in Boston, MA. Background noise levels were 0 dB SPL or less above 200 Hz (Vér et al., 1975). Sound stimuli were played over a wide-range loudspeaker (Radio Shack #40-1354) located approximately 45 cm from a subject's ear (usually the left) at an azimuth of 90° from the midline and 0° elevation [Fig. 3(A)].4 A foam earplug was inserted by the experimenter into the ear canal opposite the loudspeaker (to approximately the depth of a “standard insertion,” Berger, 1983, 1986b), where it remained throughout the experiment.5
Sound pressure PEC was measured in the ear canal closest to the loudspeaker. A short, thin, stiff plastic probe tube (∼22 mm length, 1.14-mm inner diameter, 1.57-mm outer diameter) was attached to a hearing aid microphone (Knowles EK-3027) with cyanoacrylic cement. The microphone was inserted into the subject's concha so the probe tube extended approximately 15 mm into the ear canal. The microphone was taped to the tragus to hold it in place. Care was taken not to obstruct the entrance to the ear canal and to keep the tip of the probe tube away from the ear-canal wall. For configurations that included an earplug as a test device [Figs. 3(B) and (D)], the probe tube was threaded through a hole in the earplug made with a hypodermic needle such that only the microphone remained outside the earplug [Fig. 3(B), right panel].6 The earplug was inserted by the experimenter into the ear canal. A standard insertion was always attempted; however, because the probe tube, microphone, and microphone cable increased the difficulty of inserting the earplug, a lesser insertion was realized in some cases (i.e., a “partial insertion,” Berger, 1983, 1986b).7 After PEC was measured with the test earplug in place, the earplug was removed from the ear, and the microphone and probe tube were extracted intact from the earplug and reinserted in the ear canal at approximately the same location. To be sure that the characteristics of the microphone and probe tube were unaffected by these procedures, we checked that the calibration of the microphone with its probe tube was the same at the beginning and the end of each experiment. For the calibration, the microphone with probe tube was sealed to the end of a custom-made acoustic source and the microphone output was measured in response to a broadband chirp stimulus (see Sec. D).
For configurations that included earmuffs as a test device [Figs. 3(C), (D), and (E)], the earmuffs were positioned by the subject to maximize comfort, with assistance by the experimenter, who ensured that there was a seal between earmuff cushion and head. The microphone cable was routed between the earmuff cushion and the subject's head. For Configurations that included a helmet [Figs. 3(E) and (F)], the helmet was positioned by the experimenter. The microphone cable was routed along the subject's neck.
For each combination of devices, PEC was measured first to assess the fit of the noise reduction device (s). The subject's behavioral thresholds were then determined in response to imager noise and tone-burst stimuli (described in Sec. D below). Subjects were provided with a push button that controlled a buzzer in the control area outside the sound- proofed room and were instructed to keep the button pressed as long as they heard one stimulus presentation per second. Stimuli were initially presented at approximately 20 dB SL. Stimulus level was then reduced in 3-dB steps at approximately 3-s intervals as long as the button was pressed. Once the subject released the button, stimulus level was increased in 3-dB steps until the subject again responded. Three response/no-response cycles were usually sufficient to establish a reliable threshold. Typically, the first sound pressure and threshold measurements in each session were made with multiple noise reduction devices in place [e.g., Fig. 3(E)]; devices were then removed progressively until the last measurement was made with no device in place.
D. Stimuli
For ear-canal sound-pressure measurements, broadband chirps (12 Hz–14 kHz) were played over the loudspeaker at 80–95 dB SPL (as measured in the subject's ear canal) for approximately 90 s. For behavioral threshold measurements, we chose test stimuli based directly on fMRI acoustic noise.8 Two types of stimuli were used: (1) 650-ms segments of previously digitized 1.5- and 3-T imager noise (including gradient noise—Fig. 4), and (2) tone bursts (50-ms duration) at 1 and 1.4 kHz (the predominant frequencies of the gradient noise in the 1.5-T imager and the 3-T imager, respectively), 2 and 2.8 kHz (second harmonics, also prominent in the noise spectra), and 500 Hz (a prominent lower-frequency peak in the noise spectra). Each imager noise segment corresponded to a single image acquisition (Ravicz et al., 2000). All stimuli had 5-ms rise–fall times and were presented at a rate of 1/s.
E. Some potential sources of measurement error
One potential source of error in earplug objective attenuation measurements is sound conducted directly to the microphone through the microphone case rather than the probe tube. During measurements of ear-canal pressure with an earplug in place, the microphone [outside the ear—Fig. 3(B)] is in a more intense sound field than the tip of the probe tube in the ear canal medial to the earplug. If sound conducted through the microphone case to the microphone were comparable to or greater than ear-canal sound pressure, earplug attenuations would be artifactually low. While measuring ear-canal pressure with an earplug in place, we encased the microphone in a heavy clay [Fig. 3(B), right panel], thereby isolating it from the sound field outside the ear. Adding the clay produced no difference in the microphone output. This indicates that sound conduction through the microphone case to the microphone did not contaminate our measurements of earplug attenuation.
We considered whether physiological noise in the ear canal might result in errors in our subjective attenuation measurements. This consideration was prompted by reports that masking of auditory stimuli by higher levels of physiological noise in the occluded versus unoccluded ear canal9 could cause overestimations of the attenuation of earmuffs and earplugs (Berger and Kerivan, 1983). The amount of overestimation was shown by Berger and Kerivan to be insignificant for measurements of earplug and earmuff attenuation at 500 Hz and above. Since the frequency range of our subjective attenuation measurements was ≥500 Hz, we assume that any such overestimations did not cause significant errors in our measurements.
A second potential source of error in the subjective attenuation measurements arises because different routes of sound conduction are important with different configurations of isolation devices. For no devices [Fig. 3(A)], behavioral thresholds presumably are indicative of sound reaching one cochlea (on the side closest to the loudspeaker). However, for device configurations where head and/or body conduction contributes significantly to the perceived sound (see Secs. III C, D, E), behavioral thresholds could reflect sound reaching both cochleae rather than only one. The implication is that behavioral thresholds with certain devices may be artificially low (because threshold reflects sound reaching both cochleae instead of only one), in which case subjective attenuation would be artifactually low [see Eq. (1a)]. We estimated that the threshold might differ by as much as 3 dB depending on whether sound was detected with one or both cochleae (based on the difference between minimum audible pressure and minimum audible field; Moore, 1997). Therefore, it is possible that subjective attenuations may have been underestimated by as much as 3 dB in circumstances where head and/or body conduction was important (see also Berger and Kerivan, 1983). We took this into consideration in deducing the dominant routes of sound conduction for different device configurations (Sec. III) as follows: In our deductions (which are based on comparisons of objective and subjective attenuations and comparisons of subjective attenuations for different device configurations) we consider only differences in excess of 3 dB.
III. RESULTS
A. Overview
Objective and subjective attenuations were measured for the four configurations of isolation devices shown in Figs. 3(B)-(E) and for a fifth combination comprising earmuffs, earplugs, and a helmet. The subjective attenuations for each of the device combinations are listed in Table I. Both objective and subjective attenuations are shown in Figs. 5-8. The helmet/earmuff combination provided higher objective and subjective attenuations than the earmuff/earplug combination. The helmet/earmuff/earplug combination provided the highest objective and subjective attenuations of all configurations tested.
TABLE I.
Summary of subjective attenuation measurements in this study and previous reports using similar earmuffs and earplugs. Attenuations are specified in dB (mean±1 standard deviation). Attenuations for this study are based on data in N ears; the datum for each ear is the average of 1–3 measurements. The previous studies of earmuff attenuation used Bilson UF-1 earmuffs,a presented mean results for several types of earmuffs,b or did not specify the type used.c The previous studies of earplug attenuation used E.A.R® Classic® foam earplugsa or did not specify the type used.c
| Subjective attenuation of various sound stimuli (dB) |
||||||||
|---|---|---|---|---|---|---|---|---|
| Stimuli | ||||||||
| Imager noise | Tone bursts | |||||||
| Isolation device This study |
Number of ears N |
1.5-T (1 kHz) |
3.0-T (1.4 kHz) |
500 Hz | 1 kHz | 1.4 kHz | 2 kHz | 2.8 kHz |
| Earmuffs | 5 | 30±6.0 | 37±3.9 | … | 32±6.9 | 37±4.7 | 34±7.9 | 35±3.8 |
| Earplugs | 3 | 26±6.1 | 25±0.8 | … | 28±4.2 | 27±6.8 | 35±2.4 | 41±1.0 |
| Earmuff/earplug combination | 8 | 41±68 | 39±4.0 | 41±8.6 | 41±6.5 | 39±6.5 | 47±7.1 | 48±5.8 |
| Helmet/earmuff combination | 3 | 47±2.7 | 52±1.7 | … | 50±0 | 58±6.9 | 56±10.4 | 64±6.4 |
| Helmet/earmuff/earplug combination | 5 | 57±9.7 | 63±9.9 | 58±5.5 | 55±7.3 | 63±9.7 | 66±5.8 | 82±2.1 |
| Stimuli: 1/3-octave bandwidth noise bursts except as noted | ||||||||
| Other studies | 125 Hz | 250 Hz | 500 Hz | 1 kHz | 1.4 kHz | 2 kHz | 3.15 kHz | |
| Earmuffs, “Subject fit”a | 7.4±3.6 | 14.0±3.4 | 20.7±3.3 | 29.2±3.8 | … | 31.7±4.2 | … | |
| Earmuffs, mean of several studiesa | 9±3.6 | 12±4.0 | 19±4.7 | 27±4.9 | … | 28±5.2 | … | |
| Earmuffsb Stimuli: pure tones | 13±4.5 | 19±5.5 | 26±5.5 | 34±7.0 | … | 32±6.5 | 33±8.0 | |
| Earplugs, “Subject fit”a | 21.4±7.8 | 22.0±7.8 | 24.2±7.8 | 25.2±6.9 | … | 31.0±4.7 | … | |
| Earplugs, mean of several studiesa | 17±9.0 | 17±8.7 | 20±9.2 | 22±8.5 | … | 29±8.3 | … | |
| Earmuff/earplug combinationc | 37.5±4.6 | 41.8±5.1 | 51.3±6.7 | 47.8±4.2 | … | 37.3±3.5 | 46.8±4.5 | |
Compiled by Berger et al., 1998.
Berger, 1983, for “small-volume” earmuffs and earplugs inserted to “standard depth” (50%–60% of earplug in ear canal).
FIG. 5.
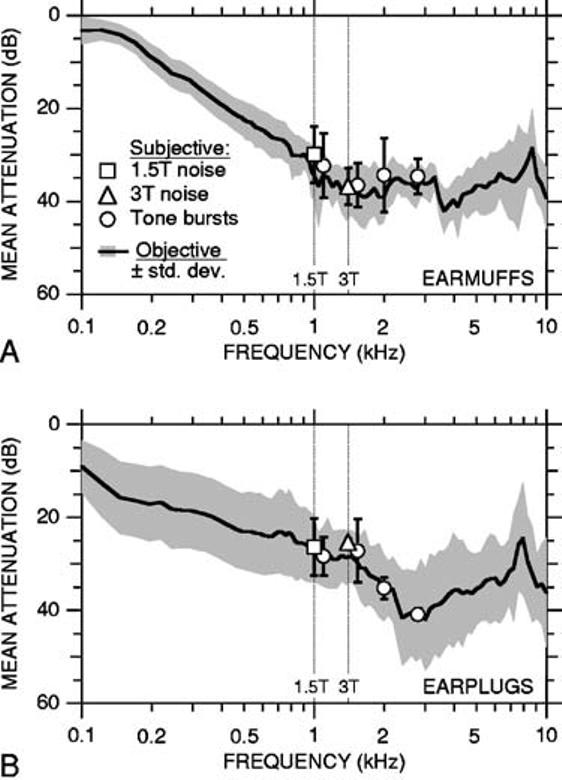
Attenuation of earmuffs (A) and earplugs (B). In both panels, the solid curve is the mean objective attenuation for nine ears (in seven subjects—earmuffs; six subjects—earplugs); shading indicates ±1 standard deviation (s.d.). Symbols indicate mean subjective attenuations in five subjects (earmuffs) or three subjects (earplugs); error bars indicate ±1 s.d. Subjective attenuations for tone bursts, 1.5-T imager noise, and 3-T imager noise are indicated by circles, squares, and triangles, respectively. For earplugs, ±1 s.d. was less than the dimensions of the symbols indicating the mean subjective attenuations for 3-T imager noise and 2.8-kHz tone bursts. Subjective attenuations for imager noise are plotted at the predominant gradient noise frequencies indicated by vertical dotted lines (1.5 T: 1 kHz; 3 T: 1.4 kHz). Subjective attenuations for tone bursts at 1 and 1.4 kHz have been offset horizontally to the right for clarity.
FIG. 8.
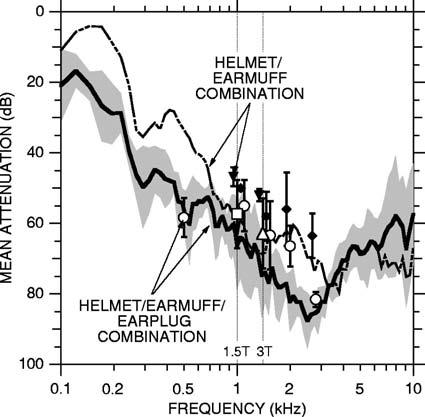
Mean objective and subjective attenuations for the helmet/earmuff/earplug combination ±1 s.d. (objective: solid curve and shading, five ears in five subjects; subjective: symbols and error bars, five subjects). Key to symbols and vertical lines as in Fig. 5. Mean attenuations for the helmet/earmuff combination from Fig. 7(A) are shown for comparison [objective: dashed curve; subjective: solid inverted triangles (gradient noise) and solid diamonds (tone bursts)]. Solid symbols are offset slightly to the left for clarity.
B. Earmuffs or earplugs
1. Objective and subjective attenuations
Attenuations for earmuffs [Fig. 3(C)] are shown in Fig. 5(A). The mean objective attenuation for earmuffs10 [solid line in Fig. 5(A)] increased with increasing frequency up to approximately 1 kHz. (Note that increasing attenuation is plotted downward.) Above 1 kHz, objective attenuation ranged from 29–41 dB. The lesser attenuation at low compared to high frequencies is characteristic of passive attenuation devices (e.g., Nixon, 1979; Berger, 1983). Mean subjective attenuations for tone-burst stimuli [1, 1.4, 2, 2.8 kHz; circles in Fig. 5(A); see Table I. were between 32 and 37 dB and were 1–5 dB lower than objective attenuations at corresponding frequencies,11 but these differences were not statistically significant (p>0.2 for all four frequencies, Student's unpaired t test; Press et al., 1988). The subjective attenuation for 1.5-T imager noise [30 dB; square in Fig. 5(A)] did not differ significantly from the subjective attenuation for tone bursts at the predominant frequency of the 1.5-T gradient noise (1 kHz; p>0.6). Similarly, the subjective attenuation for 3-T imager noise [37 dB; triangle in Fig. 5(A)] did not differ significantly from the subjective attenuation for tone bursts at the predominant frequency of the 3-T gradient noise (1)4 kHz; p>0.9). All of the results indicate that earmuffs provide approximately 35 dB of attenuation in the frequency range of imager gradient noise (1–1.4 kHz).
Attenuations for earplugs [Fig. 3(B)] are shown in Fig. 5(B). Data from all of the earplug types tested (of different sizes and NRRs) have been combined. Mean objective attenuation [solid line in Fig. 5(B)] generally increased with increasing frequency up to approximately 3 kHz where it reached a maximum of 41 dB. At still higher frequencies, objective attenuation decreased slightly as frequency increased. Mean subjective attenuations for tone bursts at 1, 1.4, 2, and 2.8 kHz (27–41 dB; see Table I. did not differ significantly from objective attenuations at corresponding frequencies (1–3-dB difference; p>0.7 for all four frequencies). Subjective attenuations for imager noise (26 and 25 dB for 1.5- and 3-T noise, respectively. did not differ significantly from those for tone bursts at the predominant frequencies of the gradient noise (p>0.6). In the frequency range of the gradient noise, all of the results indicate that earplugs provide approximately 27 dB of attenuation.
2. Comparison with previous studies
Our measurements of earmuff and earplug attenuations are in general agreement with previous reports (Casali et al., 1995; Royster et al., 1996; Berger, 1983; Berger and Kerivan, 1983; Berger et al., 1996, 1998). 12 Our objective attenuations for earplugs are within the range of Berger and Kerivan's (1983) “partial insertion” earplug data over the frequency range that the two sets of measurements have in common (125 Hz–2 kHz). Our objective attenuations for earmuffs are also within the range of previously reported values (125 Hz–3.15 kHz), with some exceptions. They are less than attenuations reported by Casali et al. (1995) in Bilsom earmuffs below 500 Hz and less than attenuations reported by Berger and Kerivan (1983) in David Clark 19A earmuffs below 1 kHz. A possible reason for these discrepancies is that the earmuffs used by Casali et al. and Berger and Kerivan may have had a larger volume than ours—large-volume earmuffs have been shown to provide greater attenuation at low frequencies than small-volume earmuffs (Berger, 1983). Our subjective attenuations for earmuffs and earplugs are in close agreement with previous reports (Table I).
3. Dominant conduction route
The fact that our objective and subjective attenuations do not differ significantly for either earmuffs or earplugs indicates that sound in the ear canal fully accounts for the sound perceived by subjects wearing either earmuffs or earplugs. Therefore, conduction through the head and body to the cochlea is not important with these devices: for earmuffs or earplugs, the dominant sound conduction route is along the ear canal.
C. Earmuffs and earplugs in combination
1. Objective and subjective attenuations
The attenuation provided by earmuffs and earplugs used together [Fig. 3(D)] is shown in Fig. 6(A). Objective attenuation for this “earmuff/earplug combination” generally increased with increasing frequency up to approximately 65 dB at 3–4 kHz and then decreased. Subjective attenuations for tone bursts (0.5, 1, 1.4, 2, and 2.8 kHz—see Table I) were between 39 and 48 dB. At 1.4, 2, and 2.8 kHz, subjective attenuations were significantly less than objective attenuations (by 7–15 dB; p<0.02). Subjective attenuations for 1.5- and 3-T imager noise (41 and 39 dB) did not differ significantly from the subjective attenuations for 1- and 1.4- kHz tone bursts, respectively (p>0.9). The subjective attenuation for 3-T imager noise was significantly less than the objective attenuation at 1.4 kHz (p<0.004). Thus, subjective attenuations for frequencies ≥1.4 kHz were less than the objective attenuations at corresponding frequencies.
FIG. 6.
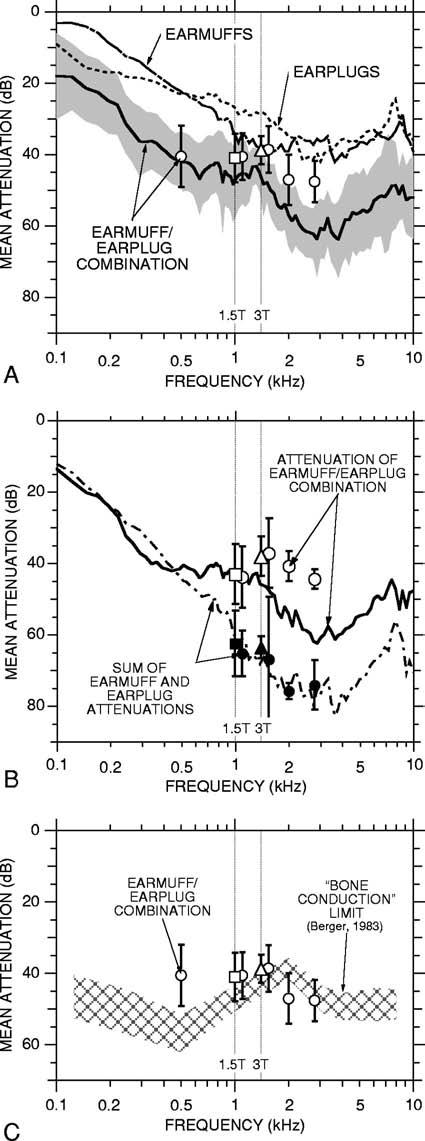
(A) Objective and subjective attenuations for the earmuff/earplug combination. The solid curve is the mean objective attenuation for 12 ears (in nine subjects; shading indicates ±1 s.d.); symbols are mean subjective attenuations in eight subjects (error bars indicate ±1 s.d.). Key to symbols and vertical lines as in Fig. 5. Also shown are mean objective attenuations for earmuffs and earplugs from Fig. 5 (thin dot-dashed and dotted curves, respectively). (B) Sum of mean earmuff and earplug attenuations (dot-dashed curve and filled symbols) and attenuation for the earmuff/earplug combination (solid curve and open symbols). The results shown in this panel are based only on the ears in which measurements were made in all three of the following conditions: earmuffs alone, earplugs alone, and the earmuff/earplug combination (objective: eight ears in six subjects; subjective: three subjects). (C) Subjective attenuations for the earmuff/earplug combination (symbols) compared to the mean “bone conduction limit” ±1 s.d. measured by Berger (1983) in subjects wearing special highly attenuating earmuffs and deeply inserted earplugs (hatched area).
2. Comparison of earmuff/earplug combination with earmuffs or earplugs alone
The attenuations provided by the earmuff/earplug combination can be compared to the attenuations for earmuffs or earplugs alone using Fig. 6(A) and Table I. Objective attenuations for the earmuff/earplug combination exceeded the attenuation provided by either device alone at all frequencies (p<0.007), except that the attenuation of the earmuff/earplug combination was not significantly greater than that for earplugs alone near 125 Hz (p>0.1). Subjective attenuations for the earmuff/earplug combination significantly exceeded the subjective attenuations for earmuffs or earplugs alone in most cases (by 9–15 dB; p,0.05). The exceptions are the 3-T imager noise and 1.4-kHz tone bursts, for which there was no significant difference in attenuation between the earmuff/earplug combination and earmuffs alone (p>0.3), and 2.8-kHz tone bursts, for which the difference in attenuation between the earmuff/earplug combination and earplugs alone was not significant (p>0.1).
3. Dominant conduction routes
a. Comparison of objective and subjective attenuations
As a first step toward identifying the dominant routes of sound conduction to the cochlea in subjects wearing both earmuffs and earplugs, we compared objective and subjective attenuations in Fig. 6(A). The reasoning that motivated this comparison was as follows: If the ear canal were the dominant sound conduction route, all the sound reaching the cochlea would pass through the earmuff and then the earplug, and objective attenuations would equal subjective attenuations. Thus, a difference between objective and subjective attenuations would indicate that a significant amount of sound reaching the cochlea bypassed the ear canal, i.e., was conducted through the head and body to the middle or inner ear (the “ossicular” or “middle ear” and “inner ear” components described in Khanna et al., 1976). At 500 Hz, the difference between the mean subjective and objective attenuations was insignificant (1 dB), suggesting that the ear canal was the dominant conduction route at 500 Hz. At 1 kHz, subjective and objective attenuations differed to a greater degree (by 6 dB), but not significantly (p>0.1). At 1.4 kHz and above, subjective attenuations were 7–15 dB less than objective attenuations, and the differences were significant (p<0.02). The discrepancy between objective and subjective attenuations indicates that a significant portion of the sound reaching the cochlea at and above 1.4 kHz bypassed the ear canal, i.e., was conducted through the head and/or body to the middle ear and cochlea.13
b. Comparison of earmuff/earplug attenuation to summed earmuff and earplug attenuations
To further examine the routes of sound conduction for the earmuff/earplug combination, we (a) calculated what the attenuations for the earmuff/earplug combination would be if the ear canal were the only important sound conduction route, and (b) compared the calculations with our measurements of attenuation for the earmuff/earplug combination. If the ear canal were the only important route, all of the sound reaching the ear canal and cochlea would pass through the earmuff and then the earplug (Fig. 1). In this case, the attenuation for the earmuff/earplug combination would be the sum (in dB) of the individual earmuff and earplug attenuations, assuming that there is no interaction between earmuff and earplug.14 Therefore, as a test of whether the ear canal was the dominant route, we added the attenuations for earmuffs and earplugs alone and compared the result with the measured attenuation for the earmuff/earplug combination. The idea was that any significant discrepancies would indicate sound conduction via routes other than the ear canal route.
The summed earmuff and earplug objective attenuations are shown in Fig. 6(B) along with the objective attenuation measured for the earmuff/earplug combination. The attenuation for the earmuff/earplug combination (solid line) does not differ significantly from the sum of the earmuff and earplug objective attenuations (dashed line) below 500 Hz (p>0.4). This result supports the view that most low-frequency sound reaches the cochlea along the ear canal route, not through the head or body.15 In contrast, at high frequencies (>500 Hz), the measured attenuation for the earmuff/earplug combination was significantly less than the sum of the objective attenuations for earmuffs and earplugs (p<0.003). The difference was greatest (20 dB) near 1.4 kHz. An interpretation of this disparity at high frequencies is that sound was conducted through the head and/or body to the ear canal medial to the earplug [Khanna et al.'s (1976) “external ear component”] when the earmuff/earplug combination was worn.
Summed earmuff and earplug subjective attenuations are also shown in Fig. 6(B) along with subjective attenuations measured for the earmuff/earplug combination. The subjective attenuations for the earmuff/earplug combination (open symbols) were significantly less than the sum of the subjective attenuations for earmuffs and earplugs alone (filled symbols), by 20–35 dB for 1-, 1.4-, 2-, and 2.8-kHz tone bursts and imager noise (p<0.03 for all stimuli except 1.5-T imager noise and 1.4-kHz tone bursts—p<0.06). Thus, at high frequencies (>500 Hz), both subjective and objective attenuations for the earmuff/earplug combination were less than the summed earmuff and earplug attenuations. These comparisons support the view that, at high frequencies (>500 Hz), sound conducted to the cochlea via the head and/or body limits the attenuation of earmuffs and earplugs when both are worn.
c. Comparison with Berger's “bone conduction limit.”
The importance of head and body conduction for the earmuff/earplug combination at high frequencies but not at low is further supported by a comparison of earmuff/earplug attenuations and Berger's (1983) “bone conduction limit.”16 Berger (1983) estimated his bone conduction limit by measuring subjective attenuations in subjects wearing deeply inserted earplugs and large lead earmuffs that presumably blocked sound conduction along the ear canal so that any perceived sound was conducted through the head and body (see also Zwislocki, 1957; Nixon and von Gierke, 1959).17 Hence, the bone conduction limit is an upper bound on the noise reduction possible using hearing protection that treats only sound conduction along the ear canal (Berger, 1983, 1986a). At 500 Hz, subjective attenuation for the earmuff/earplug combination was below Berger's bone conduction limit [Fig. 6(C)], which further supports the idea that the ear canal was the dominant conduction route to the cochlea at 500 Hz. At 1 kHz and above, subjective attenuations were similar to Berger's bone conduction limit [Fig. 6(C)] which further supports the conclusion that head and/or body conduction are important at high frequencies (>500 Hz) when both earmuffs and earplugs are worn.
d. Summary
Our data are consistent with the view that, at low frequencies (≤500 Hz), the ear canal is the dominant sound conduction route to the cochlea when the earmuff/earplug combination is worn. Comparisons between objective and subjective attenuations and between individual and combined attenuations indicate that, at higher frequencies, sound conduction through the head and/or body contributes significantly to the sound perceived by subjects wearing the earmuff/earplug combination. Above 500 Hz, the sound is conducted through the head and/or body to the ear canal; at 1.4 kHz and above, sound is also conducted to the middle ear and cochlea.
D. Helmet and earmuffs in combination
1. Objective and subjective attenuations
To investigate whether reducing sound conduction through the head would lead to further attenuation with earmuffs beyond that possible with earplugs, we measured the attenuation provided by a “helmet” worn over earmuffs [Fig. 3(E)]. The mean objective attenuation for the “helmet/earmuff combination” [solid line in Fig. 7(A)] generally increased with increasing frequency up to approximately 1 kHz. Above 1 kHz, objective attenuations ranged from approximately 60–80 dB. Mean subjective attenuations for tone-burst stimuli [1, 1.4, 2, 2.8 kHz, circles in Fig. 7(A)] and imager noise (square and triangle) ranged from 47–64 dB. Subjective attenuations for 1.4-, 2-, and 2.8-kHz tone bursts were not significantly different from objective attenuations at corresponding frequencies, but subjective attenuations for all other stimuli were significantly less than objective attenuations at corresponding frequencies (by 11–16 dB; p<0.02). Our subjective attenuation data indicate that the helmet/earmuff combination reduced perceived sound by 47–58 dB in the frequency range of the imager noise (1–1.4 kHz)—see Table I.
FIG. 7.
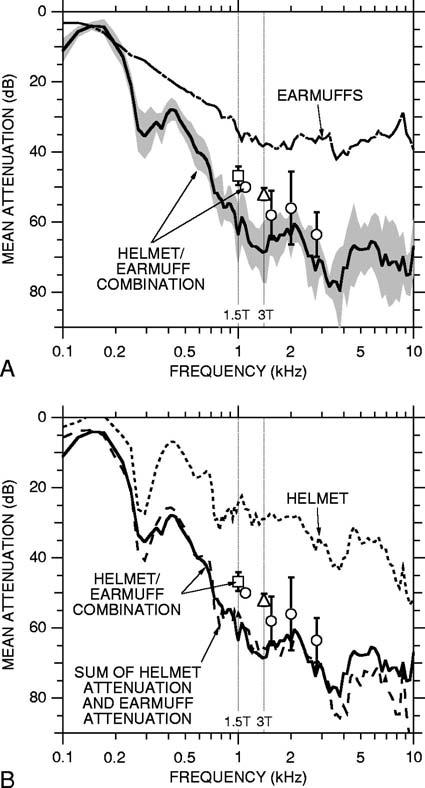
(A) Mean objective and subjective attenuations for the helmet/earmuff combination ±1 s.d. (objective: solid curve and shading, six ears in six subjects; subjective: symbols and error bars, three subjects). Key to symbols and vertical lines as in Fig. 5. Also shown is the mean objective attenuation for earmuffs from Fig. 5(A) (dot-dashed curve). (B) Mean objective and subjective attenuations for the helmet/earmuff combination [solid curve and symbols from (A)], sum of mean earmuff and helmet objective attenuations (dashed curve), and mean objective attenuation for the helmet alone (dotted curve; six ears in six subjects).
2. Comparison of helmets/earmuff combination with earmuffs alone and with the earmuff/earplug combination
The helmet/earmuff combination provided more attenuation than earmuffs alone in most instances. For example, the mean objective attenuation for the helmet/earmuff combination was significantly greater than that for earmuffs at 250 Hz and above [p<0.002; Fig. 7(A)]. The mean subjective attenuations for the helmet/earmuff combination exceeded those for earmuffs alone by 15–29 dB (p<0.005; see Table I).
The helmet/earmuff combination also provided more attenuation at high frequencies than the earmuff/earplug combination. Mean objective attenuation was significantly greater for the helmet/earmuff combination at 1 kHz and above (p<0.03), except near 2 kHz (p>0.1). For 3-T imager noise and 1-, 1.4-, and 2.8-kHz tone bursts, mean subjective attenuations were significantly greater for the helmet/earmuff combination (9–19 dB) as compared to the earmuff/earplug combination (p<0.04; see Table I).
3. Reduction in sound conduction through the head and ear canal at high frequencies (>500 Hz)
Three lines of evidence indicate that the helmet/earmuff combination reduced sound conduction through the head as well as through the ear canal. First, the helmet/earmuff combination provided more subjective attenuation than the earmuff/earplug combination for 1-, 1.4-, and 2.8-kHz tone bursts and for 3-T imager noise. This is relevant because the attenuation provided by the earmuff/earplug combination at high frequencies (>500 Hz) was limited by conduction through the head and/or body, so the greater attenuation provided by the helmet/earmuff combination could be achieved only by a reduction in conduction through the head (since the helmet did not enclose the body). Second, subjective attenuations for the helmet/earmuff combination exceeded the estimated upper limit for ear canal attenuation [i.e., exceeded Berger's “bone conduction limit” in Fig. 6(C)] for most of the test stimuli (3-T imager noise and 1.4-, 2-, and 2.8-kHz tone bursts). This indicates that the helmet reduced sound transmission along an additional route, i.e., through the head. Third, the objective attenuation for the helmet/earmuff combination was approximately equal to the sum of the individual objective attenuations of the helmet and earmuffs [Fig. 7(B)], which indicates that little or no sound reached the ear canal by passing through the body, head, and ear canal walls.18 In short, the helmet proved effective in its intended function, reducing sound conduction through the head as well as the ear canal.
4. Dominant conduction routes
Our deductions concerning the dominant routes of sound conduction for the helmet/earmuff combination are as follows. Our reasoning is based on our previous conclusion that, when earmuffs alone are worn, sound is conducted to the cochlea primarily along the ear canal rather than through the head or body. Placing the helmet over earmuffs presumably reduced the sound reaching the ear canal and head to the same degree and therefore did not alter the relative importance of the ear canal versus head conduction routes. This implies that sound conducted through the head contributed negligibly to the perceived sound when the helmet/earmuff combination was worn. Instead, the perceived sound was presumably dominated by sound conducted through the ear canal, body, or both.
The relative importance of ear canal vs body conduction at high frequencies (>500 Hz) can be deduced by considering the relationship between objective and subjective attenuations if only the ear-canal route were important and comparing this hypothetical situation with our data. If only ear-canal conduction were important, sound pressure in the ear canal would fully account for the sound perceived by a subject wearing the helmet/earmuff combination, so subjective and objective attenuations would be the same. Alternatively, if body conduction were important as well, objective and subjective attenuations would not necessarily be equal because subjects could hear sound conducted to the cochlea that bypassed the ear canal. Hence, any significant discrepancy between measured objective and subjective attenuations would imply that conduction through the body was important (see Sec. III C 3). In fact, subjective and objective attenuations for the helmet/earmuff combination did differ significantly for 1-kHz tone bursts and 1.5- and 3-T imager noise, by 11–16 dB. Thus, conduction through the body apparently contributed to the sound heard when the helmet/earmuff combination was worn, at least at some frequencies. The fact that adding earplugs to the helmet/earmuff combination tended to increase subjective attenuations (see Sec. III E 2) supports the idea that conduction along the ear canal also contributed to the perceived sound when the helmet and earmuffs were worn. In short, we conclude that, for the helmet/earmuff combination, the dominant routes of sound conduction to the cochlea at high frequencies (>500 Hz) are through the ear canal and body.
In contrast to the situation at high frequencies, our data suggest that the ear canal is the dominant sound conduction route at low frequencies when the helmet/earmuff combination is worn. The reasoning follows from the earlier conclusion that the attenuation for the earmuff/earplug combination at low frequencies (≤500 Hz) was not limited by conduction through the head and body, i.e., conduction was mainly along the ear canal (Sec. III C 3). This conclusion, coupled with the fact that the objective attenuation for the helmet/earmuff combination was less than that for the earmuff/earplug combination at most low frequencies [compare solid lines in Figs. 6(A) and 7(A)], suggests that the ear canal was also the dominant conduction route for low-frequency sound when the helmet/earmuff combination was worn. Thus, when the helmet/earmuff combination is worn, further low-frequency attenuation should be possible by reducing conduction along the ear canal.
E. Helmet, earmuffs, and earplugs in combination
1. Objective and subjective attenuations
The attenuation provided by a helmet, earmuffs, and earplugs used together is shown in Fig. 8. Objective attenuation increased with increasing frequency to a maximum of 87 dB near 2.5 kHz and then decreased with increasing frequency. Subjective attenuations for tone bursts at 0.5, 1, 1.4, and 2.8 kHz did not differ significantly from objective attenuations at corresponding frequencies (p>0.1 for all frequencies)—see Table I. However, the subjective attenuation for tone bursts at 2 kHz was significantly less (p<0.008). Subjective attenuations for 1.5- and 3-T imager noise (57 and 63 dB) did not differ significantly from the attenuations for tone bursts at 1 and 1.4 kHz (55 and 63 dB), respectively (p>0.1). All of our subjective attenuation data indicate that the helmet/earmuff/earplug combination reduces the perceived sound by approximately 60 dB in the frequency range of the imager noise (1–1.4 kHz).
2. Comparison of helmet/earmuff/earplug combination with helmet/earmuff and earmuff/earplug combinations
The attenuations provided by the helmet/earmuff/earplug combination and the helmet/earmuff combination can be compared using Fig. 8. For frequencies below 500 Hz and near 2–3 kHz, objective attenuations for the helmet/earmuff/earplug combination were significantly higher than those for the helmet/earmuff combination (p<0.008); near 1 and 1.4 kHz and above 3 kHz there was no significant difference (p>0.5). The mean subjective attenuations for the helmet/earmuff/earplug combination (open symbols in Fig. 8) were systematically higher than those for the helmet/earmuff combination (filled symbols), although the difference in attenuation was significant only for 1.5-T imager noise (p<0.05; Fig. 8, Table I; note that no subjective data were taken at 500 Hz for the helmet/earmuff combination). Overall, the addition of earplugs to the helmet/earmuff combination tended to increase attenuation at most frequencies.
The subjective attenuations provided by the helmet/earmuff/earplug and earmuff/earplug combinations can be compared using Table I. For every stimulus, attenuations were substantially greater (5–18 dB) for the helmet/earmuff/earplug combination. This result allows a refinement of the earlier conclusion that the head and/or body conduction routes are important at high frequencies when the earmuff/earplug combination is worn (Sec. III C 3). The substantial increase in subjective attenuation that is produced by adding a helmet to the earmuff/earplug combination indicates that it is specifically head conduction that dominates at high frequencies when earmuffs and earplugs are worn together.
3. Dominant conduction routes
Our deductions concerning sound conduction routes at high frequencies (>500 Hz) for the helmet/earmuff/earplug combination begin with a previous conclusion: For the helmet/earmuff combination, the dominant routes of sound conduction at high frequencies were through the ear canal and body. When earplugs were added to the helmet/earmuff combination (yielding the helmet/earmuff/earplug combination), sound conduction through the ear canal was presumably reduced substantially, by an amount equal to the objective attenuation of earplugs [23–41 dB for frequencies >500 Hz; Fig. 5(B)] making conduction through the ear canal negligible compared to conduction through the body. Thus, the dominant route by which high-frequency sound was conducted to the cochlea for the helmet/earmuff/earplug combination was probably through the body.
Two results provide information about the dominant routes of sound conduction at low frequencies (≤ 500 Hz) for the helmet/earmuff/earplug combination: (1) At 500 Hz, the subjective attenuation for the helmet/earmuff/earplug combination was approximately equal to the objective attenuation (Fig. 8), indicating that sound primarily reached the cochlea via the ear canal. (2) Adding earplugs to the helmet/earmuff combination increased objective attenuation significantly at low frequencies (Fig. 8). In fact, the increase was approximately equal to the attenuation measured for earplugs alone [Fig. 5(B)]. This additivity suggests that (a) most low-frequency sound was conducted along the ear canal, and (b) conduction to the ear canal through the head or body was not important at low frequencies when the helmet/earmuff/earplug combination was worn.
IV. DISCUSSION
Our experiments demonstrated that a helmet shielding the head can provide substantial additional attenuation beyond that provided by conventional devices for isolating individuals from sound, namely earmuffs and earplugs. In the course of these demonstrations, we systematically determined both objective (ear canal) and subjective attenuations for various combinations of isolating devices. These data enabled deductions concerning the relative importance of three different sound conduction routes to the cochlea: along the ear canal, through the head, and through the body.
A. Relative importance of sound conduction routes
1. High frequencies
Our measurements were focused on high frequencies (>500 Hz), where fMRI noise levels are highest. At high frequencies, routes other than the ear canal were clearly important for several device configurations: the earmuff/earplug combination, the helmet/earmuff combination, and the helmet/earmuff/earplug combination.
The relative importance of the various conduction routes can be estimated quantitatively by combining our attenuation data with the model in Fig. 1. Estimates of sound conduction for the frequency range of the predominant gradient noise (1–1.4 kHz) are given in Fig. 9. For each combination of isolation devices, and for no isolation, estimates of sound conduction for the ear canal, head, and body routes are given in dB relative to conduction through the ear canal when no isolation devices are worn.
FIG. 9.
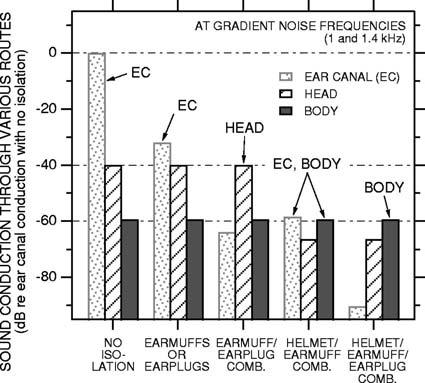
Estimates of sound conduction to the cochlea through the ear canal, head, and body at frequencies of imager gradient noise, for five conditions: no isolation devices, earmuffs or earplugs, the earmuff/earplug combination, the helmet/earmuff combination, and the helmet/earmuff/earplug combination. Contribution from each route to the perceived sound is indicated in dB relative to conduction along the ear canal with no isolation. Labels above bars indicate the dominant route(s) of sound conduction for each condition (EC: ear canal).
The estimates of ear canal, head, and body conduction in Fig. 9 were made as follows. When no isolation devices are worn, the ear canal is the dominant route of sound conduction to the cochlea, and the level of ear-canal conduction is set to 0 dB, the maximum (Fig. 9, far left). When there are various combinations of earmuffs, earplugs, or helmet (Fig. 9, four right-most columns), ear-canal conduction is reduced from maximum by the total attenuation along the ear-canal route. For earmuffs or earplugs, this is just the earmuff or earplug attenuation in the frequency range of the predominant gradient noise (the estimates in Fig. 9 are based on an average of the attenuations at 1 and 1.4 kHz). When there are multiple devices, we assumed that the total ear-canal attenuation was the sum of objective attenuations (in dB) provided by each individual device since sound passes through the various devices serially on its way to and along the ear canal (Fig. 1; e.g., for the helmet/earmuff/earplug combination, ear-canal attenuation was calculated as the sum of the individual helmet, earmuff, and earplug objective attenuations).19
The level of sound conducted through the head was estimated from our subjective attenuation data for the earmuff/earplug combination. For this device configuration, we concluded that sound conduction along the ear canal was reduced to the point that conduction through the head dominated the perceived sound (Secs. III C 3 and III E 2). Therefore, in Fig. 9 the head contribution for this configuration is below the ear-canal contribution with no isolation (0 dB) by an amount equal to the earmuff/earplug subjective attenuation (approximately 40 dB). For the purposes of this figure, we assume that the amount of sound conducted through the head (relative to maximum) is the same for no isolation as for the earmuff/earplug combination.20 For the device configurations that included the helmet, head conduction in Fig. 9 was reduced by an amount equal to the objective attenuation of the helmet (based on the assumption that the helmet reduced conduction to the head and ear canal by the same amount).
The level of sound conduction through the body when there is no isolation was estimated from our subjective attenuation data for the helmet/earmuff/earplug combination. For this device configuration, we concluded that sound conduction along the ear canal and through the head was reduced to the point where conduction through the body dominated the perceived sound. Therefore, in Fig. 9 the body contribution is below maximum by an amount equal to the helmet/earmuff/earplug attenuation (approximately 60 dB). Presumably, none of the devices we studied affected the body route to the cochlea, so the amount of sound conducted through the body (relative to maximum) is the same for all of the situations in Fig. 9.
The relative importance of ear canal, head, and body conduction to the cochlea for various device configurations can be seen from Fig. 9. When there is no isolation (Fig. 9, far left), the ear canal is by far the dominant route of sound conduction. Even when conduction along the ear canal is reduced by earmuffs or earplugs (Fig. 9, second from left), the ear canal remains the dominant route. However, when earmuffs and earplugs are used together, conduction along the ear canal is reduced to the point that head conduction is most important (Fig. 9, middle). For the helmet/earmuff combination, the helmet reduced conduction through the head as well as along the ear canal; consequently, the head route is less important than the ear canal and body routes, and the ear canal and body routes are comparable in importance (Fig. 9, second from right). When earplugs are added to the helmet/earmuff combination, ear-canal conduction is reduced, and the dominant route of conduction is through the body.
2. Low frequencies
Our attenuation data at low frequencies (≤ 500 Hz) are consistent with the idea that the ear canal was the dominant conduction route for every device configuration considered. However, it is likely that other routes would have become important if we had attempted to explore the limits of attenuation achievable at low frequencies. For instance, the lowfrequency attenuations we measured for the earmuff/earplug combination are less than the maximum achievable because we used earplug insertion depths typical of everyday use, rather than the maximum insertion depth possible. Berger (1983) has shown that conduction through routes other than the ear canal can be significant at low frequencies as well when earmuffs are used with deeply inserted earplugs. In these circumstances, the helmet should still provide additional low-frequency attenuation.
B. Sound conduction to the cochlea under imaging conditions
The conditions under which our measurements were made differ from those in an imager, which raises the possibility that the relative importance of the ear canal, head, and body routes might be different during imaging. For our measurements, the subject was seated in a chair, their head was unsupported, and sound was delivered from a point source some distance away. In the imager, the subject's position and the acoustic environment are different: (1) the subject typically lies supine on a patient table with their head in a head coil. The subject's head rests on the head coil, and there may be cushioning material packed between the head and the head coil to prevent the head from moving. Additionally, the subject may hold a bite bar, which is rigidly attached to the head coil, in his/her mouth to keep the head still. (2) Gradient noise comes from gradient coils surrounding the subject rather than from a point source. (3) The patient table may vibrate in response to gradient coil or coolant pump activity. Consequently, unlike the experimental conditions of the present study, vibrations may be transmitted to the subject's head through the head coil or bite bar or to the head or body through the patient table. Hence, the importance of the head and body conduction routes relative to the ear canal could be higher in the imager than in the experimental setup in the soundproof room.
C. Achieving further noise reduction
1. Gradient noise
As we have seen, at the predominant frequencies of imager gradient noise, sound conduction through the head limits the effectiveness of devices that treat only the ear canal (e.g., earmuffs, earplugs, “noise-canceling” headsets—see the next section), and sound conduction through the body limits the effectiveness of the helmet (which treats only the head and ear canal). Thus, reductions at gradient noise frequencies beyond those demonstrated here will require reducing noise reaching the subject's body as well as the head and ear canal.
One way to achieve further noise reduction would be to enclose the entire subject in sound-attenuating material—a logical extension of the helmet. The idea is that the subject would lie in a sound-attenuating enclosure during imaging. The enclosure would contain integral ventilation, monitoring, and communication equipment. In fact, using the enclosure might be more expedient for imaging purposes than fitting a subject with a helmet. If the enclosure were doublewalled, the attenuation provided might be increased further by drawing a vacuum between the inner and outer walls and isolating the inner wall mechanically from the outer wall, perhaps with active vibration isolation mounts. The attenuation provided by such an enclosure used with earmuffs and earplugs would presumably be greater than that provided by the helmet/earmuff/earplug combination because the enclosure, unlike the helmet, would reduce transmission to the body as well as the head.
An alternative to the enclosure just described is to modify the imager to reduce noise transmission from the gradient coils to the subject (Ravicz et al., 1999, 2000). The feasibility of this approach was demonstrated in a preliminary experiment which showed that lining the imager patient tube (in which the subject lies) with acoustic barrier–foam composite reduced gradient noise levels in the imager by approximately 12 dB (Ravicz et al., 1999). This represents only a simple imager treatment; further reductions should be possible with additional treatment.
2. Pump and air-handling noise
Even with the helmet/earmuff/earplug combination, the ear canal was probably still the dominant sound conduction route in the frequency range of the pump and air-handling noise (≤ 500 Hz; see Sec. III E 3), so additional reduction in the noise heard at these frequencies should be achievable by further reducing sound conducted along the ear canal. Additional reduction should be achievable by inserting the earplugs more deeply into the ear canal than they were in this study (e.g., Berger, 1983). A second approach for achieving further reductions is active noise reduction (ANR or “active cancellation”), which involves generating an inverted copy of the noise waveform and introducing it at or near the ear to interfere destructively with the noise (e.g., Elliott and Nelson, 1993). ANR can typically provide 10–20 dB of attenuation at low frequencies when applied in a small volume such as that under an earmuff (e.g., Casali and Berger, 1996; McKinley et al., 1996), and ANR systems have been developed for MRI applications (Goldman et al., 1989; Pla et al., 1995; Palmer, 1998). It is unlikely that substantial additional reductions can be achieved through design improvements to earmuffs or earplugs because the technology of these devices is relatively mature. In fact, most commercially available earmuffs and earplugs provide nearly as much attenuation as experimental devices optimized for noise reduction (at the expense of comfort or practicality—Zwislocki, 1957; Berger, 1983). Of course, the enclosure described in the previous section for reducing gradient noise would also presumably reduce pump and air-handling noise.
D. Noise reduction during imaging versus other highnoise situations
Because the imaging environment has different demands of noise reduction than most industrial environments, more noise reduction options are available during fMRI. For most industrial environments, earmuffs or earplugs may be the only acceptable options for noise reduction because: (1) any noise attenuation devices must be comfortable to wear for a work shift; (2) the devices cannot limit the worker's mobility; and (3) noise attenuation must not be so high that a worker's awareness of his/her surroundings and ability to communicate are impaired. In contrast, for fMRI (1) noise attenuation devices need be comfortable only for the duration of the imaging experiment (e.g., 1–3 h); (2) the subject is immobile, so any contraints that mobility places on devices are not applicable; and (3) maintaining the subject's awareness of his/her surroundings is less important (in fact, some subjects may be more comfortable if they are less aware of their surroundings), and communication can be maintained through a headset (e.g., Savoy et al., 1999). Hence, for noise reduction during imaging, the emphasis can be more on maximal noise isolation without the compromises for comfort, mobility, awareness, and communication required in industrial environments. People exposed to high noise levels in other environments in which the constraints listed above do not apply may benefit from the noise reduction techniques discussed in this paper.
E. Predicted imager noise levels experienced by subjects
Our attenuation data can be combined with measurements of fMRI noise levels to estimate the effective noise levels experienced by subjects wearing various combinations of isolation devices. Estimates for a given device combination were obtained by subtracting the measured subjective attenuations to 1.5- and 3-T imager noise for the device combination from gradient noise levels measured in 1.5- and 3-T imagers, respectively. With no isolation, gradient noise levels were 115 dB SPL in the 1.5-T imager and 131 dB SPL in the 3-T imager (Fig. 10; Ravicz et al., 2000).21 With the combination of the helmet, earmuffs, and earplugs, we estimate that the effective gradient noise levels experienced by a subject would be reduced to approximately 58 dB SPL in the 1.5-T imager and 68 dB SPL in the 3-T imager. If, in addition, the imager patient tube is lined with acoustic barrier–foam composite (such as that used for helmet construction; Ravicz et al., 1999), effective gradient noise levels may be reduced further to 46–56 dB SPL for the 1.5- and 3-T imager, respectively.22
FIG. 10.

Effective gradient noise levels experienced by subjects during fMRI in 1.5-T and 3-T imagers (squares and triangles, respectively). The levels shown were measured directly (no isolation) or computed for various devices or combinations of devices (filled symbols). Also shown are estimated noise levels for the helmet/earmuff/earplug combination with the imager patient tube lined with acoustic barrier–foam composite (open symbols).
Two important points are illustrated by Fig. 10: (1) Substantial reductions in the noise levels experienced by subjects can be achieved using a combination of conventional hearing protection devices and other devices (such as the helmet) that isolate subjects from the imager noise. (2) Even if all of the isolation methods described in this paper are used simultaneously, imager noise levels will still be well within the audible range. Achieving quiet experimental conditions during fMRI may require that less noise be produced by the imager.
V. SUMMARY AND CONCLUSIONS
Even when earmuffs and earplugs are used together to reduce acoustic noise levels during fMRI, the levels are high enough to interfere with investigations of the central auditory system.
We determined that further reductions in imager noise can be achieved using a helmet enclosing the head, in addition to earmuffs and earplugs. In the frequency range of the most intense imager noise (i.e., gradient noise), the attenuation provided by earmuffs and earplugs is limited by sound conduction through the head. The helmet can be used to overcome this limit because it shields the head as well as the ear canal from sound.
When a helmet, earmuffs, and earplugs are used together, the remaining gradient noise heard by a subject is conducted mainly through the body. This indicates that the level of noise experienced by a subject could be reduced even further by shielding the entire body from the surrounding noise field.
Using a combination of attenuation techniques, it is possible to bring the conditions during fMRI substantially closer to the quiet conditions more typical of physiological and psychophysical studies of hearing.
ACKNOWLEDGMENTS
The authors wish to extend their sincere thanks to the subjects for the attenuation experiments. We also wish to thank: Dr. Laurie Heller at the Naval Submarine Medical Research Laboratory and Dr. Christopher Halpin of the MEEI Audiology Dept. for helpful discussions on military and government noise exposure standards and hearing protection; Susan E. Voss for technical assistance with earplugs; Elliott H. Berger at E.A.R for helpful comments; John Guinan, Greg Huang, Nelson Kiang, Bill Peake, John Rosowski, and Susan Voss at the Eaton-Peabody Laboratory for comments on earlier versions of the manuscript; Knowles Electronics for supplying microphones; Irina Sigalovsky for creating the illustration in Fig. 2; Barbara E. Norris for help with figures; and the staff of the Eaton-Peabody Laboratory. Supported in part by NIH NIDCD Grant No. P01 DC00119.
Footnotes
Portions of this material were presented at the 1997 American Speech-Language-Hearing Association meeting, Boston, MA, 23 November 1997, the Twentieth and Twenty-first Midwinter Meetings of the Association for Research in Otolaryngology, St. Petersburg Beach, FL, 5 February 1997 and 18 February 1998, and the Fourth International Conference on Functional Mapping of the Human Brain, Montreal, PQ Canada, 11 June 1998.
These were General Electric imagers outfitted for echo-planar imaging by ANMR, Inc.
In this paper we consider sound conduction through the head separately from sound conduction through the rest of the body.
The ratings are similar because both composites used for the helmets contain the same barrier layer (and the barrier layer, rather than foam layer(s), primarily determines attenuation). The heavy vinyl barrier layer in the composites provides an impedance mismatch that reduces sound transmission. The foam layer mechanically decouples the barrier layer from surfaces touching the composite.
We located the sound source at 90° because we had no access to a suitable reverberant room [as specified in ANSI S12.6 (1996)]. The results we obtained for earmuffs and earplugs were similar to those obtained by others in reverberant rooms (e.g., Berger et al., 1998)—see Sec. III. Since our experiments compared noise reduction devices rather than rating the performance of any one device, and since the experimental conditions did not change between measurements with different devices or combinations of devices, our conclusions should be unaffected by the discrepancy between our measurement conditions and those specified in ANSI S12.6.
This experimental configuration was used so that objective and subjective attenuations would reflect sound reaching the same ear [i.e., the subject's left in Fig. 3(A)] for no isolation [Fig. 3(A)], earplugs [Fig. 3(B)], or earmuffs [Fig. 3(C)]. Sound-pressure measurements were always made in the ear canal closest to the loudspeaker. We assumed that behavioral thresholds would be indicative of the levels of sound reaching the cochlea closest to the loudspeaker for the “no isolation,” “earmuff,” and “earplug” configurations because (a) the ear furthest from the loudspeaker was “shadowed” by the head over the frequency range of our threshold measurements (e.g., by 3–6 dB at 500 Hz, 9–12 dB at 2 kHz—Feddersen et al., 1957; Shaw, 1966, 1974); (b) for “no isolation” or “earmuffs,” more sound attenuation material was present on the ear furthest from the loudspeaker, and (c) the ear canal was the dominant sound conduction route to the cochlea (Sec. III A). (See Sec. II E for a discussion of the situation when the ear canal is not the dominant route.)
In all cases, the earplug expanded to form a tight seal between the outer probe tube wall and the earplug.
Though a “deep” earplug insertion (Berger, 1983, 1986b) may have been more appropriate for studies of conduction routes at low frequencies (i.e., ≤ 500 Hz) because more attenuation could be achieved, the differences in attenuation between a partial, standard, and deep insertion were expected to be small in the frequency range of gradient noise (1 kHz and above), especially when used in combination with earmuffs (Berger, 1983).
We chose these stimuli to provide the most direct test of the attenuation of imager noise. They differ from the stimuli specified for use in assessing the attenuation of hearing protection devices (i.e., octave or 1/3 octave band noise; ANSI S12.6—1997). An alternative approach in keeping with standard procedures would have been to (a) measure the attenuation with standard stimuli, and (b) infer the attenuation of imager noise from these measurements and the noise spectrum. The similarity of our earmuff and earplug results to those obtained with standard stimuli suggests that the two methods are equivalent in our case (see Sec. III B).
This masking is one manifestation of the “occlusion effect” described in the audiological literature (e.g., Goldstein and Newman, 1994). The occlusion effect refers to the observation that the sound pressure within the ear canal generated by vibration of the ear canal walls increases when the ear canal is occluded (e.g., Goldstein and Hayes, 1965; Schroeter and Poesselt, 1986). Causes of ear-canal wall vibration include physiological processes (e.g., Berger and Kerivan, 1983) or externally applied sound or vibrations conducted through the head (e.g., Khanna et al., 1976).
The objective attenuation curves throughout this paper have been interpolated above 1 kHz from the linear frequency spacing of the stimulus chirp (12 Hz) to a logarithmic frequency spacing (15 pts./octave).
The objective attenuations used for these comparisons were calculated as follows. First, for each studied ear, the objective attenuation data were interpolated as described in Footnote 10. The attenuation at a given frequency was the geometric mean of three points on the interpolated curve, centered at the frequency of interest. The attenuations calculated in this way for each studied ear were then averaged, yielding a mean and standard deviation of the objective attenuation that was then compared with subjective attenuation.
Note that most of these studies measured subjective attenuation using third-octave-band noise rather than tone bursts as we did. The use of tone pulses (longer in duration and with longer rise/fall times than our tone bursts) rather than noise was shown in one set of studies to overestimate broadband attenuation by 2–4 dB (Waugh, 1974, 1984; Berger, 1986b). However, another study showed that pure tones on average underestimated the attenuation of earmuffs by 2.1 dB at 500 Hz and above (Casali et al., 1995). These over- or underestimations are in almost every case less than the standard deviations in our measurements.
Khanna et al. (1976) reached a similar conclusion in experiments examining conduction through the head to the ear canal, middle ear, and cochlea. They delivered vibratory stimuli to two subjects' foreheads and determined the level and phase of an acoustic stimulus required to cancel the subject's perception of the vibratory stimulus. They concluded that conduction through the head to the middle ear and cochlea became dominant above 3 kHz. In addition, they argued that the frequency range of Carhart's notch (a decrease in clinical bone conduction sensitivity in cases of otosclerotic fixation of the stapes that is most significant between 1 and 2 kHz; e.g., Robinette, 1994) indicates that conduction to the middle ear is negligible above 2 kHz.
Sources of interaction between earmuffs and earplugs that have been proposed are (1) an increase in sound pressure lateral to earplugs due to an increase in the ear canal radiation impedance by earmuffs; (2) an increase in sound pressure medial to earmuffs due to an increase in the ear canal input impedance by earplugs (see Schroeter and Poesselt, 1986); and (3) vibrational coupling through the tissue lining the ear canal (Shaw, 1982). To our knowledge, no definitive evidence exists that there is an interaction between earmuffs and earplugs, and evidence in the present study indicates that any interaction is negligible at 500 Hz and below (see Footnote 15). We anticipate that any interaction at higher frequencies would not be important for the following reasons: (1) The magnitude of the radiation impedance is comparable to the impedance of the volume under earmuffs above about 1 kHz (Schroeter and Poesselt, 1986); (2) the volume occupied by an earplug is only a few percent of the total volume under earmuffs; and (3) as frequency increases, the mass of the tissue lining the ear canal should limit its vibration. (This last point is supported by the fact that the occlusion effect decreases to near zero above about 1.5 kHz.)
The fact that the objective attenuation for the earmuff/earplug combination does not differ significantly from the sum of the earmuff and earplug objective attenuations below 500 Hz also indicates that any interaction between earmuffs and earplugs is negligible in this frequency range.
Note that Berger's “bone conduction limit” applies to sound conducted from air to the head, as opposed to the bone conduction commonly referred to by clinicians, which applies to vibrations coupled to the head mechanically (e.g., Dirks, 1994).
Results similar to Berger's were obtained by Schroeter and Poesselt (1986) in unoccluded ears (“MAFB–MAF”) using large-volume earmuffs in concert with active noise reduction at low frequencies and foam earplugs at high frequencies.
No subjective attenuation data were taken with the helmet alone because the ventilation air produced a masking noise. This noise could not be heard by subjects wearing earmuffs or earplugs, so it was not a problem for measurements of subjective attenuations for the helmet/earmuff or helmet/earmuff/earplug combinations.
Again, we assume that interactions between devices are negligible.
The contribution of sound conduction through the head may be overestimated in the case where no isolation is used, due to the occlusion effect (see Footnote 9), because sound conduction through the head was determined from measurements with the ear canal occluded. For sound conducted from a free field, the magnitude of the occlusion effect (measured behaviorally) is about 5–10 dB at 1–1.25 kHz and negligible at 1.6 kHz and above (though as high as 20–25 dB at low frequencies; “subjective OE,” Schroeter and Poesselt, 1986). The magnitude of the occlusion effect is similar for earmuffs and for earplugs inserted only into the cartilaginous ear canal, as ours were (Berger and Kerivan, 1983; Schroeter and Poesselt, 1986). For simplicity, we have chosen to use the same value of sound conduction through the head for both the open and occluded cases. Because all other configurations shown include earmuffs and/or earplugs, the occlusion effect is taken into account.
The levels given are time-average levels calculated over a 10-ms window that included the peak in the gradient noise. These levels (115 dB for 1.5 T, 131 dB for 3 T) are unweighted and change by less than 1 dB if an A- or C-frequency weighting is applied. (These weightings account for the frequency dependence of human equal-loudness curves, e.g., Earshen, 1986.)
This assumes that the 12-dB reduction in noise achieved by lining the patient tube would add to the attenuation provided by the helmet/earmuff/earplug combination.
References
- ANSI . Methods for measuring the real-ear attenuation of hearing protectors. American National Standards Institute; New York: 1997. ANSI S12.6-1997. [Google Scholar]
- Bandettini PA, Jesmanowicz A, Van Kylen J, Birn RM, Hyde JS. Functional MRI of brain activation induced by scanner acoustic noise. Magn. Reson. Med. 1998;39:410–416. doi: 10.1002/mrm.1910390311. [DOI] [PubMed] [Google Scholar]
- Berger EH. Laboratory attenuation of earmuffs and earplugs both singly and in combination. Am. Ind. Hyg. Assoc. J. 1983;44:321–329. [Google Scholar]
- Berger EH. Hearing protection devices. In: Berger EH, Morrill JC, Ward WD, Royster LH, editors. Noise and Hearing Conservation Manual. American Industrial Hygiene Association; Akron, OH: 1986a. pp. 319–382. [Google Scholar]
- Berger EH. Methods of measuring the attenuation of hearing protection devices. J. Acoust. Soc. Am. 1986b;79:1655–1687. doi: 10.1121/1.393228. [DOI] [PubMed] [Google Scholar]
- Berger EH, Franks JR, Behar A, Casali JG, Dixon-Ernst C, Kieper RW, Merry CJ, Mozo BT, Nixon CW, Ohlin D, Royster JD, Royster LH. Development of a new standard laboratory protocol for estimating the field attenuation of hearing protection devices. III. The validity of using subject-fit data. J. Acoust. Soc. Am. 1998;103:665–672. doi: 10.1121/1.423236. [DOI] [PubMed] [Google Scholar]
- Berger EH, Franks JR, Lindgren F. International Review of Field Studies of Hearing Protector Attenuation. In: Axelsson A, Borchgrevink HM, Hamernik RP, Hellstrom PA, Henderson D, Salvi RJ, editors. Scientific Basis of Noise-Induced Hearing Loss. Thieme; New York: 1996. pp. 361–377. [Google Scholar]
- Berger EH, Kerivan JE. Influence of physiological noise and the occlusion effect on the measurement of real-ear attenuation at threshold. J. Acoust. Soc. Am. 1983;74:81–94. doi: 10.1121/1.389621. [DOI] [PubMed] [Google Scholar]
- Casali JG, Berger EH. Technology advancements in hearing protection circa 1995: Active noise reduction, frequency/amplitude sensitivity, and uniform attenuation. Am. Ind. Hyg. Assoc. J. 1996;57:175–185. doi: 10.1080/15428119691015115. [DOI] [PubMed] [Google Scholar]
- Casali JG, Mauney DW, Burks JA. Physical vs psychophysical measurement of hearing protector attenuation—a.k.a. MIRE vs REAT. Sound Vib. 1995;29(7):20–27. [Google Scholar]
- Cohen M. Theory of echo-planar imaging. In: Schmitt F, Stehling MK, Turner R, editors. Echo-Planar Imaging: Theory, Technique and Application. Springer; Berlin: 1998. pp. 11–30. [Google Scholar]
- Dirks DD. Bone-conduction threshold testing. In: Katz J, editor. Handbook of Clinical Audiology. Williams and Wilkins; Baltimore: 1994. pp. 132–146. [Google Scholar]
- Earshen JJ. Sound measurement: Instrumentation and noise descriptors. In: Berger EH, Ward WD, Morrill JC, Royster LH, editors. Noise and Hearing Conservation Manual. American Industrial Hygiene Association; Akron, OH: 1986. pp. 37–95. [Google Scholar]
- Eden GF, Joseph JE, Brown HE, Brown CP, Zeffiro TA. Utilizing hemodynamic delay and dispersion to detect fMRI signal change without auditory interference: The behavior interleaved gradients technique. Magn. Reson. Med. 1999;41:13–20. doi: 10.1002/(sici)1522-2594(199901)41:1<13::aid-mrm4>3.0.co;2-t. [DOI] [PubMed] [Google Scholar]
- Edmister WB, Talavage TM, Ledden PJ, Weisskoff RM. Improved auditory cortex imaging using clustered volume acquisitions. Hum. Brain Mapping. 1999;7:89–97. doi: 10.1002/(SICI)1097-0193(1999)7:2<89::AID-HBM2>3.0.CO;2-N. [DOI] [PMC free article] [PubMed] [Google Scholar]
- Elliott SJ, Nelson PA. Active noise control. IEEE Signal Process. Mag. 1993;10(4):12–35. [Google Scholar]
- EPA Noise labeling requirements for hearing protectors. Environmental Protection Agency. 1979:56120–56147. Fed. Regist. 44(190): 40CFR Part 21. [Google Scholar]
- Feddersen WE, Sandel TT, Teas DC, Jeffress LA. Localization of high-frequency tones. J. Acoust. Soc. Am. 1957;29:988–991. [Google Scholar]
- Goldman AM, Gossman WE, Friedlander PC. Reduction of sound levels with antinoise in MR imaging. Radiology. 1989;171:549–550. doi: 10.1148/radiology.173.2.2798889. [DOI] [PubMed] [Google Scholar]
- Goldstein DP, Hayes CS. The occlusion effect in bone conduction hearing. J. Speech Hear. Res. 1965;8:137–148. doi: 10.1044/jshr.0802.137. [DOI] [PubMed] [Google Scholar]
- Goldstein BA, Newman CW. Clinical masking: A decision-making process. In: Katz J, editor. Handbook of Clinical Audiology. Williams and Wilkins; Baltimore: 1994. pp. 109–131. [Google Scholar]
- Hall DA, Haggard MP, Akeroyd MA, Palmer AR, Summerfield AQ, Elliott MR, Gurney E, Bowtell RW. Sparse' temporal sampling in auditory fMRI. Hum. Brain Mapping. 1999;7:213–223. doi: 10.1002/(SICI)1097-0193(1999)7:3<213::AID-HBM5>3.0.CO;2-N. [DOI] [PMC free article] [PubMed] [Google Scholar]
- Hurwitz R, Lane SR, Bell RA, Brant-Zawadzki MN. Acoustic analysis of gradient-coil noise in MR imaging. Radiology. 1989;173:545–548. doi: 10.1148/radiology.173.2.2798888. [DOI] [PubMed] [Google Scholar]
- Khanna SM, Tonndorf J, Queller JE. Mechanical parameters of hearing by bone conduction. J. Acoust. Soc. Am. 1976;60:139–154. doi: 10.1121/1.381081. [DOI] [PubMed] [Google Scholar]
- McKinley RL, Steuver JW, Nixon CW. Estimated Reductions in Noise-Induced Hearing Loss by Application of ANR Headsets. In: Axelsson A, Borchgrevink HM, Hamernik RP, Hellstrom PA, Henderson D, Salvi RJ, editors. Scientific Basis of Noise-Induced Hearing Loss. Thieme; New York: 1996. pp. 347–360. [Google Scholar]
- Melcher JR, Talavage TM, Harms MP. Functional MRI of the Auditory System. In: Moonen C, Bandettini P, editors. Medical Radiology, Diagnostic Imaging and Radiation Oncology: Functional MRI. Springer; Berlin: 1999. pp. 393–406. [Google Scholar]
- Moore BCJ. An Introduction to the Psychology of Hearing. Academic; London: 1997. [Google Scholar]
- Nixon CW. Hearing protective devices: Ear protectors. In: Harris CM, editor. Handbook of Noise Control. McGraw-Hill; New York: 1979. pp. 12-1–12-13. [Google Scholar]
- Nixon CW, von Gierke HE. Experiments on the bone-conduction threshold in a free sound field. J. Acoust. Soc. Am. 1959;31:1121–1125. [Google Scholar]
- Palmer AR. Personal communication to M.E.R. 1998.
- Pla FG, Sommerfeldt SD, Hedeen RA. Proceedings of Active 95. Noise Control Foundation; Poughkeepsie, NY: 1995. Active control of noise in magnetic resonance imaging; pp. 573–582. [Google Scholar]
- Press WH, Flannery BP, Teukolsky SA, Vetterling WT. Numerical Recipes in C. Cambridge University Press; Cambridge: 1988. [Google Scholar]
- Prieto TE, Bennett K, Weyers D. Acoustic noise levels in a head gradient coil during echo planar imaging; Proceedings of the International Society for Magnetic Resonance in Medicine, Sixth Scientific Meeting and Exhibition; 1998. p. 750. [Google Scholar]
- Ravicz ME, Melcher JR, Kiang NY-S. Acoustic noise during functional magnetic resonance imaging. J. Acoust. Soc. Am. 2000;108:1683–1696. doi: 10.1121/1.1310190. [DOI] [PMC free article] [PubMed] [Google Scholar]
- Ravicz ME, Melcher JR, Wald LL. Reducing acoustic noise transmission from gradient coils to subject during fMRI: An approach and preliminary results. NeuroImage. 1999;9:S1. [Google Scholar]
- Robinette MS. Integrating audiometric results. In: Katz J, editor. Handbook of Clinical Audiology. Williams and Wilkins; Baltimore: 1994. pp. 181–194. [Google Scholar]
- Royster JD. Occupational and forensic audiology. Curr. Opin. Otolaryngol. Head Neck Surgery. 1996;4:345–352. [Google Scholar]
- Royster JD, Berger EH, Merry CJ, Nixon CW, Franks JR, Behar A, Casali JG, Dixon-Ernst C, Kieper RW, Mozo BT, Ohlin D, Royster LH. Development of a new standard laboratory protocol for estimating the field attenuation of hearing protection devices. I. Research of Working Group 11, Accredited Standards Committee S12, Noise. J. Acoust. Soc. Am. 1996;99:1506–1526. doi: 10.1121/1.423236. [DOI] [PubMed] [Google Scholar]
- Savoy RL, Ravicz ME, Gollub R. The Psychophysiological Laboratory in the Magnet: Stimulus Delivery, Response Recording, and Safety. In: Moonen C, Bandettini P, editors. Medical Radiology, Diagnostic Imaging and Radiation Oncology: Functional MRI. Springer; Berlin: 1999. pp. 347–365. [Google Scholar]
- Schmitt F, Irnich W, Fischer H. Physiological side effects of fast gradient switching. In: Schmitt F, Stehling MK, Turner R, editors. Echo-Planar Imaging: Theory, Technique and Application. Springer; Berlin: 1998. pp. 201–252. [Google Scholar]
- Schroeter J, Poesselt C. The use of acoustical test fixtures for the measurement of hearing protector attenuation. II. Modeling the external ear, simulating bone conduction, and comparing test fixture and realear data. J. Acoust. Soc. Am. 1986;80:505–527. doi: 10.1121/1.394046. [DOI] [PubMed] [Google Scholar]
- Shah NJ, Jäncke L, Grosse-Ruyken M-L, Müller-Gärtner HW. Influence of acoustic masking noise in fMRI of the auditory cortex during phonetic discrimination. JMRI. 1999;9:19–25. doi: 10.1002/(sici)1522-2586(199901)9:1<19::aid-jmri3>3.0.co;2-k. [DOI] [PubMed] [Google Scholar]
- Shaw EAG. Earcanal pressure generated by a free sound field. J. Acoust. Soc. Am. 1966;39:465–470. doi: 10.1121/1.1909913. [DOI] [PubMed] [Google Scholar]
- Shaw EAG. The transformation of sound pressure level from the free field to the eardrum in the horizontal plane. J. Acoust. Soc. Am. 1974;56:1848–1861. doi: 10.1121/1.1903522. [DOI] [PubMed] [Google Scholar]
- Shaw EAG. Hearing Protector Design Concepts and Performance Limitations. In: Alberti PW, editor. Personal Hearing Protection in Industry. Raven Press; New York: 1982. pp. 51–68. [Google Scholar]
- Talavage TM, Edmister WB, Ledden PJ, Weisskoff RM. Quantitative assessment of auditory cortex responses induced by imager acoustic noise. Hum. Brain Mapping. 1999;7:79–88. doi: 10.1002/(SICI)1097-0193(1999)7:2<79::AID-HBM1>3.0.CO;2-R. [DOI] [PMC free article] [PubMed] [Google Scholar]
- Ulmer JL, Biswal BB, Yetken FZ, Mark LP, Mathews VP, Prost RW, Estkowski LD, McAuliffe TL, Haughton VM, Daniels DL. Cortical activation response to acoustic echo planar scanner noise. J. Comput. Assist. Tomogr. 1998;22:111–119. doi: 10.1097/00004728-199801000-00021. [DOI] [PubMed] [Google Scholar]
- Vér IL, Brown RM, Kiang NYS. Low-noise chambers for auditory research. J. Acoust. Soc. Am. 1975;58:392–398. doi: 10.1121/1.380682. [DOI] [PubMed] [Google Scholar]
- von Gierke HE. Personal protection. Noise Control. 1956;2:37–44. [Google Scholar]
- Warnock ACC, Quirt JD. Airborne Sound Transmission. In: Harris CM, editor. Handbook of Acoustical Measurements and Noise Control. Acoustical Society of America; Woodbury, NY: 1998. Chap. 31. [Google Scholar]
- Waugh R. Pure-tone, third-octave, and octave-band attenuation of ear protectors. J. Acoust. Soc. Am. 1974;56:1866–1869. doi: 10.1121/1.1903524. [DOI] [PubMed] [Google Scholar]
- Waugh R. Simplified hearing protector ratings—an international comparison. J. Sound Vib. 1984;93:289–305. [Google Scholar]
- Zwislocki J. In search of the bone-conduction threshold in a free sound field. J. Acoust. Soc. Am. 1957;29:795–804. [Google Scholar]