

Abstract
Objectives. We investigated the prevalence of obesity and the metabolic correlates of different levels of body mass index (BMI) and waist circumference among the Inuit in 3 countries.
Methods. Data from 4 surveys of Inuit in Canada, Greenland, and Alaska conducted during 1990–2001 were pooled, with a total sample size of 2545 participants. These data were compared with data from a Canadian population of predominantly European origin.
Results. Using the World Health Organization criteria for overweight and obesity, we found that the crude prevalence of overweight among Inuit men and women was 36.6% and 32.5%, respectively, and obesity was 15.8% and 25.5%, respectively. Inuit prevalences were similar to those of the highly developed countries of Europe and North America. As levels of obesity increased, as measured by BMI or waist circumference, the mean values of various metabolic indicators—lipid, glucose, and insulin levels and blood pressure—also increased. However, at each level of BMI or waist circumference, the Inuit had lower blood pressure and lipid levels than did Euro-Canadians.
Conclusions. Our data indicate that universal criteria for obesity may not reflect the same degree of metabolic risk for populations such as the Inuit and suggest that ethnic-specific criteria are needed.
Obesity is now recognized as a major global health threat.1 Evidence for the emerging epidemic has been derived from population surveys measuring body mass index (BMI) and other measures such as waist circumference. International and national guidelines, such as those adopted by the World Health Organization (WHO)1 and the National Institutes of Health,2 define categories of overweight and obese. Although guidelines are important tools for population-level monitoring, the issue of their applicability and generalizability across ethnic groups and countries, which likely differ in the health risks associated with specific BMI categories, remains unresolved.
A meta-analysis of some 33 cohort studies from the Asia-Pacific region with more than 310 000 participants found that substantial risks of cardiovascular events were associated with BMI below the currently defined lower limit of “overweight” (25.0 kg/m2).3 Recently, the International Diabetes Federation proposed a definition of the metabolic syndrome that recognized ethnic differences by including separate cutoff points for the waist circumference for Europeans, South Asians, and East Asians.4
We present data on the measurement of obesity and its metabolic correlates among the Inuit, a people indigenous to the Arctic region whose homeland stretches from the easternmost tip of Russia, across Alaska and Canada to Greenland.5 We use the term Inuit in place of Eskimo as a collective term encompassing various regional groups, including the Central and Siberian Yupik and Inupiat in Alaska, Canadian Inuit, and Greenlanders. These populations are undergoing rapid social and health transitions, with the emergence of chronic diseases such as diabetes and ischemic heart disease, from which they have previously been thought to be “protected.”6,7 Data on obesity and its impact are not only important to the health of this specific population but also contribute to the broader discussion of the need for ethnic-specific reference values for obesity.
METHODS
We pooled the data from 4 studies conducted between 1990 and 2001 in 4 communities in the Bering Strait region of Alaska8; 8 communities in the Kivalliq region of Nunavut territory, Canada9; 14 communities in the Nunavik region of northern Québec, Canada10; and 2 towns and 4 villages on the west coast of Greenland.11 Details on the designs and methods of these studies have been reported elsewhere.8–11 We have also previously published a study on hypertension with the pooled data set.12
The study population was comprised of 2545 participants aged 18 years and older: 454 from Alaska, 380 from Kivalliq, 400 from Nunavik, and 1311 from Greenland. For some analyses, we compared our data to that from a survey conducted among 2200 residents of the Canadian province of Manitoba in 1990, who were predominantly of European origin (hereafter referred to as Euro-Canadians).13 We also compared Inuit with published international data on BMI and waist circumference.
Table 1 ▶ summarizes the various anthropometric and metabolic indicators for men and women in the 4 Inuit study regions. Participants fasted overnight and then completed an interviewer-administered questionnaire and underwent venipuncture, anthropometry, and blood pressure measurements. Height and weight were measured with the participants wearing underwear and socks. With the participant standing, waist circumference was measured midway between the iliac crest and the costal margin (except in Alaska, where it was at the level of the umbilicus; the 4 studies were not planned together with a uniform protocol, so some methodological differences are present).
TABLE 1—
Gender-Specific Mean Values of Selected Anthropometric and Metabolic Variables of 4 Studies of Inuit Populations: United States, Canada, and Greenland, 1990–2001
| Men | Women | |||||||
| Alaska (n = 214), mean (95%CI) | Kivalliq (n = 166), mean (95%CI) | Nunavik (n = 153), mean (95%CI) | Greenland (n = 576a), mean (95%CI) | Alaska (n = 240), mean (95%CI) | Kivalliq (n = 214), mean (95%CI) | Nunavik (n = 247), mean (95%CI) | Greenland (n = 735a), mean (95%CI) | |
| Height, cm | 163.4 (160.7, 166.2) | 165.4 (164.4, 166.5) | 166.3 (165.3, 167.3) | 168.9 (168.2, 169.5) | 153.3 (151.8, 154.8) | 153.6 (152.9, 154.4) | 153.7 (152.9, 154.4) | 157.1 (156.6, 157.6) |
| Weight, kg | 71.2 (69.1, 73.3) | 70.4 (68.4, 72.5) | 73.2 (71.4, 75.1) | 74.1 (72.9 75.3) | 65.2 (63.4, 67.1) | 63.6 (61.9, 65.3) | 64.4 (62.8, 66.3) | 65.3 (64.3, 66.3) |
| BMI, kg/m2 | 26.1 (25.5, 26.8) | 25.7 (25.0, 26.3) | 26.5 (25.9, 27.1) | 26.0 (25.6, 26.3) | 27.4 (26.7, 28.1) | 26.9 (26.2, 27.6) | 27.3 (26.6, 28.1) | 26.4 (26.1, 26.8) |
| WC, cm | 89.6 (87.5, 91.7) | 88.4 (86.4, 90.3) | 87.4 (85.7, 89.2) | 90.2 (89.3, 91.2) | 93.2 (91.1, 95.2) | 86.9 (85.2, 88.7) | 85.6 (83.8, 87.4) | 87.1 (86.2, 88.1) |
| TC, mmol/L | 5.84 (5.68, 5.99) | 4.84 (4.62, 5.05) | 5.18 (5.01, 5.35) | 6.02 (5.90, 6.15) | 5.96 (5.82, 6.09) | 4.87 (4.63, 5.11) | 5.19 (5.06, 5.31) | 5.90 (5.79, 6.01) |
| HDL, mmol/L | 1.38 (1.33, 1.44) | 1.35 (1.28, 1.42) | 1.50 (1.43, 1.57) | 1.54 (1.48, 1.59) | 1.57 (1.51, 1.62) | 1.42 (1.34, 1.51) | 1.62 (1.56, 1.69) | 1.60 (1.56, 1.64) |
| TG, mmol/L | 0.85 (0.77, 0.93) | 0.97 (0.88, 1.06) | 1.16 (1.04. 1.28) | 1.20 (1.12, 1.28) | 0.88 (0.80, 0.95) | 1.10 (1.00, 1.21) | 1.11 (1.04, 1.17) | 1.12 (1.05, 1.19) |
| Glucose, mmol/L | 5.84 (5.64, 6.03) | 4.96 (4.80, 5.13) | 5.27 (5.11, 5.43) | 5.82 (5.73, 5.91) | 5.89 (5.71, 6.08) | 4.93 (4.73, 5.13) | 5.18 (5.01, 5.36) | 5.71 (5.60, 5.82) |
| Insulin, mmol/L | 43.81 (38.61, 49.01) | 53.96 (42.84, 65.08) | 54.48 (44.56, 64.40) | 45.98 (41.62, 50.33) | 51.86 (47.87, 55.85) | 58.31 (46.07, 70.55) | 60.41 (51.69, 69.13) | 51.25 (48.05, 54.44) |
| DBP, mm Hg | 74.6 (73.2, 76.1) | 78.5 (76.9, 80.1) | 76.5 (75.0, 78.0) | 74.9 (73.9, 75.8) | 72.3 (70.8, 73.8) | 73.1 (71.8, 74.4) | 71.1 (70.0, 72.1) | 72.2 (71.4, 73.0) |
| SBP, mm Hg | 117.4 (115.5, 119.2) | 124.2 (121.7, 126.7) | 115.6 (113.5, 117.7) | 120.7 (119.3, 122.1) | 118.5 (116.1, 120.9) | 115.7 (113.6, 117.9) | 109.9 (108.0, 111.7) | 118.4 (117.0, 119.9) |
Note. BMI = body mass index (weight in kilograms divided by height in meters2); WC = waist circumferance; TC = total cholesterol; HDL = high-density-lipoprotein cholesterol; TG = triglyceride; DBP = diastolic blood pressure; SBP = systolic blood pressure.
aGreenland sample included both fasting and nonfasting participants. Only data from fasting participants (289 men and 377 women) were used in analyses involving plasma levels of lipids, glucose, and insulin.
Blood pressure was measured with a mercury sphygmomanometer on the right arm of the sitting participant after at least 5 minutes of initial rest, using an appropriate-sized cuff. Systolic and diastolic blood pressures were determined at the first and fifth Korotkoff sounds. The first 2 measurements were averaged for the analyses. Fasting plasma samples were tested for levels of cholesterol and subfractions, triglycerides, glucose, and insulin. Although different laboratories were used in the 4 studies, comparable techniques were used.
Glucose was analyzed by the hexokinase–glucose 6-phosphate dehydrogenase method, and insulin by radioimmunoassay. Lipids were determined using an autoanalyzer system that used enzymatic colorimetric methods. Canadian and Alaskan samples were analyzed in laboratories that were participants of the Centers for Disease Control and Prevention–National Heart, Lung and Blood Lipids Standardization Program.
The 4 data sets were checked for data entry errors and merged. Statistical analyses on the combined data set were performed using SPSS for Windows, version 13.0 (SPSS Institute, Cary, NC). Gender-specific means of various metabolic variables and their 95% confidence intervals (CIs) were computed for different categories of BMI and waist circumference and compared with the Inuit and Euro-Canadian samples. Because of the skewed distribution of the lipids, glucose, and insulin variables in both samples, log-transformed values were used in the analysis (and back-transformed as geometric means in the graphical presentation).
RESULTS
Prevalence of Overweight and Obesity
When the WHO criteria for overweight (BMI=25.0 to 29.9) and obesity (BMI≥ 30.0) were used, the crude prevalence among Inuit men was 36.6% overweight and 15.8% obese, whereas 32.5% of Inuit women were overweight and 25.5% were obese.
We compared the results from the Inuit population with global data. The WHO publication Comparative Quantification of Health Risks14 provides prevalence estimates for various WHO regions by age and gender groups. When the direct method of age standardization was used, using the hypothetical “world” population of the International Agency for Research on Cancer as the standard, the Inuit’s BMI ranked among the highest of the highly developed countries of Europe and North America (Figure 1 ▶).
FIGURE 1—
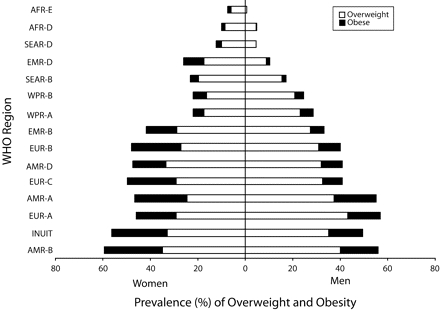
Age-standardized prevalence of overweight and obesity among Inuit compared with World Health Organization (WHO) regions.
Source. Prevalence data for WHO regions are from Tables 8.23 and 8.24 in James et al.14
Note. AFR = Africa region; SEAR = south-east Asia region; EMR = eastern Mediterranean region; WPR = western Pacific region; EUR = European region; AMR = American region. Age-standardization to the International Agency for Research on Cancer “world population” was by the direct standardization method. Data for WHO regions was based on 5 age groups (15–29, 30–44, 45–59, 60–69, ≥ 70 years); Inuit data were based on 4 age groups (15–29, 30–44, 45–59, ≥ 60 years).
Another source of global comparison data is the International Obesity Task Force database, which provides estimates only of crude prevalence of obesity and overweight for all adults.15 Inuit men ranked among the top half of 76 countries and territories in the database in terms of combined prevalence of overweight and obesity. Inuit women ranked in the top quintile of 115 countries and territories.
Few countries have reported waist circumference data. One source is the multinational Monitoring of Trends and Determinants of Cardiovascular Disease study, whose final surveys were conducted in the mid-1990s.16 The age-standardized mean waist circumference of Inuit women (90.3 cm) was higher than those of women at all 36 participating sites, mostly from Europe, North America, and Australasia. Inuit men, with an age-standardized mean of 91.6 cm, ranked quite low; their waist circumference exceeded that of other men at only 4 sites.
Metabolic Correlates of Overweight and Obesity
As levels of obesity increased, as measured by the BMI or waist circumference, the mean values of various metabolic indicators—blood pressure and blood levels of lipids, glucose, and insulin—also increased. However, at each level of the BMI or waist circumference, Inuits had lower levels of most risk factors than did non-Inuit Canadians. Exceptions were fasting plasma levels of both glucose and insulin; with these indicators the 2 groups tended to overlap. Figures 2 ▶ and 3 ▶ show the relation between the BMI and high-density lipoprotein (HDL) cholesterol levels and between the waist circumference and triglyceride levels. (Data tables and additional graphs are available as an online supplement to this article).
FIGURE 2—
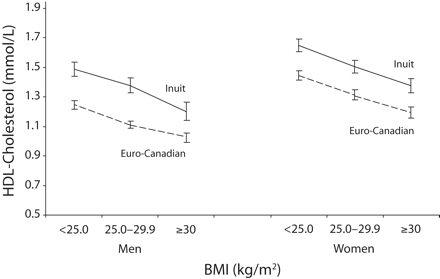
Relation of body mass index (BMI) and mean high-density lipoprotein (HDL) cholesterol values, by gender and ethnic group.
FIGURE 3—
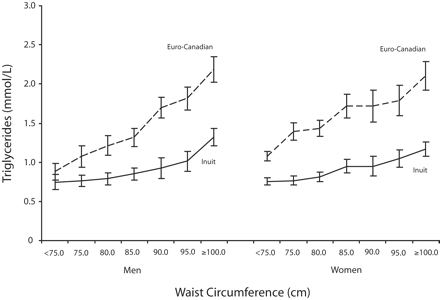
Relation of waist circumference and mean triglyceride values, by gender and ethnic group.
Obese Inuit men with BMIs greater than 30 had a mean HDL level of 1.20 mmol/L (95% CI = 1.14, 1.26), comparable to that of Euro-Canadians with BMIs less than 25 (mean HDL = 1.24 mmol/L; 95% CI = 1.22, 1.27). Obese Inuit women had a mean HDL level of 1.38 mmol/L (95% CI = 1.33, 1.42), comparable to that of Canadians occupying a position intermediate between normal weight (mean HDL = 1.45 mmol/L; 95% CI = 1.41, 1.48) and overweight (mean HDL = 1.31, 95% CI = 1.28, 1.35).
Inuit men with a waist circumference between 95 and 100 cm, considered at high risk by the International Diabetes Federation’s criteria for metabolic syndrome, had a mean triglyceride level of 1.02 mmol/L (95% CI = 0.90, 1.15), which is equivalent to the mean triglyceride level of Euro-Canadians with a waist circumference of 75 to 80 cm (mean = 1.08 mmol/L; 95% CI = 0.94, 1.21).
DISCUSSION
Our pooled data from 4 separate regional studies of Inuit indicate that this ethnic group has high levels of obesity based on BMI and waist circumference according to international guidelines. Among the Inuit, the mean levels of various cardiovascular risk factors increase with increasing levels of obesity, as they do in other populations. However, the metabolic impact of different levels of obesity, at least cross-sectionally, appears to be much less among the Inuit than among Euro-Canadians, especially for indicators such as HDL cholesterol and triglycerides. Although the long-term health consequences of different categories of the BMI and waist circumference can only be ascertained by cohort studies, our data do raise concern about the “one-size-fits-all” approach of international obesity guidelines.
Our data are derived from 4 separate studies that were generally comparable but not identical in methods. In the measurement of the waist circumference, for example, 1 site used a slightly different reference point on the waist. It is unlikely, however, that this slight difference would have affected the results. We also lacked dietary data and thus were unable to assess whether dietary intake could have contributed to the different metabolic responses at different levels of obesity. Because the traditional Inuit diet contains high levels of omega-3 fatty acids from marine mammals and fish, one could speculate that consuming these traditional Inuit foods could modify the relation between obesity and health outcomes.
The limitations of using the BMI as an indicator of excess body fat are well known.17 Although the BMI “adjusts” for height in its computation, it does not completely adjust for body dimensions. Studies have found that it correlates with relative sitting height (ratio of sitting height to stature) across populations.18,19
The early physical anthropology literature has shown that the Inuit tend to have shorter legs.20 The Nutrition Canada Survey of the 1970s confirmed that the relative sitting height of the Inuit was higher than that of Canadians nationally.21 Some of this difference may have been attenuated with increasing height among the younger generation, but there are no recent anthropometry data that include relative sitting height.
The waist circumference does not have the limitations of the BMI with regard to body dimensions. We have found that the waist circumference parallels the BMI in demonstrating the metabolic impact of increasing levels of obesity. The high ranking of waist circumference among Inuit women compared with international populations is of concern. The waist circumference can serve as a focus and yardstick of health promotion activities directed at obesity.
Physiologists Rode and Shephard22 have suggested that long-term adaptation to the Arctic cold favors the deposition of intra-abdominal fat, which stores quickly available fuel for heat production in response to cold-induced catecholamine stimulation. Although subcutaneous fat provides insulation, it is metabolically less active and has a limited blood supply and is thus relatively inflexible when responding to increases in heat flux generated by physical activity.22 Without imaging studies (e.g., computer tomography, ultrasonagraphy, or magnetic resonance imaging) of cross-sections of the body, it is not known whether the central obesity represented by the high waist circumference is predominantly intraabdominal or subcutaneous. We also do not know the body composition (e.g., percentage body fat) of Inuit corresponding to various BMI or waist circumference measurements. Direct measures such as deuterium oxide dilution23 and hydrostatic densitometry22 have been performed on small samples in only 1 community in the 1970s and 1980s, but the underlying assumptions relating to body components and the resulting equations are themselves based on European subjects.
Although the Inuit populations are numerically small globally, their data are of potential interest to other ethnic groups with similar body dimensions (especially East Asians). Unlike East Asians, among whom lower cutoff points for obesity are recommended by some bodies such as the International Diabetes Federation4 but not the World Health Organization,24 it would appear that for the Inuit, higher cutoff points may be needed. However, given the increasing threat of diabetes and other obesity-related diseases, the full public health impact of increasing cutoff points needs to be carefully determined.
Acknowledgments
The merging of the data set and the international collaboration in data analysis and report writing were supported by a development grant awarded to T. K. Young from the Canadian Institutes of Health Research (grant OWK 73 987).
We acknowledge the assistance and collaboration of the local communities and regional governments in the 3 countries.
Human Participant Protection All 4 surveys received institutional review board approvals from their respective institutions. Informed consent was obtained from all participants.
Peer Reviewed
Contributors T. K. Young was the primary author and, together with P. Bjerregaard, was responsible for merging the data sets. All authors were responsible for study design, data collection, and analysis of the 4 separate surveys and contributed to the writing and editing of the article.
References
- 1.Obesity: Preventing and Managing the Global Epidemic: Report of a WHO Consultation on Obesity. Geneva, Switzerland: World Health Organization; 2000. [PubMed]
- 2.Clinical Guidelines on the Identification, Evaluation, and Treatment of Overweight and Obesity in Adults: The Evidence Report. Bethesda, Md: National Institutes of Health; 1998. NIH publication 98-4083.
- 3.Asia Pacific Cohort Studies Collaboration. Body mass index and cardiovascular disease in the Asia-Pacific Region: an overview of 33 cohorts involving 310000 participants. Int J Epidemiol. 2004;33: 751–758. [DOI] [PubMed] [Google Scholar]
- 4.International Diabetes Federation. The IDF consensus worldwide definition of the metabolic syndrome. 2005 Available at: http://www.idf.org/webdata/docs/MetSyndrome_FINAL.pdf. Accessed December 14, 2006.
- 5.Bjerregaard P, Young TK. The Circumpolar Inuit: Health of a Population in Transition. Copenhagen, Denmark: Munksgaard; 1998.
- 6.Bjerregaard P, Young TK, Dewailly E, Ebbesson SOE. Indigenous health in the Arctic: an overview of the circumpolar Inuit population. Scand J Public Health. 2004;32:390–395. [DOI] [PubMed] [Google Scholar]
- 7.Bjerregaard P, Young TK, Hegele RA. Low incidence of cardiovascular diseases among the Inuit—what is the evidence? Atherosclerosis. 2003:166;351–357. [DOI] [PubMed] [Google Scholar]
- 8.Risica PM, Ebbesson SOE, Schraer CD, Nobmann ED, Caballero BH. Body fat distribution in Alaskan Eskimos of the Bering Straits region: the Alaskan Siberian Project. Int J Obesity Relat Metab Disord. 2000;24: 171–179. [DOI] [PubMed] [Google Scholar]
- 9.Young TK. Obesity, central fat patterning and their metabolic correlates among the Inuit of the Central Canadian Arctic. Hum Biol. 1996;68:245–263. [PubMed] [Google Scholar]
- 10.Jørgensen ME, Glumer C, Bjerregaard P, Gyntelberg F, Jørgensen T, Borch-Johnsen K. Obesity and central fat pattern among Greenland Inuit and a general population of Denmark (Inter99): relationship to metabolic risk factors. Int J Obes Relat Metab Disord. 2003;27:1507–1515. [DOI] [PubMed] [Google Scholar]
- 11.Dewailly E, Blanchet C, Lemieux S, et al. n-3 Fatty acids and cardiovascular disease risk factors among the Inuit of Nunavik. Am J Clin Nutr. 2001;74: 464–473. [DOI] [PubMed] [Google Scholar]
- 12.Bjerregaard P, Dewailly E, Young TK, et al. Blood pressure among the Inuit (Eskimo) populations in the Arctic. Scand J Public Health. 2003;31:92–99. [DOI] [PubMed] [Google Scholar]
- 13.Young TK, Gelskey DE. Is non-central obesity metabolically benign? Implications for prevention from a population survey of Canadians. JAMA. 1995;274: 1939–1941. [PubMed] [Google Scholar]
- 14.James WPT, Jackson-Leach R, Mhurchu CN, et al. Overweight and obesity (high body mass index). In: Ezzati M, Lopez AD, Rodgers A, Murray CJL, eds. Comparative Quantification of Health Risks: Global and Regional Burden of Diseases Attributable to Selected Major Risk Factors. Vol 1. Geneva, Switzerland: World Health Organization, 2004:497–596.
- 15.International Obesity Task Force. Global obesity prevalence in adults http://www.iotf.org/database/index.asp. Accessed December 14, 2006.
- 16.Tunstall-Pedoe H, ed. MONICA Monographs and Multimedia Sourcebook [CD-ROM]. Geneva, Switzerland: World Health Organization; 2003.
- 17.Garn SM, Leonard WR, Hawthorne VM. Three limitations of the body mass index. Am J Clin Nutr. 1986;44:996–997. [DOI] [PubMed] [Google Scholar]
- 18.Norgan NG. Relative sitting height and the interpretation of the body mass index. Ann Hum Biol. 1994;21:79–82. [DOI] [PubMed] [Google Scholar]
- 19.Charbonneau-Roberts G, Saudny-Unterberger H, Kuhnlein HV, Egeland GM. Body mass index may overestimate the prevalence of overweight and obesity among the Inuit. Int J Circumpolar Health. 2005;64: 163–169. [DOI] [PubMed] [Google Scholar]
- 20.Szathmary E. J. Human biology of the Arctic. In: Damas D, ed. Arctic. Washington, DC: Smithsonian Institution; 1984:64–71. Sturtevant WC, ed. Handbook of North American Indians; vol 5.
- 21.Demirjian A. Anthropometry Report: Height, Weight and Body Dimensions. Ottawa, Ontario: Department of National Health and Welfare; 1980:107–108.
- 22.Rode A, Shephard RJ. Prediction of body fat content in an Inuit community. Am J Human Biol. 1994;6: 249–254. [DOI] [PubMed] [Google Scholar]
- 23.Shephard RJ, Hatcher J, Rode A. On the body composition of the Eskimo. Eur J Appl Physiol. 1973; 30:1–13. [Google Scholar]
- 24.WHO expert consultation. Appropriate body-mass index for Asian populations and its implications for policy and intervention strategies. Lancet. 2004;363: 157–163. [DOI] [PubMed] [Google Scholar]