

Abstract
Chemotaxis receptors and associated signalling proteins in Escherichia coli form clusters that consist of thousands of molecules and are the largest native protein complexes described to date in bacteria. Clusters are located at the cell poles and laterally along the cell body, and play an important role in signal transduction. Much work has been done to study the structure and function of receptor clusters, but the significance of their positioning and the underlying mechanisms are not understood. Here, we used fluorescence imaging to study cluster distribution and follow cluster dynamics during cell growth. Our data show that lateral clusters localise to specific periodic positions along the cell body, which mark future division sites and are involved in the localisation of the replication machinery. The chemoreceptor cluster positioning is thus intricately related to the overall structure and division of an E. coli cell.
Keywords: bacteria, chemotaxis, cytokinesis, DNA replication, signal transduction
Introduction
Spatial organisation of the bacterial cell is still poorly understood, although the emerging picture is increasingly complex (Errington, 2003; Lewis, 2004; Lowe et al, 2004; Moller-Jensen and Lowe, 2005). One of the most prominent structures in Escherichia coli and in other bacteria are clusters formed by chemosensory signalling complexes. Receptor clusters include tens of thousands of receptor, histidine kinase CheA, and ‘adaptor' CheW proteins and play a crucial role in signal processing in bacterial chemotaxis (Sourjik and Berg, 2004; Wadhams and Armitage, 2004; Parkinson et al, 2005). The size of an average receptor cluster, observed in immuno-electron and fluorescence microscopy images, is about 200 nm (Maddock and Shapiro, 1993; Sourjik and Berg, 2000), comprising a significant fraction of the cell surface. To fit this size, 7500 receptor dimers (Li and Hazelbauer, 2004) of 2.5 nm diameter each (Kim et al, 1999) have to be tightly packed in a two-dimensional lattice (Shimizu et al, 2000; Kim et al, 2002; Levit et al, 2002). All of the other chemotaxis proteins—the response regulator CheY, the phosphatase CheZ, the methyltransferase CheR, and the methylesterase CheB—localise to these clusters (Sourjik and Berg, 2000; Shiomi et al, 2002; Cantwell et al, 2003; Banno et al, 2004) to form a large signal processing complex.
Because E. coli cells make temporal rather than spatial comparisons of chemoeffector concentrations (Berg and Brown, 1972), it is believed that the physical location of a cluster in the plasma membrane is not important for signal processing (Berg and Turner, 1995). However, cluster distribution in the cell is not random. Largest clusters are found at the poles, but lateral clusters are also observed (Maddock and Shapiro, 1993; Maki et al, 2000; Sourjik and Berg, 2000; Kentner et al, 2006). It has been proposed that multiple lateral clusters in filamentous cells, which are produced by treatment with a cell-division inhibitor cephalexin, might localise to the inhibited cell-division sites (Maki et al, 2000). Here we used fluorescence microscopy to study systematically the distribution of receptor clusters in a cell population and the cluster dynamics during cell growth and division. Our results clearly demonstrate that positioning of receptor clusters in E. coli relies on a specific mechanism.
Results
Periodic positioning of lateral receptor clusters
We first studied the spatial distribution of clusters in an exponentially growing culture of wild-type E. coli cells (Figure 1A). Because fluorescent protein fusions to receptors interfere with clustering and nearly abolish cluster formation in the absence of native receptors (Homma et al, 2004; Kentner et al, 2006), receptor clusters were visualised using a yellow fluorescent protein (YFP) fused to the methyltransferase CheR. This YFP-CheR fusion binds to a C-terminal pentapeptide sequence of the major receptors Tar and Tsr, is functional, and does not localise in the absence of receptors at any tested expression level (Wu et al, 1996; Shiomi et al, 2002; Kentner et al, 2006). Moreover, changes in the level of receptor methylation that result from deletion or overexpression of CheR have only minimal effects on cluster stability (Liberman et al, 2004; Lybarger et al, 2005; Shiomi et al, 2005). YFP-CheR is thus a good marker of cluster positioning; to ensure that fluorescence intensities of foci are proportional to the number of receptor molecules in clusters, the fusion was expressed at an average level of 3000 copies per cell, comparable to 15 000 copies of receptors (Li and Hazelbauer, 2004). At this expression level, the number of cytoplasmic YFP-CheR molecules in the area of the diffraction-limited size, 1–2% of the total cell area, will be 30–60 or even less if clustering is taken into account. Given the empirical threshold intensity for a visual cluster detection under our imaging conditions—20–25% above the background—we estimate that few tens of localised YFP-CheR molecules are detected as a cluster.
Figure 1.
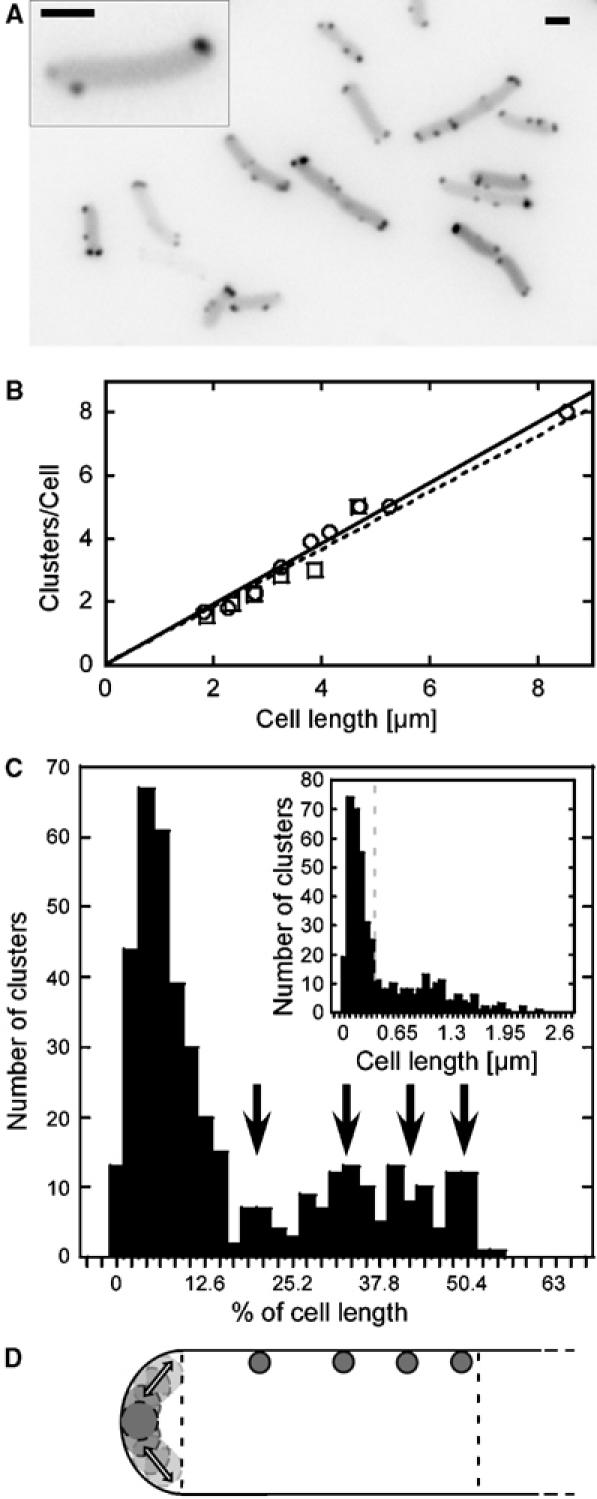
Intracellular distribution of chemoreceptor clusters. (A) Receptor clusters in exponentially growing wild-type RP437 cells were visualised by YFP-CheR expression from pVS102. The inset shows a close-up of a single cell. The lookup table (LUT) of the images was inverted to facilitate cluster recognition. Scale bars here and elsewhere are 1 μm. (B) Dependence of the number of clusters on cell length. Cluster were labelled in RP437 with YFP-CheR (open circles) or CheY-YFP (open squares) and counted in Z-stacks of images for 100 cells of each strain. Data were binned into 500 nm intervals of the cell length. (C) Distribution of a total of 429 cluster positions along the cell body in a population of 146 cells. Distance of a cluster from the adjacent pole was plotted as a fraction of individual cell length with a bin size of 2.1%, corresponding to an average of 0.065 μm or the size of 1 pixel. Peaks in the distribution are indicated by black arrows. Inset: same data set but plotted as absolute distance (μm) with a bin size of 0.065 μm. The grey dashed line indicates the polar zone, 0.26 μm. (D) Cartoon of cluster positioning in one half of an E. coli cell. Dashed lines indicate the polar zone and the mid cell. Preferred cluster positions are shown by the grey dots, corresponding to peaks in (C). Transparent circles and arrows at the pole indicate dynamic cluster positions within the polar zone.
The total number of visually distinguishable YFP-CheR-labelled clusters (Figure 1A), counted in Z-stacks, showed a linear dependence on the cell length, with an average of one lateral cluster per 1 μm of the cell length (Figure 1B). When only one focal plane was analysed, this dependence was still linear but had a smaller slope, suggesting that only about 60% of all clusters are visible in one plane (Supplementary Figure S4). Similar numbers were obtained for clusters labelled with CheY-YFP, which binds to the kinase CheA (Figure 1B), suggesting that a large majority of YFP-CheR-labelled clusters consist of fully assembled sensory complexes, and that neither fusion protein significantly affects clustering. The number of clusters per cell depends not only on cell length but also on the levels of sensory complex components, because a ΔflgM strain (VS102) with approximately six-fold elevated expression of chemotaxis proteins (Kollmann et al, 2005) shows about twice as many clusters per unit of cell length in addition to having larger clusters (Supplementary Figure S5). Such dependence also explains the intercellular variation in the number and size of clusters in one population (Figure 1A), as native expression levels of all chemotaxis proteins have been shown to vary significantly from cell to cell (Kollmann et al, 2005).
To test whether positioning of lateral clusters in a cell is random, we measured the distance from each cluster to the proximal cell end and plotted these distances in a population either as a fraction of a cell length (Figure 1C, main panel) or in absolute units (Figure 1C, inset). The largest peak of both histograms corresponded to polar clusters, which were distributed over the entire polar region, 0.256±0.033 μm or 12–14% of the cell length. However, when the distance of clusters from the pole was plotted as a fraction of an individual cell length, distribution of lateral clusters showed several additional peaks. These peaks were positioned at approximately 20, 33, 42, and 50% of the cell length (Figure 1C and D), with a period roughly corresponding to 1/8 of the distance between polar regions. Such periodicity was not observed when cluster positions were plotted as absolute distances from the pole (Figure 1C, inset).
Distribution of lateral clusters in filamentous cells that were grown in the presence of the cell-division inhibitor cephalexin for 1.5 h was also apparently periodic (Supplementary Figure S6), as observed previously (Maki et al, 2000). The distribution of the distances between neighbouring clusters showed major peaks at 1 and 2 μm, which correspond to approximately 50 and 100% of the average length of newly divided cells, and a relatively sharp cut-off at 2 μm.
Cluster dynamics
We further used time-lapse imaging of growing cells to study the behaviour of receptor clusters over time. First, we followed the appearance of new clusters during cell growth and division (Figure 2A). To assure a coordination of cluster assembly and fluorescent labelling in these experiments, we used a strain that was engineered to express CheY-YFP from the native genomic promoter (Kollmann et al, 2005). Large majority of clusters appeared laterally (Figure 2B), again with an apparently periodic peak distribution, although the position of newly appeared clusters could not be determined with such precision as for the existing ones owing to their low intensity. These newly nucleated clusters subsequently grew at an average rate of 0.2%/min (Figure 2C). High-resolution time-lapse imaging showed that, as cells grew and divided, lateral clusters at the mid-cell and those at the quarter of the cell length became polar after one or two rounds of division, respectively (Figure 3A), which was consistent with their localisation to the future division sites. We also observed that the mobility of polar and lateral clusters was quite different; this was true in both growing and non-growing cells. Many polar clusters were rather dynamic, with a maximal displacement of 0.485 μm per frame (Figure 3B and C), although their movement was always restricted to the polar region. The movement was discontinuous, with periods of low mobility followed by periods of high mobility. We also frequently observed fissions and fusions of polar clusters. In contrast, all lateral clusters were nearly immobile, moving only with cell growth. Such low mobility could not be explained by their size, as the lateral clusters were on average smaller (less bright) than polar clusters, and strongly suggested an anchoring to some intracellular structure.
Figure 2.
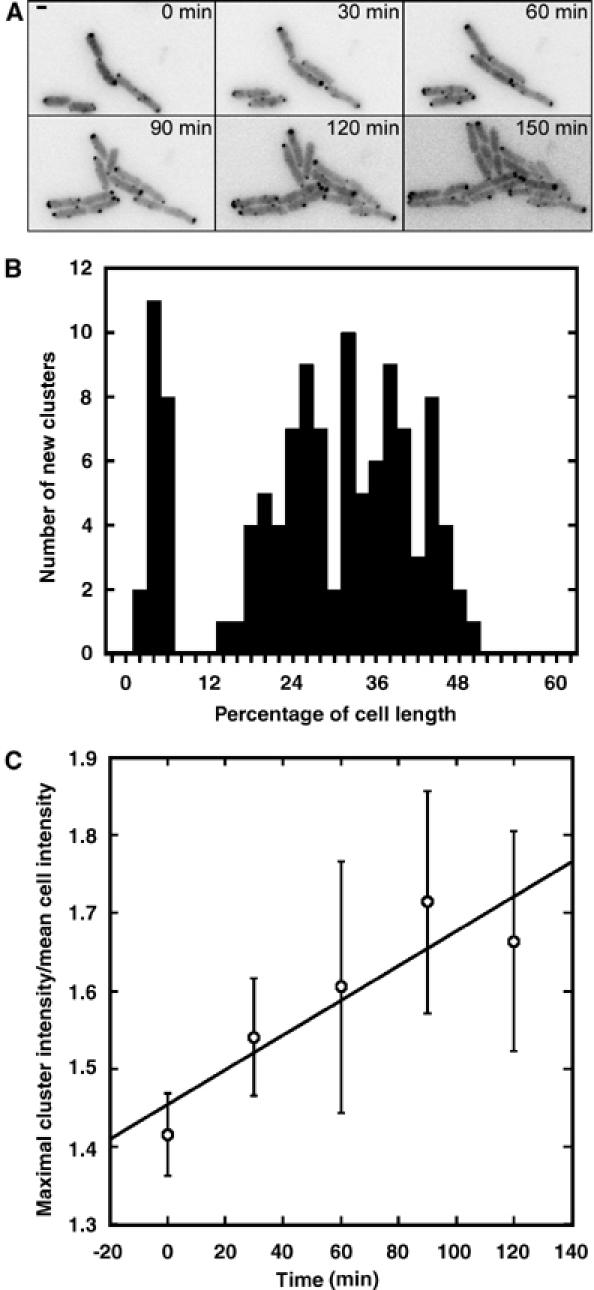
Appearance and growth of clusters. (A) Time-lapse images of growing VS162 cells, which express CheY-YFP from the native chromosomal location of cheY. (B) Positions of a total of 116 newly appeared clusters in a population of 68 cells, plotted as in Figure 1C. (C) Growth of newly appeared clusters, measured as an increase in the maximal cluster intensity; the values were normalised to the mean fluorescence intensity in a corresponding cell to correct for gradual bleaching during time-lapse experiments. Slope of the linear fit to the data is 0.002. Error bars indicate standard errors.
Figure 3.
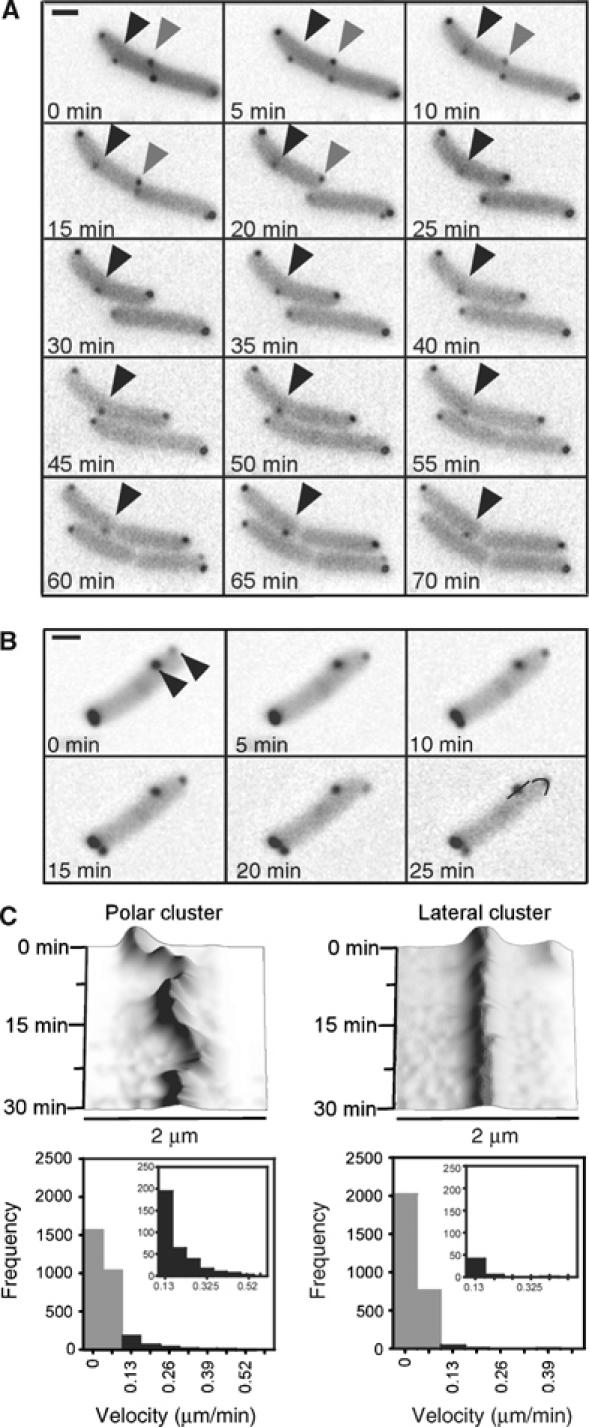
Cluster repositioning and mobility. (A) Time-lapse images of growing wild-type cells with receptor clusters being marked by YFP-CheR as in Figure 1. Grey arrow indicates a lateral cluster that was initially positioned at approximately 50% of the cell length and became polar after the next cell division (20 min). Black arrow denotes a cluster that was initially positioned at a quarter of the cell length and became polar two generations later (65 min). Corresponding movie is included as Supplementary Movie 1. (B) Time-lapse images used for cluster mobility analysis. Different from (A), the cells were placed on the agarose pads without tryptone broth and were not growing in course of the experiment. The arrows indicate a polar and a lateral cluster, respectively. Black lines in the last frame denote the line-type regions of interests used for generation of time–space plots. Corresponding movie is included as Supplementary Movie 2. (C) Mobility of polar (left panels) and lateral (right panels) clusters. Top panels: examples of time–space plots of movements of the two clusters shown in (B), made as described in Materials and methods. Bottom panels: distributions of the frame-to-frame displacement for 100 polar and 100 lateral clusters in the sequences of time-lapse images that were taken every 60 s. Bin size is 0.065 μm/frame. Grey bars denote a part of the distribution, with the displacement of no more than 1 pixel/frame, which corresponds to the noise in image acquisition and processing displacement; displacement of the same magnitude was observed perpendicular to the cell membrane. Insets show enlargements of the part of the distribution with significant cluster movement.
Lateral cluster positioning is independent of MinCDE and MreB
In E. coli, the division is initiated by the assembly of a ring structure by the bacterial tubulin homologue FtsZ in the middle of a cell (Bi and Lutkenhaus, 1991; Addinall and Holland, 2002). The placement of this ring is controlled by a MinCDE system (de Boer et al, 1989; Akerlund et al, 1992; Hale et al, 2001), which suppresses FtsZ polymerization elsewhere. The MinC–MinD complex—a suppressor of FtsZ polymerisation (Hu et al, 1999)—oscillates periodically along a helical track between the poles, driven by MinE (Hu and Lutkenhaus, 1999; Raskin and de Boer, 1999; Shih et al, 2003), thereby generating an averaged concentration profile of MinCD with a minimum in the middle of the cell. As lateral clusters are apparently localised to the future division sites, we investigated whether this localisation might depend on the Min system. There was, however, no apparent correlation between the concentration profile of a YFP-MinD fusion and the positions of lateral clusters that were marked by a CheR fusion to cyan fluorescent protein, CFP (Figure 4A and B). Furthermore, the localisation of lateral clusters in a min mutant strain was similar to that in the wild type (Figure 4C). It is thus unlikely that the Min system is involved in establishing the periodic structure that anchors lateral receptor clusters to future division sites.
Figure 4.
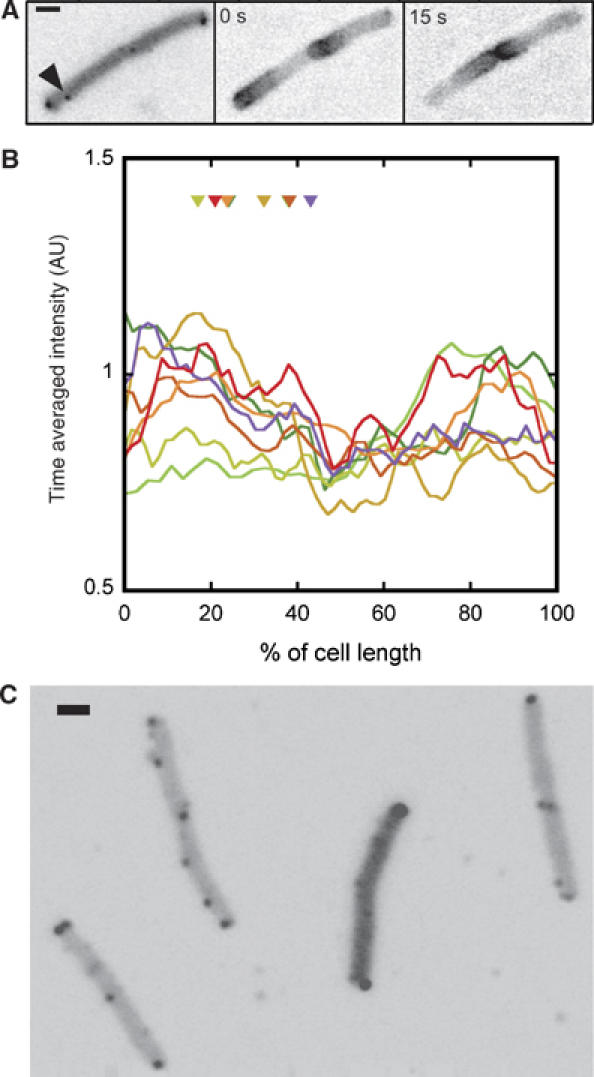
Independence of cluster positioning of the MinCDE system. (A) Receptor clusters, marked by CFP-CheR expression from pVS101 (left panel; the arrow indicates a lateral cluster), and oscillating YFP-MinD expressed from pSR4 (middle and right panels), visualised in the same cell. Expression of YFP-MinD was induced with 10 μM IPTG. (B) Time-averaged intensity profiles of the spatial YFP-MinD distribution and positions of lateral clusters (triangles) in eight individual cells, each marked by a different colour. (C) Clusters, marked by YFP-CheR as in Figure 1, in min (PB114) cells.
The actin-like MreB filament is another structure that could potentially provide positional information and anchorage for lateral clusters. MreB determines the rod shape of E. coli and other bacteria by forming a helical filament under the cytoplasmic membrane and directing synthesis of the lateral cell wall (Wachi et al, 1987; Jones et al, 2001; van den Ent et al, 2001; Daniel and Errington, 2003). Consequently, depolymerisation of the MreB filament in growing cells by the MreB-inhibiting antibiotic A22 (Iwai et al, 2002, 2004; Gitai et al, 2005) resulted in cell swelling and led to some loss of cluster periodicity (data not shown). However, a short treatment with A22 that depolymerised MreB filaments—visualised by expression of YFP-MreB—without affecting the cell shape did not have any apparent effect on the positioning or mobility of lateral clusters (Figure 5A). In an mreB mutant, quantification of the cluster distribution and cluster classification into polar and lateral was complicated by the round shape of the cells, but cell polarity could be established in dividing cells (Figure 5B). In this case, ‘lateral' clusters with a relatively low mobility and ‘polar' clusters at the septum with high mobility could be distinguished. Altogether, these results argue that the MreB filament is not responsible for cluster anchoring, although it might influence cluster positioning through its effect on cell shape.
Figure 5.
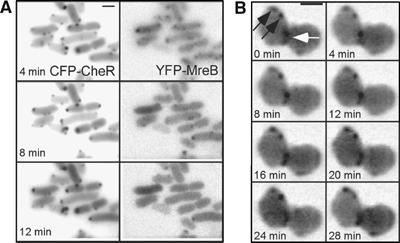
Independence of cluster positioning of the MreB filament. (A) Time-lapse image sequence showing receptor clusters (marked by CFP-CheR as in Figure 4, left panel) and MreB filaments (marked by YFP-MreB, right panel) in wild-type cells. YFP-MreB expression was induced from pDK99 with 5 μM IPTG. The cells were treated with the MreB-depolymerizing antibiotic A22 at zero time point. Disassembly of the MreB complexes did not have a visible effect on the positioning of lateral clusters. (B) Time lapse of a dividing mreB (HCB1435) cell. Constriction site (white arrow) serves as a reference point for the future polar zone. Clusters that are lateral relative to this position (black arrows) do not move within the time of the imaging, whereas the cluster at the constriction site is mobile. Clusters were marked by YFP-CheR as in Figure 1.
Same structure anchors lateral clusters and replication machinery
Replication machinery is the only structure that is known to be specifically positioned at about a quarter of the cell length in E. coli (Lau et al, 2003; Bates and Kleckner, 2005). We thus compared the localisation of lateral clusters with that of the replication origins and replisomes (Figure 6). Following a recently developed approach (Lau et al, 2003), we integrated an array of 240 tetO operators in the vicinity of the origin on the chromosome and visualised its localisation in the cell by expressing a YFP fusion to the Tet repressor (TetR-YFP). In most cells, clusters did not localise to the same spot as the origins (Figure 6A), but the distribution of differences in their positions relative to the pole in individual cells showed a clear peak at zero (Figure 6B), indicating a preferential localisation to the same plane along the cell axis. A similar result was obtained when the replication machinery (Figure 6C and D) was visualised directly by expression of a YFP fusion to the replisome-associated SSB protein (Possoz et al, 2006), strongly suggesting that the replication machinery and lateral clusters are anchored by the same structure. Some clue about the nature of this hypothetical structure was given by the time-lapse imaging of the SSB-YFP-labelled replisomes (Figure 7), which showed a rapid movement perpendicular to the cell axis. This movement was largely restricted to a narrow region of the cell and appeared to take place along short helices rather than circles (Supplementary Movies 3A, B and C).
Figure 6.
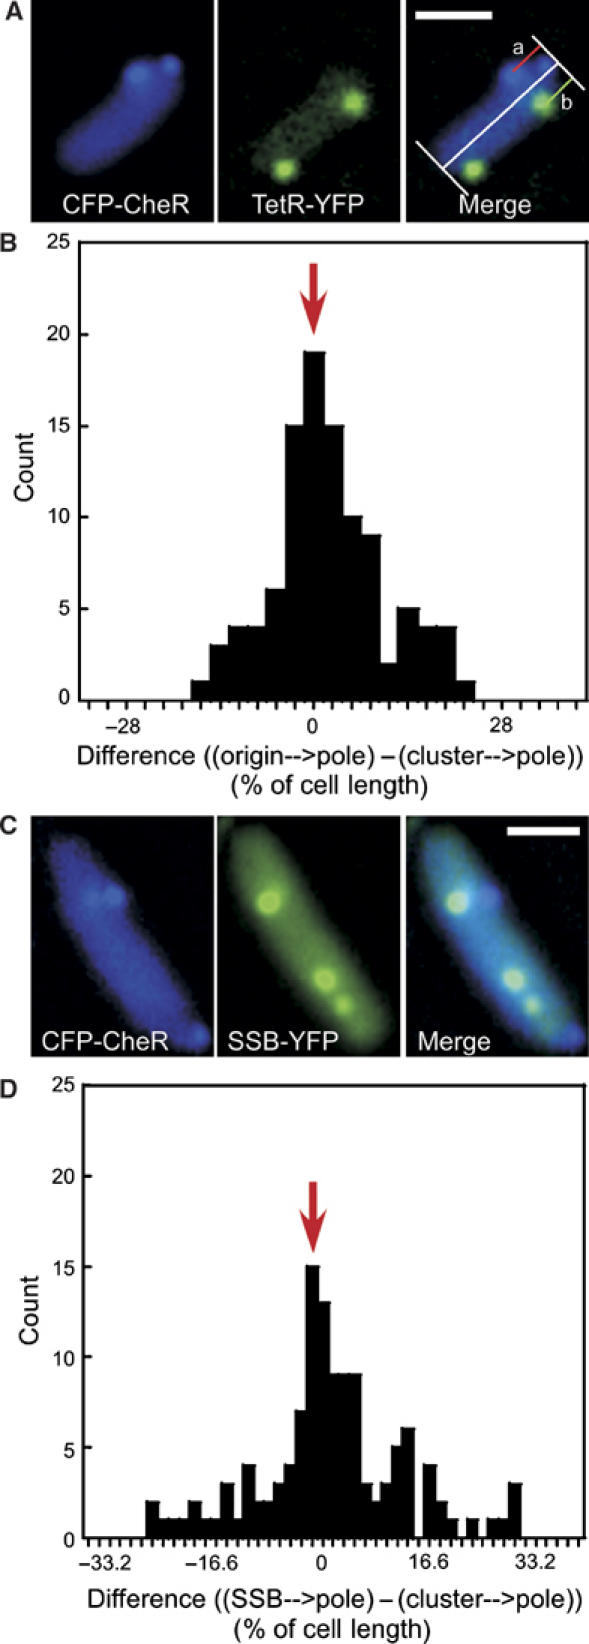
Relative localisation of lateral clusters and the replication machinery. (A) Receptor clusters (marked by CFP-CheR as in Figure 4, left panel), origins of replication (marked by TetR-YFP, middle panel), and their relative localisation (right panel) in a representative cell. TetR-YFP was expressed from pSR5 at 5 μM IPTG induction. A tetO-array was integrated near the chromosomal origin of replication as described in Materials and methods. The distance of clusters (a) and origins (b) to the adjacent cell pole was measured as shown in the right panel. The pixel with the highest intensity was taken as the centre of mass of the diffraction-limited fluorescence spots. (B) Differences between the relative positions of lateral clusters and origins of replication, determined as b–a in (A) and plotted as the fraction of individual cell length. Between clusters and origins, 102 distances were plotted with a bin size of 2.8%, corresponding to an average of 0.065 μm or 1 pixel. (C) Receptor clusters (marked by CFP-CheR as in Figure 4A, left panel), replisomes (marked by SSB-YFP, middle panel), and their relative localisation (right panel) in a representative cell. SSB-YFP was expressed from pSR6 at 5 μM IPTG induction. (D) Differences between the relative positions of lateral clusters and replisomes, determined and plotted as in (A, B). Between clusters and replisomes, 102 distances were plotted with a bin size of 1.66%, corresponding to an average of 0.065 μm. Red arrows in (B) and (D) denote a peak at zero, which suggests that clusters preferentially localise to the same plane along the cell axis as origins of replication and replisomes. The analysis was restricted to the cells with one lateral cluster and one origin or SSB focus per cell half.
Figure 7.
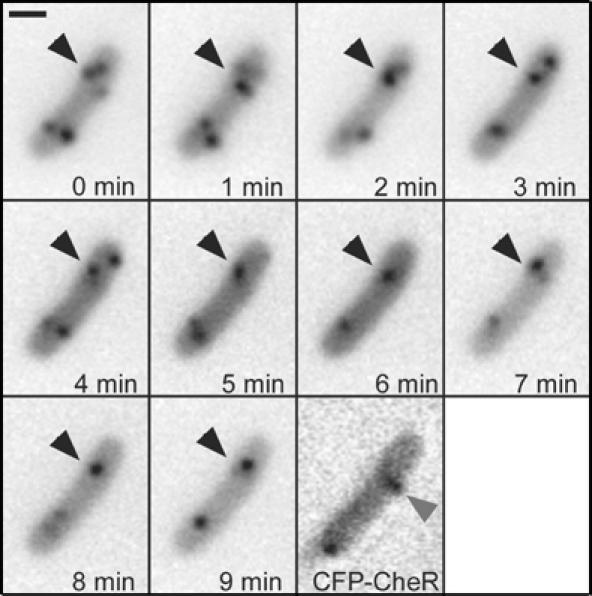
Dynamics of SSB foci. Replisomes and clusters were marked as described in Figure 6 and images were taken every 60 s. The black arrows denote moving structures marked with SSB-YFP. The grey arrow indicates a lateral cluster. Corresponding movies are included as Supplementary Movies 3A, B and C.
Discussion
Mechanism of periodic cluster positioning
Recent studies revealed a high degree of spatial organisation in bacterial cells, and positioning of the chemoreceptor clusters does not appear to be an exception. Lateral clusters are distributed along the cell body in a periodic manner, with the peak positions roughly corresponding to 1/8, 1/4, 3/8, 1/2, 5/8, 3/4, and 7/8 of the distance between polar regions. Such periodicity suggests an anchorage to some hypothetical structure, which is further supported by the apparent immobility of lateral clusters. Our results make it unlikely that this structure relies directly on either the Min septum positioning system or the MreB cytoskeleton, although cluster positioning was affected by a loss of the rod shape upon a long-term treatment with the MreB inhibitor A22. At the current stage, we can only speculate about the nature of this structure. Many protein complexes in bacteria appear to localise along helical filaments, and it has been recently shown that receptors become inserted into the cytoplasmic membrane along the helically distributed Sec complexes (Shiomi et al, 2006). The relevance of such a mode of insertion to the positioning of lateral clusters remains to be investigated, but a helix alone cannot produce periodically distributed anchoring sites. Although periodic point-like marks can be created by the crossing of two helical structures with an opposite direction but the same pitch (Figure 8A), such marks would not be consistent with our observation that the replication machinery localises to the same plane along the cell body—but does not co-localise—with the lateral clusters at a quarter of the cell length. Such localisation strongly argues for an alternative model, where the sites are marked by periodically positioned ring-like or short helical structures, with the mode of a replisome movement favouring the latter model (Figure 8B). Lateral movement of replisomes (Figure 7) and broadness of the peaks in Figures 1C and 6 indicate that these periodic marks have a significant width. Additionally, clusters might be positioned on both sides of the structure rather than over its centre, which would be consistent with a later repositioning to a cell pole of one of the daughter cells upon division (Figure 3A). Distances between marks in this hypothetical structure should scale with the cell length, because periodicity in positioning was only observed when cluster distance from the cell end was plotted as a fraction of cell length and not when it was plotted in absolute units. This model would be consistent with dispersed helical insertion of inner membrane proteins (Shiomi et al, 2006) and lateral cell wall material (Daniel and Errington, 2003) throughout the cell cylinder, so that the distance between any two points along the cell axis scales proportionally to the cell length during growth.
Figure 8.
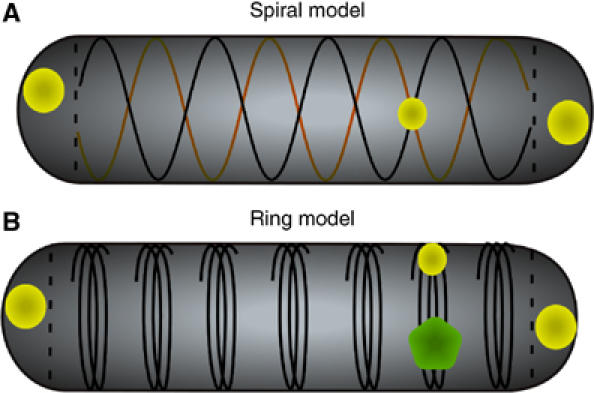
Models of chemoreceptor cluster positioning in E. coli cells. Two possible ways to generate periodic marks for cluster positioning along the cell axis. Point-like periodic marks can be generated by crossing of two helical structures with an opposite direction but the same pitch (A); circular marks require periodically positioned ring-like or short helical structures (B). Receptor clusters are shown in light green and a replisome in dark green.
Cluster assembly and positioning
Our findings suggest that new clusters preferentially assemble laterally and become polar upon several rounds of cell division. Because newly synthesised receptors are believed to be inserted into the cytoplasmic membrane over the entire length of the cell body (Shiomi et al, 2006), clusters presumably nucleate and grow through a gradual association of freely diffusing transmembrane receptor dimers or small complexes, for example, trimers of dimers. Such a picture is supported by the observed gradual growth of clusters after their initial appearance (Figure 2C) and by a relatively high mobility of the non-clustered receptors (Schulmeister et al, unpublished). As expected for self-aggregating complexes, the number of nucleated clusters depends both on the level of receptors in the membrane and the cell length (Figure 1B and Supplementary Figure S5).
Lateral clusters are essentially immobilised by association with the previously discussed hypothetical structure that might also facilitate the initial nucleation of cluster assembly. The latter appears to be stochastic and can be initiated with an approximately equal probability at any of the lateral sites or at the pole (Figure 2B). Once polar, clusters are released and can move but are restricted to the same pole through subsequent generations (Supplementary Figure S7). The mechanism of such restriction may be a larger membrane curvature at the pole, which would make it energetically favourable for larger receptor complexes with diverging outer periplasmic domains (Kim et al, 1999), and polar localisation of receptors indeed strongly correlates with their ability to form clusters (Kentner et al, 2006). Alternatively, clusters could be restricted to the pole by a distinct lipid composition of the polar membrane (Mileykovskaya and Dowhan, 2000) or by some structure that marks a transition from a polar to the lateral membrane.
Role of lateral cluster positioning
As there is no indication that lateral clusters are physiologically different from polar ones, it is likely that there are other reasons for their existence. We propose that cluster prepositioning at the future division sites serves to assure that every newly divided cell has at least one cluster and can perform chemotaxis. This view is supported by our finding that the number of clusters scales with the cell length as one cluster per 1 μm, half the length of a newly divided cell, and by the observed sharp cut-off at 2 μm in the distribution of distances between neighbouring lateral clusters in filamentous cells. An additional function of lateral clusters might be to enable effective chemotaxis in longer cells. At distances over 2 μm, the rate of signal transduction from the sensory clusters to flagellar motors becomes limited by diffusion of phosphorylated CheY (Ishihara et al, 1983; Segall et al, 1985; Sourjik and Berg, 2002; Vaknin and Berg, 2004), so the positioning of lateral clusters along the cell body might help these cells to keep the signalling distance below the limits set by diffusion (Maki et al, 2000).
A recent study of cluster redistribution in Rhodobacter sphaeroides has shown that the cytoplasmic receptor clusters, which are absent in E. coli, are actively segregated to the two daughter cells during division (Thompson et al, 2006). Such segregation, however, would be complicated for the membrane-embedded protein complexes. Our findings suggest that E. coli, and presumably other bacteria, implemented a simpler alternative solution for this problem by nucleating new clusters at the future poles before division.
Relation to cell morphology and division
A number of proteins localise to cell poles in bacteria (Shapiro et al, 2002; Lai et al, 2004). The nature of polar localization determinants might differ among protein complexes, but the underlying positional information is present even before formation of the pole (Janakiraman and Goldberg, 2004b), challenging the conventional view of FtsZ as the first protein to localise to the site of future division in rod-shaped bacteria (Margolin, 2005). In filamentous cells, a polar protein IcsA has been shown to localise at regular intervals of 2–3 μm, which correspond to incomplete preseptation sites, even in absence of FtsZ, MinCDE system, or nucleoid occlusion (Janakiraman and Goldberg, 2004a). Moreover, periplasmic prepolar structures, periseptal annuli, have been observed in longer cells at 1/4 and 3/4 length (Cook et al, 1987). We extend this work by demonstrating the existence of intracellular periodic marks at every 1/8 of a cell length, meaning that the future position of a pole is defined two generations before this site becomes a septum. This suggests that septum positioning systems in E. coli, MinCDE and SlmA (Bernhardt and de Boer, 2005), select the mid-cell from seven predefined potential sites rather than defining the site de novo over the entire cell length. Although the molecular nature of this periodic structure remains to be uncovered, it appears not only to provide positional information for the chemosensory clusters—and presumably other polar proteins—but also to be involved in anchoring of the replication machinery, and thus to have a general importance for cell division and morphology.
Materials and methods
Strain and plasmid construction
The E. coli K12-derived strain RP437 (Parkinson and Houts, 1982) was used as a wild type for chemotaxis. PB114 (ΔminCDE) was a gift from Piet de Boer (Raskin and de Boer, 1999). HCB1435 (RP437 mreB::kan) was a gift from Paola Zucchi. VS126 (RP437 ΔcheR) was constructed by an in-frame deletion of cheR as described before (Sourjik and Berg, 2000). VS162 (cheY-eyfp) and VS102 (ΔflgM) were described before (Kollmann et al, 2005). SR1 was derived from RP437 by integrating a tetO array near the origin of replication on the chromosome by P1 transduction from IL2, an AB1157 derivative carrying the tetO-cassette (Lau et al, 2003). pVS15 that expresses CheY-YFP and pVS102 that expresses YFP-CheR, under the control of the arabinose-inducible pBAD promoter, were described before (Sourjik and Berg, 2000; Kentner et al, 2006); both carry CamR. pVS101 is identical to pVS102, except that YFP was replaced by CFP. minD and mreB were amplified by PCR and cloned using BamHI and Not I as N-terminal YFP fusions into a pDK4 vector (Kentner et al, 2006) to yield pSR4 and pDK99, respectively. tetR and ssb were amplified by PCR and cloned using NcoI and BamHI as C-terminal YFP fusions into a pDK66 vector (Kentner et al, 2006) to yield pSR5 and pSR6, respectively. These fusions are expressed under control of a pTrc promoter, which is inducible by isopropyl β-D-thiogalactoside (IPTG), and carry AmpR.
Growth conditions
Motile cell cultures were grown in tryptone broth (TB; 1% tryptone and 0.5% NaCl) at 34°C and 275 r.p.m. in a rotary shaker to a mid-exponential phase (OD600=0.45–0.5) as described before (Sourjik and Berg, 2000; Kentner et al, 2006). Where appropriate, antibiotics were added to the following final concentrations: ampicillin, 100 μg ml−1; chloramphenicol, 35 μg ml−1; kanamycin, 50 μg ml−1; and gentamycin, 50 μg ml−1. Gene expression was induced with 0.01% arabinose and indicated concentrations of IPTG. Under these conditions, expression level of YFP-CheR (pVS102), determined as before (Kentner et al, 2006), was below 3000 protein copies per cell. When indicated, cephalexin or A22 were added after 2.5 h to the growth medium at a final concentration of 10 μM.
Microscopy
For microscopy, cells were harvested by centrifugation (2900 g, 10 min), washed, and resuspended in tethering buffer (10 mM potassium phosphate, 0.1 mM EDTA, 1 μM L-methionine, 10 mM sodium lactate, pH 7). For snapshot imaging, 10 μl of cell suspension was placed on thin agarose pads (1% agarose in tethering buffer) on microscope slides and allowed to absorb for 5–10 min to immobilise the cells. Agarose pads were then sealed with an Apiezon grease to avoid dehydration and covered with coverslips. For time-lapse imaging with growing cells, the agarose pads that contained 10% tryptone broth were sealed in a custom-made aluminium slide using coverslips on both sides; the cell suspension for these experiments was taken directly from the fresh growing culture, without washing in tethering buffer. The slide was placed into a custom-made temperature-controlled holder connected to a water bath (Lauda Ecoline Staredition RE104), with the measured temperature at the stage set between 34 and 35°C. For time-lapse experiments that did not require cell growth, the microscopy slide was prepared the same way except omitting tryptone broth. Fluorescence imaging was performed using HE YFP (excitation BP 500/25; dichroic LP515; emission BP 535/30) and HE CFP (excitation BP 436/25; dichroic LP455; emission BP 480/40) filter sets on a Zeiss Axio Imager.Z1 microscope equipped with an ORCA AG CCD camera (Hamamatsu) and controlled by AxioVision software.
Image processing and data analysis
All image processing was carried out using ImageJ (W Rasband, http://rsb.info.nih.gov/ij/) running on an iMac G5 computer. Measurements of intracellular localisation were carried out by determining the distance between the centre of the structure of interest and the adjacent cell end; cells were treated as symmetric units. The length of the polar region was defined as the distance between the apex of the polar curvature and the plane of the cell with 90% of the mid-cell diameter. Statistics and plotting of the data were performed using KaleidaGraph 3.6 for Macintosh (Synergy Software). Cluster movement in time-lapse image series was characterised by time–space plots that were generated using a kymograph plug-in for ImageJ (J Rietdorf, EMBL, http://www.embl.de/eamnet/html/kymograph.html). For each frame of a time series, intensity values along a line-type region of interest (ROI) were read out. A kymograph or time–space plot was then assembled line by line from these intensity profiles. Object velocity was measured by tracking the pixel(s) with the highest intensity along the y axis, which was performed automatically using the open source R software (http://www.r-project.org).
Supplementary Material
Supplementary Movie 1
Supplementary Movie 2
Supplementary Movie 3A
Supplementary Movie 3B
Supplementary Movie 3C
Supplementary Figure S4
Supplementary Figure S5
Supplementary Figure S6
Supplementary Figure S7
Acknowledgments
We thank TS Shimizu for critical reading of the manuscript and for helpful conversations, P Zucchi, PA de Boer, C Possoz and DJ Sherratt for providing strains and plasmids, M Wachi for sharing the MreB inhibitor A22, L Løvdok for the help with time-lapse imaging, and N Rieber for the help with data analyses. This work was supported by DFG grants SO 421/3-1 and SO 421/6-1 and by HFSP grant RGP66/2005.
References
- Addinall SG, Holland B (2002) The tubulin ancestor, FtsZ, draughtsman, designer and driving force for bacterial cytokinesis. J Mol Biol 318: 219–236 [DOI] [PubMed] [Google Scholar]
- Akerlund T, Bernander R, Nordstrom K (1992) Cell division in Escherichia coli minB mutants. Mol Microbiol 6: 2073–2083 [DOI] [PubMed] [Google Scholar]
- Banno S, Shiomi D, Homma M, Kawagishi I (2004) Targeting of the chemotaxis methylesterase/deamidase CheB to the polar receptor-kinase cluster in an Escherichia coli cell. Mol Microbiol 53: 1051–1063 [DOI] [PubMed] [Google Scholar]
- Bates D, Kleckner N (2005) Chromosome and replisome dynamics in E. coli: loss of sister cohesion triggers global chromosome movement and mediates chromosome segregation. Cell 121: 899–911 [DOI] [PMC free article] [PubMed] [Google Scholar]
- Berg HC, Brown DA (1972) Chemotaxis in Escherichia coli analysed by three-dimensional tracking. Nature 239: 500–504 [DOI] [PubMed] [Google Scholar]
- Berg HC, Turner L (1995) Cells of Escherichia coli swim either end forward. Proc Natl Acad Sci USA 92: 477–479 [DOI] [PMC free article] [PubMed] [Google Scholar]
- Bernhardt TG, de Boer PA (2005) SlmA, a nucleoid-associated, FtsZ binding protein required for blocking septal ring assembly over chromosomes in E. coli. Mol Cell 18: 555–564 [DOI] [PMC free article] [PubMed] [Google Scholar]
- Bi EF, Lutkenhaus J (1991) FtsZ ring structure associated with division in Escherichia coli. Nature 354: 161–164 [DOI] [PubMed] [Google Scholar]
- Cantwell BJ, Draheim RR, Weart RB, Nguyen C, Stewart RC, Manson MD (2003) CheZ phosphatase localizes to chemoreceptor patches via CheA-short. J Bacteriol 185: 2354–2361 [DOI] [PMC free article] [PubMed] [Google Scholar]
- Cook WR, Kepes F, Joseleau-Petit D, MacAlister TJ, Rothfield LI (1987) Proposed mechanism for generation and localization of new cell division sites during the division cycle of Escherichia coli. Proc Natl Acad Sci USA 84: 7144–7148 [DOI] [PMC free article] [PubMed] [Google Scholar]
- Daniel RA, Errington J (2003) Control of cell morphogenesis in bacteria: two distinct ways to make a rod-shaped cell. Cell 113: 767–776 [DOI] [PubMed] [Google Scholar]
- de Boer PA, Crossley RE, Rothfield LI (1989) A division inhibitor and a topological specificity factor coded for by the minicell locus determine proper placement of the division septum in E. coli. Cell 56: 641–649 [DOI] [PubMed] [Google Scholar]
- Errington J (2003) Dynamic proteins and a cytoskeleton in bacteria. Nat Cell Biol 5: 175–178 [DOI] [PubMed] [Google Scholar]
- Gitai Z, Dye NA, Reisenauer A, Wachi M, Shapiro L (2005) MreB actin-mediated segregation of a specific region of a bacterial chromosome. Cell 120: 329–341 [DOI] [PubMed] [Google Scholar]
- Hale CA, Meinhardt H, de Boer PA (2001) Dynamic localization cycle of the cell division regulator MinE in Escherichia coli. EMBO J 20: 1563–1572 [DOI] [PMC free article] [PubMed] [Google Scholar]
- Homma M, Shiomi D, Kawagishi I (2004) Attractant binding alters arrangement of chemoreceptor dimers within its cluster at a cell pole. Proc Natl Acad Sci USA 101: 3462–3467 [DOI] [PMC free article] [PubMed] [Google Scholar]
- Hu Z, Lutkenhaus J (1999) Topological regulation of cell division in Escherichia coli involves rapid pole to pole oscillation of the division inhibitor MinC under the control of MinD and MinE. Mol Microbiol 34: 82–90 [DOI] [PubMed] [Google Scholar]
- Hu Z, Mukherjee A, Pichoff S, Lutkenhaus J (1999) The MinC component of the division site selection system in Escherichia coli interacts with FtsZ to prevent polymerization. Proc Natl Acad Sci USA 96: 14819–14824 [DOI] [PMC free article] [PubMed] [Google Scholar]
- Ishihara A, Segall JE, Block SM, Berg HC (1983) Coordination of flagella on filamentous cells of Escherichia coli. J Bacteriol 155: 228–237 [DOI] [PMC free article] [PubMed] [Google Scholar]
- Iwai N, Ebata T, Nagura H, Kitazume T, Nagai K, Wachi M (2004) Structure-activity relationship of S-benzylisothiourea derivatives to induce spherical cells in Escherichia coli. Biosci Biotechnol Biochem 68: 2265–2269 [DOI] [PubMed] [Google Scholar]
- Iwai N, Nagai K, Wachi M (2002) Novel S-benzylisothiourea compound that induces spherical cells in Escherichia coli probably by acting on a rod-shape-determining protein(s) other than penicillin-binding protein 2. Biosci Biotechnol Biochem 66: 2658–2662 [DOI] [PubMed] [Google Scholar]
- Janakiraman A, Goldberg MB (2004a) Evidence for polar positional information independent of cell division and nucleoid occlusion. Proc Natl Acad Sci USA 101: 835–840 [DOI] [PMC free article] [PubMed] [Google Scholar]
- Janakiraman A, Goldberg MB (2004b) Recent advances on the development of bacterial poles. Trends Microbiol 12: 518–525 [DOI] [PubMed] [Google Scholar]
- Jones LJ, Carballido-Lopez R, Errington J (2001) Control of cell shape in bacteria: helical, actin-like filaments in Bacillus subtilis. Cell 104: 913–922 [DOI] [PubMed] [Google Scholar]
- Kentner D, Thiem S, Hildenbeutel M, Sourjik V (2006) Determinants of chemoreceptor cluster formation in Escherichia coli. Mol Microbiol 61: 407–417 [DOI] [PubMed] [Google Scholar]
- Kim KK, Yokota H, Kim SH (1999) Four-helical-bundle structure of the cytoplasmic domain of a serine chemotaxis receptor. Nature 400: 787–792 [DOI] [PubMed] [Google Scholar]
- Kim SH, Wang W, Kim KK (2002) Dynamic and clustering model of bacterial chemotaxis receptors: structural basis for signaling and high sensitivity. Proc Natl Acad Sci USA 99: 11611–11615 [DOI] [PMC free article] [PubMed] [Google Scholar]
- Kollmann M, Lovdok L, Bartholome K, Timmer J, Sourjik V (2005) Design principles of a bacterial signalling network. Nature 438: 504–507 [DOI] [PubMed] [Google Scholar]
- Lai EM, Nair U, Phadke ND, Maddock JR (2004) Proteomic screening and identification of differentially distributed membrane proteins in Escherichia coli. Mol Microbiol 52: 1029–1044 [DOI] [PubMed] [Google Scholar]
- Lau IF, Filipe SR, Soballe B, Okstad OA, Barre FX, Sherratt DJ (2003) Spatial and temporal organization of replicating Escherichia coli chromosomes. Mol Microbiol 49: 731–743 [DOI] [PubMed] [Google Scholar]
- Levit MN, Grebe TW, Stock JB (2002) Organization of the receptor-kinase signaling array that regulates Escherichia coli chemotaxis. J Biol Chem 277: 36748–36754 [DOI] [PubMed] [Google Scholar]
- Lewis PJ (2004) Bacterial subcellular architecture: recent advances and future prospects. Mol Microbiol 54: 1135–1150 [DOI] [PubMed] [Google Scholar]
- Li M, Hazelbauer GL (2004) Cellular stoichiometry of the components of the chemotaxis signaling complex. J Bacteriol 186: 3687–3694 [DOI] [PMC free article] [PubMed] [Google Scholar]
- Liberman L, Berg HC, Sourjik V (2004) Effect of chemoreceptor modification on assembly and activity of the receptor-kinase complex in Escherichia coli. J Bacteriol 186: 6643–6646 [DOI] [PMC free article] [PubMed] [Google Scholar]
- Lowe J, van den Ent F, Amos LA (2004) Molecules of the bacterial cytoskeleton. Annu Rev Biophys Biomol Struct 33: 177–198 [DOI] [PubMed] [Google Scholar]
- Lybarger SR, Nair U, Lilly AA, Hazelbauer GL, Maddock JR (2005) Clustering requires modified methyl-accepting sites in low-abundance but not high-abundance chemoreceptors of Escherichia coli. Mol Microbiol 56: 1078–1086 [DOI] [PubMed] [Google Scholar]
- Maddock JR, Shapiro L (1993) Polar location of the chemoreceptor complex in the Escherichia coli cell. Science 259: 1717–1723 [DOI] [PubMed] [Google Scholar]
- Maki N, Gestwicki JE, Lake EM, Kiessling LL, Adler J (2000) Motility and chemotaxis of filamentous cells of Escherichia coli. J Bacteriol 182: 4337–4342 [DOI] [PMC free article] [PubMed] [Google Scholar]
- Margolin W (2005) FtsZ and the division of prokaryotic cells and organelles. Nat Rev Mol Cell Biol 6: 862–871 [DOI] [PMC free article] [PubMed] [Google Scholar]
- Mileykovskaya E, Dowhan W (2000) Visualization of phospholipid domains in Escherichia coli by using the cardiolipin-specific fluorescent dye 10-N-nonyl acridine orange. J Bacteriol 182: 1172–1175 [DOI] [PMC free article] [PubMed] [Google Scholar]
- Moller-Jensen J, Lowe J (2005) Increasing complexity of the bacterial cytoskeleton. Curr Opin Cell Biol 17: 75–81 [DOI] [PubMed] [Google Scholar]
- Parkinson JS, Houts SE (1982) Isolation and behavior of Escherichia coli deletion mutants lacking chemotaxis functions. J Bacteriol 151: 106–113 [DOI] [PMC free article] [PubMed] [Google Scholar]
- Parkinson JS, Ames P, Studdert CA (2005) Collaborative signaling by bacterial chemoreceptors. Curr Opin Microbiol 8: 116–121 [DOI] [PubMed] [Google Scholar]
- Possoz C, Filipe SR, Grainge I, Sherratt DJ (2006) Tracking of controlled Escherichia coli replication fork stalling and restart at repressor-bound DNA in vivo. EMBO J 25: 2596–2604 [DOI] [PMC free article] [PubMed] [Google Scholar]
- Raskin DM, de Boer PA (1999) Rapid pole-to-pole oscillation of a protein required for directing division to the middle of Escherichia coli. Proc Natl Acad Sci USA 96: 4971–4976 [DOI] [PMC free article] [PubMed] [Google Scholar]
- Segall JE, Ishihara A, Berg HC (1985) Chemotactic signaling in filamentous cells of Escherichia coli. J Bacteriol 161: 51–59 [DOI] [PMC free article] [PubMed] [Google Scholar]
- Shapiro L, McAdams HH, Losick R (2002) Generating and exploiting polarity in bacteria. Science 298: 1942–1946 [DOI] [PubMed] [Google Scholar]
- Shih YL, Le T, Rothfield L (2003) Division site selection in Escherichia coli involves dynamic redistribution of Min proteins within coiled structures that extend between the two cell poles. Proc Natl Acad Sci USA 100: 7865–7870 [DOI] [PMC free article] [PubMed] [Google Scholar]
- Shimizu TS, Le Novere N, Levin MD, Beavil AJ, Sutton BJ, Bray D (2000) Molecular model of a lattice of signalling proteins involved in bacterial chemotaxis. Nat Cell Biol 2: 792–796 [DOI] [PubMed] [Google Scholar]
- Shiomi D, Banno S, Homma M, Kawagishi I (2005) Stabilization of polar localization of a chemoreceptor via its covalent modifications and its communication with a different chemoreceptor. J Bacteriol 187: 7647–7654 [DOI] [PMC free article] [PubMed] [Google Scholar]
- Shiomi D, Yoshimoto M, Homma M, Kawagishi I (2006) Helical distribution of the bacterial chemoreceptor via colocalization with the Sec protein translocation machinery. Mol Microbiol 60: 894–906 [DOI] [PMC free article] [PubMed] [Google Scholar]
- Shiomi D, Zhulin IB, Homma M, Kawagishi I (2002) Dual recognition of the bacterial chemoreceptor by chemotaxis-specific domains of the CheR methyltransferase. J Biol Chem 277: 42325–42333 [DOI] [PubMed] [Google Scholar]
- Sourjik V, Berg HC (2000) Localization of components of the chemotaxis machinery of Escherichia coli using fluorescent protein fusions. Mol Microbiol 37: 740–751 [DOI] [PubMed] [Google Scholar]
- Sourjik V, Berg HC (2002) Binding of the Escherichia coli response regulator CheY to its target measured in vivo by fluorescence resonance energy transfer. Proc Natl Acad Sci USA 99: 12669–12674 [DOI] [PMC free article] [PubMed] [Google Scholar]
- Sourjik V, Berg HC (2004) Functional interactions between receptors in bacterial chemotaxis. Nature 428: 437–441 [DOI] [PubMed] [Google Scholar]
- Thompson SR, Wadhams GH, Armitage JP (2006) The positioning of cytoplasmic protein clusters in bacteria. Proc Natl Acad Sci USA 103: 8209–8214 [DOI] [PMC free article] [PubMed] [Google Scholar]
- Vaknin A, Berg HC (2004) Single-cell FRET imaging of phosphatase activity in the Escherichia coli chemotaxis system. Proc Natl Acad Sci USA 101: 17072–17077 [DOI] [PMC free article] [PubMed] [Google Scholar]
- van den Ent F, Amos LA, Lowe J (2001) Prokaryotic origin of the actin cytoskeleton. Nature 413: 39–44 [DOI] [PubMed] [Google Scholar]
- Wachi M, Doi M, Tamaki S, Park W, Nakajima-Iijima S, Matsuhashi M (1987) Mutant isolation and molecular cloning of mre genes, which determine cell shape, sensitivity to mecillinam, and amount of penicillin-binding proteins in Escherichia coli. J Bacteriol 169: 4935–4940 [DOI] [PMC free article] [PubMed] [Google Scholar]
- Wadhams GH, Armitage JP (2004) Making sense of it all: bacterial chemotaxis. Nat Rev Mol Cell Biol 5: 1024–1037 [DOI] [PubMed] [Google Scholar]
- Wu J, Li J, Li G, Long DG, Weis RM (1996) The receptor binding site for the methyltransferase of bacterial chemotaxis is distinct from the sites of methylation. Biochemistry 35: 4984–4993 [DOI] [PubMed] [Google Scholar]
Associated Data
This section collects any data citations, data availability statements, or supplementary materials included in this article.
Supplementary Materials
Supplementary Movie 1
Supplementary Movie 2
Supplementary Movie 3A
Supplementary Movie 3B
Supplementary Movie 3C
Supplementary Figure S4
Supplementary Figure S5
Supplementary Figure S6
Supplementary Figure S7