

Abstract
All 13 lipids, including two cardiolipins, one phosphatidylcholine, three phosphatidylethanolamines, four phosphatidylglycerols and three triglycerides, were identified in a crystalline bovine heart cytochrome c oxidase (CcO) preparation. The chain lengths and unsaturated bond positions of the fatty acid moieties determined by mass spectrometry suggest that each lipid head group identifies its specific binding site within CcOs. The X-ray structure demonstrates that the flexibility of the fatty acid tails facilitates their effective space-filling functions and that the four phospholipids stabilize the CcO dimer. Binding of dicyclohexylcarbodiimide to the O2 transfer pathway of CcO causes two palmitate tails of phosphatidylglycerols to block the pathway, suggesting that the palmitates control the O2 transfer process.The phosphatidylglycerol with vaccenate (cis-Δ11-octadecenoate) was found in CcOs of bovine and Paracoccus denitrificans, the ancestor of mitochondrion, indicating that the vaccenate is conserved in bovine CcO in spite of the abundance of oleate (cis-Δ9-octadecenoate). The X-ray structure indicates that the protein moiety selects cis-vaccenate near the O2 transfer pathway against trans-vaccenate. These results suggest that vaccenate plays a critical role in the O2 transfer mechanism.
Keywords: cytochrome c oxidase, fatty acid structure, mass spectrometry, phospholipids, X-ray structural analysis
Introduction
Integral membrane proteins contain various specifically bound lipids, whose hydrophobic tails provide non-polar and highly anisotropic environments in the protein interior. These anisotropic environments, which cannot be created without lipids, are expected to provide unique protein functions that occur only within the interior of the protein. Extensive characterization of integral lipids in the context of complete structural characterization of a given membrane protein is necessary for elucidation of the mechanism of the physiological function of membrane proteins.
Generally speaking, the resolution of X-ray structures of various membrane proteins reported thus far (Marsh and Pali, 2006) is not sufficiently high for determination of the lipid structures, particularly the unsaturated bond positions and the chain lengths of the hydrophobic tails. Mass spectrometry (MS) and tandem mass spectrometry (MS-MS) are powerful tools for analysis of the hydrophobic tail structures. Phospholipase treatment is required for determination of the position of each acyl group in the glycerol backbone. However, complete lipid structural determinations have been reported only for lipids of bacteriorhodopsin and the purple membrane (Corcelli et al, 2000).
The lipids identified in the X-ray structure of bacteriorhodopsin surround the protein in a manner similar to that of the purple membrane (Belrhali et al, 1999), suggesting that the lipid–protein interactions are nonspecific under the physiological conditions. On the other hand, most of the phospholipids found in X-ray structures of the other membrane proteins are tightly bound as structural elements or prosthetic groups. In fact, a cardiolipin (CL), a phosphatidylcholine (PC) and a glucosylgalactosyl diacylglycerol have been identified in the 2.1 and 2.55 Å X-ray structures of bacterial reaction centers, which indicate the existence of various specific lipid/protein interactions (McAuley et al, 1999; Camara-Artigas et al, 2002). Five phospholipid molecules identified in yeast cytochrome bc1 complex at 2.3 Å resolution appear to play specific roles in facilitating structural and functional integrity of the enzyme. Direct involvement of a CL in the bc1 complex for the proton uptake has been proposed (Lange et al, 2001). Several phospholipids have been identified in the X-ray structures of bovine and bacterial cytochrome c oxidase (CcO) but chemical structural confirmation of the assignments has not been provided (Tsukihara et al, 1996; Harrenga and Michel, 1999; Svensson-Ek et al, 2002). CL binding to CcO has been examined by photolabeling (Sedlák et al, 2006).
Here, we report X-ray structures of all 13 lipids contained in a bovine heart CcO preparation, stabilized with decylmaltoside, and chemical structures of these lipids including the chain lengths and the positions of the unsaturated bonds of the hydrophobic tails. Chemical structures of lipids contained in the mitochondrial inner membrane, the other mitochondrial proton-pumping respiratory complexes and the isolated CcO of Paracoccus denitrificans, the ancestor of eukaryotic mitochondrion, have been analyzed by MS spectrometry, for evaluation of the physiological significance of these lipid structures in CcO.
Results
Chemical structural analyses of integral lipids of bovine heart CcO
Phospholipids. Mass spectra of the lipid fraction extracted from CcO purified with crystallization as the final step (hereafter referred to as crystalline CcO) were obtained with an electrospray ionization-time of flight (ESI-TOF) mass spectrometer (Accu TOF, JEOL, JMS-T100LC). The spectra showed six peaks assignable to phospholipids at mass/ion values (m/z) of 742.58, 764.56, 766.58, 780.55, 782.57 and 790.54 in the positive ion mode and six peaks at m/z values of 723.50, 747.52, 766.54, 1446.81, 1447.89 and 1448.97 in the negative ion mode (Figure 1). (In the positive ion mode, Na+ adducts provide these peaks. Thus, the m/z values are 22.99 higher than the true molecular mass values. The values are 1.01 lower in the negative ion modes owing to deprotonation.)
Figure 1.
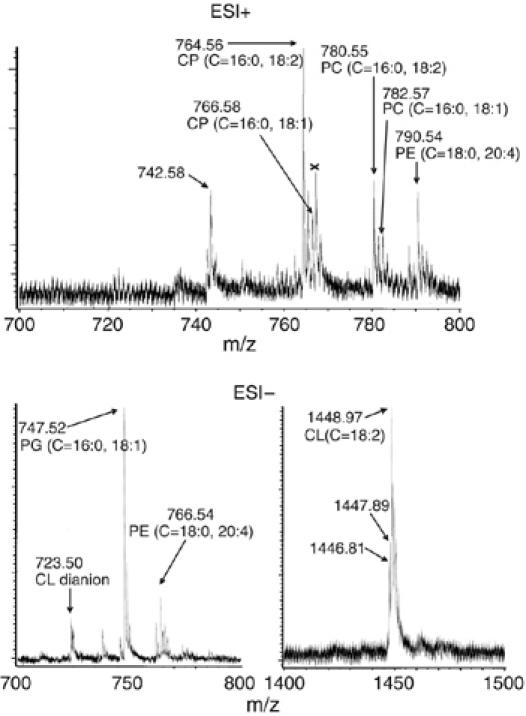
Mass spectra of lipid fraction extracted from the crystalline bovine heart CcO preparation, using an Accu TOF (JEOL, JMS-T100LC) mass spectrometer with methanol. The upper and lower spectra are those in the positive and negative ion modes, respectively. Only the m/z regions where phospholipid signals as shown by arrows are observable are given.
The spectra show many minor bands owing to naturally abundant isotope species, which sometimes overlap with peaks arising from different chemical species having similar molecular weights. For example, the 766.58 peak is near the position of one of the isotope species of the 764.56 species. However, the position of the 766.58 peak is distinguishable from the isotope responsible for the 766.56 peak, as the machine accuracy of the m/z value is less than 5 p.p.m. Furthermore, the 766.58 peak clearly has a higher intensity than that expected for the isotope of the 764.56 species (about 10% of the 764.56 peak intensity). Thus, the 766.58 peak is obviously distinct from the isotope of the 764.56 species. The species showing the 764.56 peak as the Na+ adduct is responsible for the 742.58 peak as the H+ adduct instead of the Na+ adduct. The peak near 767.5 m/z (marked by X) is likely to be due to a trace of a contaminant species as no other reasonable assignment is possible.
The six smaller m/z values in the positive ion mode coincide with the molecular weights of two types of choline plasmalogens (CP) (C42H80NO7P (C=16:0, 18:2) and C42H82NO7P (C=16:0, 18:1)) and PC (C42H80NO8P (C=16:0, 18:2) and C42H82NO8P (C=16:0, 18:1)). The carbon atoms of the glycerol backbone are numbered as follows: C-1 represents the carbon atom at the opposite terminus of the phosphate-bearing carbon; C-2 represents the middle carbon atom; and C-3 represents the phosphate-bearing carbon atom. The numbers of carbon atoms and unsaturated bonds in the C-1 position (W and X) and those in the C-2 position (Y and Z) are denoted by C=W:X, Y:Z in this paper. Using this description, the saturated fatty acyl groups are provisionally placed at the C-1 position. The predictions for the fatty acyl group position were confirmed by the phospholipase A2 treatment as described below. The 790.54 peak indicates the presence of a phosphotidylethanolamine (PE) (C=18:0, 20:4) carrying one sodium ion. The 766.54 peak in the negative ion mode shows the molecular weight of PE (C=18:0, 20:4). The 747.52 peak position coincides with the molecular weight of a phosphatidylglycerol (PG) (C=16:0, 18:1). The 1448.97 peak coincides with that of isolated bovine heart CL (C=18:2 in all the four positions). The 1447.89 peak is assignable to a CL complexed to a decylmaltoside trimer, which has two negative charges. Decylmaltoside was employed as a detergent for stabilization of CcO in aqueous solution. The 1446.81 peak is assignable to the decylmaltoside trimer. The 723.50 m/z value is that of a dianion of CL (1448.97) generated by removal of two protons. The same complexes and the dianion were also observed in a measurement of a mixture of the authentic chemicals. The assignments of peaks of PG and the other phospholipids were confirmed by MS analyses carried out under the same conditions for a synthetic PG (1-palmitoyl-2-oleylphosphatidylglycerol) and these commercially available phospholipids isolated from bovine heart, respectively (data not shown).
For further structural analyses, the lipid extract obtained from the crystalline CcO was fractionated by a two-dimensional thin-layer chromatography (2D-TLC) into four components, CL, PE, PG and a CP/PC mixture (experimental details are provided in Supplementary data 1). MS-MS analysis of each phospholipid fraction confirmed the fatty acid composition as follows: CL contains only a single fatty acid, which has an m/z value of 279. Two types of fatty acids with m/z values of 283 and 303 were observed for PE. PG contained two fatty acid species with m/z values of 255 and 281. The two PC species with m/z values of 742 and 744 provided two fatty acid pairs, (255, 279) and (255, 281), respectively.
The structures of each of the fatty acids were determined by MS–MS analyses of the fatty acid fraction isolated by TLC from a phospholipase lysate of each phospholipid, as described in Materials and methods. The positions of each fatty acid in the glycerol backbone were determined after limited treatment with phospholipase A2 under conditions such that only the ester at the C-2 position is cleaved. Structures of the saturated fatty acids were determined by MS-MS spectral analyses. The MS-MS spectra of these fatty acids with unsaturated bonds were compared with those of the authentic commercially available samples to identify the positions of the unsaturated bonds. By these analyses, the structures of the fatty acids were determined as follows: the fatty acid with the m/z value of 279 arises from CL (CL279): linoleate (Δ9,12-octadecadienoate), PE283: stearate (n-octadecanoate), PE303:arachidonate (Δ5,8,11,14-eicosatetraenoate), PG255: palmitate (n-hexadecanoate), PG281: vaccenate (Δ11-octadecenoate), PC255: palmitate, PC279: linoleate and PC281: oleate (Δ9-octadecenoate) (experimental details for the MS-MS analyses are given in Supplementary data 2). These MS-MS analyses, together with the phospholipase treatment results, indicate that PC, PE and PG contain saturated and unsaturated fatty acyl groups at the C-1 and C-2 positions, respectively, and that CL contains only the linoleic acyl group at all four positions. The phospholipase A2 treatment was performed for the CP/PC mixture without separation, to provide three types of fatty acids, with m/z values of 279 and 281 for the C-2 position and 255 for the C-1 position, consistent with the results of MS-MS analyses of the two PC species. The differences in both of the m/z values between the two PCs and between the two CPs are 2.02, whereas those between the larger PC and CP and between the smaller PC and CP are 16.01, as shown in Figure 1. These results strongly suggest that the structure of each CP is identical to that of the derivative of the corresponding PC. The derivative has a vinylic ether instead of an ester.
The configuration of vaccenate in PG was determined by GC analysis of the methyl ester obtained by solvolysis of lipid fractions of bovine heart CcO (Supplementary data 3-1). The peak positions of methyl esters of cis-oleate, cis-vaccenate and trans-vaccenate are separated well enough for quantitative analysis of the peak areas. The GC analyses indicate that the cis/trans ratio is approximately 12.8:1. The trans isomer was not detected for the oleate from PC. The cis/trans configuration was not examined for the linoleate and arachidonate molecules detected in the crystalline enzyme (experimental details are in Supplementary data 3-1).
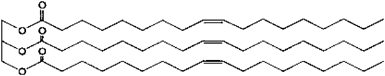
The chemical structures of the seven species of phospholipids detected in the crystalline bovine heart CcO are given in Figure 2. The cis-configuration of the unsaturated bonds shown in the figure except for that of vaccenate and oleate is provisional.
Figure 2.

Chemical structures of phospholipids detected in crystalline bovine heart CcO. The major configuration (cis) for vaccenate and oleate is shown. The cis-configuration is provisionally assigned for the other unsaturated fatty acids.
Triglycerides. An extremely hydrophobic spot was detected in the 2D-TLC pattern (Supplementary data 1). Phosphorous and sugar were not detected in the spot. An extract of the spot gave a proton NMR spectrum, which was superimposable with that of trioleil glycerol, indicating that the spot obtained in the 2D-TLC is a mixture of triglycerides. The MS spectrum of the fraction in the ESI positive ion mode showed seven peaks at m/z 855.74, 879.74, 881.75, 885.79, 905.76, 907.77 and 909.79 (NMR and MS spectra are given in Supplementary data 4). The fatty acid structures and compositions were examined by GC analysis as the methyl esters obtained by solvolysis. Four species of fatty acid methyl esters were identified, as follows: palmitate (C=16:0), stearate (C=18:0), oleate (C=18:1) and linoleate (C=18:2). The fatty acid compositions of the seven triglycerides (TGs) were estimated by the molecular weights of these TGs, as given in Table I. The molar fractions of each of these four methyl esters were determined by a quantitative GC analysis to be 17% palmitate, 12% stearate, 61% oleate and 10% linoleate (Supplementary data 3-2). The fatty acid positions within the glycerol backbone were not determined.
Table 1.
Fatty acid compositions of the seven TGs in bovine heart CcO
| Triacyl glycerol | m/z | Fatty acid composition | |||
|---|---|---|---|---|---|
| Palmitate | Stearate | Oleate | Linoleate | ||
| TG1 | 855.74 | 2 | 1 | ||
| TG2 | 879.74 | 1 | 1 | 1 | |
| TG3 | 881.75 | 1 | 2 | ||
| 1 | 1 | 1 | |||
| TG4 | 885.79 | 1 | 2 | ||
| TG5 | 905.76 | 2 | 1 | ||
| 1 | 2 | ||||
| TG6 | 907.77 | 3 | |||
| 1 | 1 | 1 | |||
| TG7 | 909.79 | 1 | 2 | ||
| 2 | 1 | ||||
| Palmitate: n-hexadecanoate; stearate: n-octadecanoate; oleate: Δ9-octadecenoate; linoleate: Δ9, 12-octadecadienoate. | |||||
| A possible structure of TG6: | |||||
 | |||||
The fatty acid compositions of TG in the bovine heart adipose tissue were also examined and were found to be identical to those of the TG fraction obtained from the crystalline bovine heart CcO. Thus, we examined whether these TGs were contaminated during the purification procedure for the enzyme from the bovine heart muscle by addition of significant amount of unnatural TG (containing fatty acyl groups with odd-numbered carbon chains) to the heart muscle mitochondrial fraction before initiation of the purification procedure (Supplementary data 4). The results indicate that TG contamination arising from adipose tissue during the purification procedure was not detected.
Quantitative analysis of the total fatty acids of bovine heart CcO. The total amount of fatty acyl groups was estimated by extraction of lipids in the presence of an unnatural TG, tripentadecanoic glyceride (15:0), as an internal standard at the level of 2 molecules of TG per one enzyme molecule followed by the solvolysis with methanol. The solvolysate was quantitatively examined by GC using the conditions and correction factors indicated in Supplementary data 3-2 and 3-3. The six determinations provide 30.6 (±3.4) fatty acids per enzyme molecule. Under the present GC conditions, arachidonate is not detectable. Thus, this value represents the amount of fatty acids other than arachidonate.
Phosphorous content of crystalline bovine heart CcO. Phosphorous content was determined for 40 different batches of the crystalline preparation and was found to be 12.9±1.9 phosphorous/mol of the enzyme.
Lipid compositions in the mitochondrial inner membrane and other proton-pumping respiratory complexes
MS spectral analysis of the bovine heart mitochondrial inner membrane fraction indicated that this fraction contained the same seven species of the phospholipids as those identified in bovine heart CcO, although the relative intensities of the peaks are different (Figure 3A). The phospholipid composition of the bovine heart mitochondrial inner membrane determined from the present MS analyses is essentially consistent with the reported results for the major phospholipids (Daum, 1985). Minor constituents, such as phosphatidylinositol, phosphatidylserine and sphingomyelin, were not detected under the present conditions. The intensity ratio of the two major peaks located in close proximity to each other provides a reliable standard for evaluation of a change in the composition. The other proton-pumping respiratory complexes, NADH–ubiquinone reductase, ubiquinol–cytochrome c reductase and Fo F1ATP synthase (known as complexes I, III and V, respectively), also contain only the same seven species of phospholipids, but with variable intensity ratios (spectra are provided in Supplementary data 5). The intensity ratio of the 747.52 peak (PG) to the 766.54 peak (PE) detectable in the ESI negative mode is extremely high in CcO (6.0), relative to 0.7, 0.5, 0.3 and 0.3 for complexes I, III and V and the mitochondrial inner membrane, respectively. The cis/trans ratio of vaccenate in the bovine heart mitochondrial inner membrane was found to be 5/1 (Supplementary data 3-1), which is notably lower than that of the vaccenate in the bovine heart CcO (12.8/1). TG was detectable in the mitochondrial inner membrane, whereas complexes I, III and V did not contain significant amounts of TG. The specificity suggests that specific binding of TG to CcO occurs.
Figure 3.

Mass spectra of lipid extracts from the bovine heart mitochondrial inner membrane (A) and the purified CcO (B) of P. denitrificans. These spectra were obtained under the same conditions described for Figure 1. No signal assignable to phospholipid was detected in the other m/z regions.
The lipid composition of CcO isolated from the soil bacterium P. denitrificans, the ancestor of eukaryotic mitochondria, was determined in order to evaluate the physiological significance of the lipids in CcO. Only two types of PG (C=16:0, 18:1 and C=18:0, 18:2) were detected (Figure 3B). GC analysis for the solvolysate of PG showed that the fatty acid (18:1) is vaccenate and that no significant amounts of trans-vaccenate were observed (data in Supplementary data 3-1).
X-ray structures of lipids in bovine heart CcO
Overall X-ray structures of lipids. The structure of lipids determined by the chemical analyses described above fits well within the electron density map of 1.8 Å resolution X-ray structure. The best-fit atomic model (PDB code 2DYR) shows 2CLs, 1PC, 3PEs, 4PGs and 3TGs (Figure 4A and B). The structures determined by the chemical analyses fit well within the (FO−FC) difference electron density map. The structures of lipids were refined to give reasonable fatty acid tail conformations in which the torsion angles of single bonds in the fatty acid tails consistently adopt the energetically favored staggered conformations. Eclipsed conformations of single bonds within the fatty acid tails are not present in the X-ray structure (Figure 4C). All four species of phospholipids containing choline (two types of PC and two types of CP) identified by the chemical analyses fit equally well within the electron density of the single PC site. The seven TG species are also fit equally well within each of the three TG sites. Four cholates and two decylmaltosides are specifically bound, as shown in Figure 4.
Figure 4.
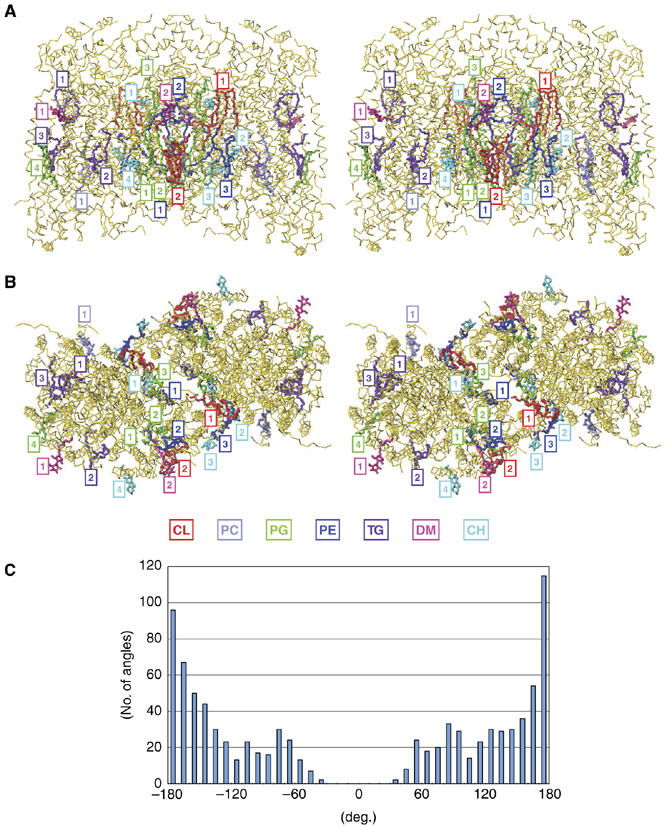
The locations of lipids and detergents in the X-ray structure of bovine heart CcO at 1.8 Å resolution in the oxidized state in side (A) and top (B) stereo-views. CH and DM denote cholate and decylmaltoside, respectively. Association of lipids and detergents with individual monomers is indicated by rectangles. The numbering system for each lipid and detergent species is arbitrary. The Cα-backbone traces are only given for the protein moiety. A histogram indicating the populations of torsion angles of single bonds of the hydrocarbon tails of all lipids in the X-ray structure is given in (C). Two plateau regions near ±120° are detectable in the population. There are no torsion angles less than ±30°.
The X-ray structure of CcO has 33 sites for accepting the hydrophobic tails. This observation is consistent with the quantitative determination of fatty acid tails of 30.6±3.4 under conditions in which the three arachidonate moieties of PE are not detectable. Furthermore, the assignment of the phospholipids to the electron density is fully consistent with the phosphorous content analysis, which indicates the presence of 13 phosphorous atoms including one phosphate of the phosphothreonine as described below and 12 phosphate-derived phosphate head groups. Thus, all lipids detected in the fatty acid tail analyses are identified in the X-ray structure and represent integral lipids that are specifically bound to the protein.
As shown in Figure 4, all of the lipids are generally located roughly within the transmembrane helix region on either the positive side or the negative side. The positive and negative sides denote the sides of CcO facing outside and inside of the mitochondrial inner membrane, respectively. The head groups of the phospholipids and the glycerol backbones of TGs are generally located on either of the planes at both ends of the transmembrane helix region. The two planes are about 30 Å apart (Supplementary data 6). The bilayer-like arrangement has also been identified in the bacterial reaction center (Camara-Artigas et al, 2002) and in the yeast cytochrome bc1 complex (Lange et al, 2001). These observations suggest the existence of a common mechanism for lipid incorporation into the membrane proteins. Three phospholipids and one TG are located within the positive side, whereas the remaining lipids are located within the negative side. PG1, PG2 and PE2 are surrounded by the two helix bundles of subunit III. The remaining lipids contribute to stabilization of the dimeric state and the assemblies of nuclear-coded transmembrane subunits with the three core subunits (subunits I, II and III), which are encoded by mitochondrial genes. The locations of these head groups and the interactions between these lipids and the 13 subunits are schematically summarized in Supplementary data 6. Many hydrophobic interactions were detected including typical CH–π interactions (structural details in Supplementary data 7).
Lipid–protein interactions
Phospholipids in subunit III. The fatty acid tails of the two PGs located within the negative side in subunit III are essentially fully extended, whereas the arachidonyl tail of PE located within the positive side is significantly more folded than the other five fatty acid tails (Figure 5A). The fatty acid tails are fixed tightly by the protein portion, giving clear electron density maps as shown in Figure 5B. The head groups are tightly fixed by many protein-derived hydrogen bonds (Supplementary data 8). The average total numbers of hydrogen bonds and the hydrophobic interactions to the polar and non-polar moieties of the phospholipids are 12.0 and 98.3, respectively, for the three phospholipids in subunit III, and 5.6 and 54.6 for the other phospholipids. The average overall temperature factors for the phospholipids inside and outside subunit III are 40.4 and 83.2 Å2, respectively. The average overall temperature factors for the tail portions inside and outside subunit III are 44.7 and 80.2 Å2, respectively. The average for the head group within subunit III is 26.3 Å2. This value is even lower than that of the surrounding protein portion (Table II). The average for the head groups of phospholipids outside subunit III is 95.3 Å2. As shown in Figure 5A, the fatty acid tails of the three phospholipids in subunit III are located close to each other and form a section of the O2 transfer pathway as described below. The terminal sections of the tails exhibit somewhat higher temperature factors relative to the other sections of the tails. This suggests that the fatty acid tails play a role in controlling the O2 transport process.
Figure 5.

Phospholipids in subunit III. (A) Stereo-view of atomic models of the three phospholipids within subunit III showing amino-acid residues close enough for hydrogen bonding or hydrophobic interactions. Temperature factors of each atom of the phospholipids are also given. The amino acids highlighted in yellow, green and purple denote those that belong to subunits I, III and VIa, respectively. The red structure is a portion of CL2 that interacts with PG2. (B) The (FO−FC) difference electron density in which PG1 are omitted from the FC calculation in stereo-view.
Table 2.
Average temperature factors of lipids of bovine heart CcO
| Head (Å2) | Hydrocarbon tail (Å2) | Overall | |||||
|---|---|---|---|---|---|---|---|
| C1 | C2 | C3 | C4 | Averages (Å2) | Averages (Å2) | ||
| CL1 | 98.1 (4.6) | 83.9 (10.3) | 82.1 (10.0) | 82.1 (9.6) | 86.4 (4.3) | 83.6 (9.1) | 86.5 (10.2) |
| CL2 | 93.5 (7.7) | 92.1 (5.8) | 94.7 (4.6) | 76.4 (2.5) | 67.3 (17.5) | 82.6 (14.8) | 84.8 (14.4) |
| PC1 | 98.0 (5.5) | 65.9 (14.9) | 82.9 (11.2) | 74.8 (15.6) | 81.1 (17.1) | ||
| PE1 | 96.6 (4.8) | 98.4 (2.4) | 65.3 (11.9) | 81.0 (18.7) | 84.3 (17.9) | ||
| PE2a | 27.1 (2.5) | 45.2 (7.1) | 52.6 (14.2) | 49.1 (12.0) | 44.5 (13.9) | ||
| PE3 | 90.0 (14.6) | 66.4 (15.4) | 95.1 (4.6) | 81.4 (18.1) | 83.2 (17.8) | ||
| PG1a | 24.4 (3.0) | 44.6 (7.1) | 42.6 (10.5) | 43.5 (9.1) | 38.7 (11.5) | ||
| PG2a | 27.4 (4.2) | 42.4 (7.5) | 40.7 (14.4) | 41.5 (11.7) | 37.9 (12.0) | ||
| PG3 | 94.3 (6.4) | 76.5 (4.3) | 91.4 (5.0) | 84.3 (8.8) | 86.9 (9.3) | ||
| PG4 | 96.5 (6.8) | 74.0 (8.6) | 62.7 (14.2) | 68.0 (13.2) | 75.3 (17.2) | ||
| TG1 | 62.2 (3.3) | 70.4 (5.1) | 59.8 (8.2) | 63.3 (5.8) | 64.5 (7.9) | 64.4 (7.7) | |
| TG2 | 66.6 (1.6) | 55.0 (13.1) | 61.1 (9.3) | 68.4 (6.6) | 61.5 (11.5) | 61.7 (11.2) | |
| TG3 | 71.1 (3.6) | 56.6 (9.5) | 62.4 (4.4) | 71.1 (3.7) | 63.3 (8.8) | 63.7 (8.7) | |
| Protein | 33.6 (15.6) | ||||||
| aPhospholipids bound to subunit III. | |||||||
The (FO−FC) difference electron density distributions for the fatty acid tails located within subunit III fit well to structures having unsaturated bonds in the cis-configuration. Structural refinement without restraint of a double bond results in convergence of the double bond structures to the cis-configuration. Consequently, the configurations of the double bond sites of the fatty acid tails inside subunit III were determined non-empirically by X-ray structural analyses. On the other hand, the quality of the electron density of the fatty acids located outside subunit III is not sufficient to determine their configurations.
Phospholipids and a phosphorylated transmembrane subunit stabilizing the dimer state. As shown in Figure 4A and B, the enzyme exists in a dimer state within the crystal lattice. Four phospholipids (CL1, PE1, PE3 and PG3) bridge both monomers to stabilize the dimer state. CL1, which interacts with subunits III and VIa within a monomer, bridges the other monomer at subunits I and II. As shown in Figure 6A, the four fatty acid tails interact with amino acids belonging to both monomers. Nineteen carbon atoms of the fatty acid tails of one monomer interact through van der Waals contacts with the amino-acid residues of the same monomer whereas 13 carbon atoms make contacts with the amino-acid residues of the other monomer (Figure 6B). Furthermore, the two phosphate groups interact with both monomers via hydrogen bonds (Figure 6B and Supplementary data 8). The contacts of the remaining three phospholipids of one monomer with the other monomer are much weaker than those of CL1 (Supplementary data 9).
Figure 6.
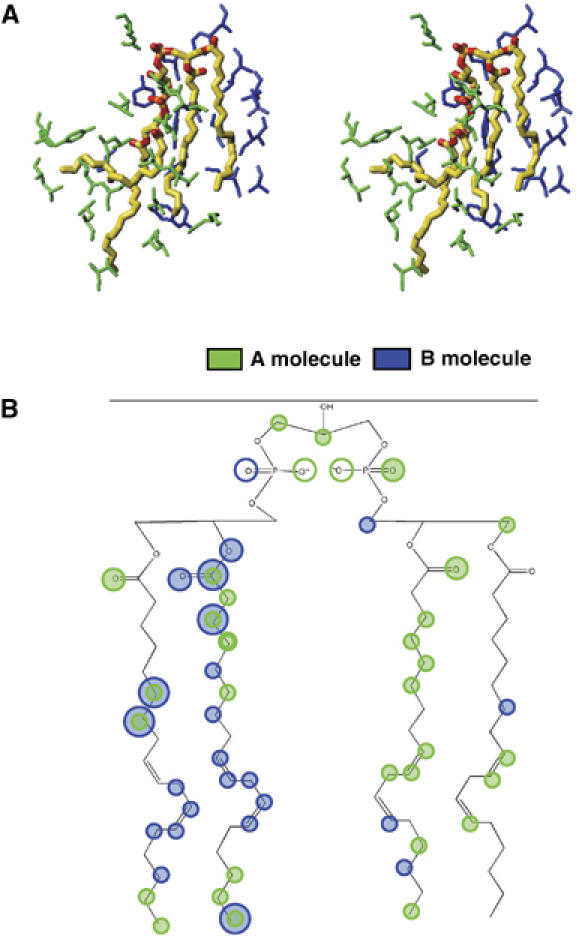
CL1 bridging the two monomers. (A) The atomic model of CL1 in stereo-view. The amino acids of the same monomer (A molecule) as the one to which CL1 belongs and those of the other monomer (B molecule) are shown in green and dark blue, respectively. (B) A schematic representation of the hydrophobic interactions and hydrogen bonding interactions of CL1. The shadowed circles represent sites participating in hydrophobic interactions and the open circles indicate sites participating in hydrogen bonds. The green and dark blue colors denote the different monomers as defined in (A).
One of the nuclear-coded subunits, subunit VIa, contacts the other monomer via about 10 amino acids of its N-terminal portion including phosphorylated threonine (Thr11), which is located at the turning point of the subunit (X-ray structural details in Supplemental data 9). The amino-acid sequence of the N-terminal 12 residues is not well conserved in the bovine liver isozyme of CcO, which does not have a residue equivalent to Thr11.
Flexibility of the hydrophobic tail. The hydrophobic tails of the integral lipids of bovine heart CcO (33 tails in total) adopt various conformations. The superimposed stick models of each of the 13 lipids in stereo-views in Figure 7 demonstrate that the flexibility of these lipids is used for maximum benefit in space-filling function and in stabilization of the subunit assembly.
Figure 7.
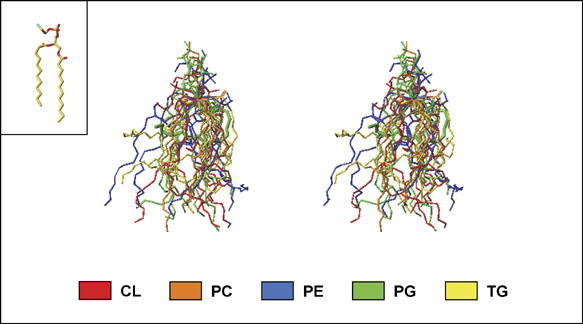
The conformational diversity of the hydrophobic tails of lipids in bovine heart CcO. The stick models of the lipids are superimposed by fixing the C-2 carbon of the glycerol frame and by fitting each glycerol moiety to the X-ray structure of 1,2-dilaurroyl-DL-phosphatidylethanolamine (inset) by the least squares method.
Effect of dicyclohexylurea binding to Glu90 of subunit III
Effect of dicyclohexylcarbodiimide treatment on enzyme activity and absorption spectra. It has been reported that dicyclohexylcarbodiimide (DCCD) forms a dicyclohexyl-N-acyl-urea (DCU) derivative at Glu90, which partially inhibits the electron transfer and proton transfer activities (Casey et al, 1980; Prochaska et al, 1981). The inhibitory effect of DCCD appeared fairly slowly with t1/2 of 80 min. No significant enzyme activity was detected after 11 h incubation with 0.3 mM DCCD (experimental conditions in Supplementary data 10). The complete abolishment of the enzyme activity by DCCD treatment has not been reported thus far. A possible reason for failure to observe complete abolishment is that, in the previous reports, the incubation time of the enzyme preparation with DCCD was limited by the lower stability of the non-crystallized enzyme preparation. No significant effects arising as a result of DCCD treatment under the same conditions described above were observed in the absorption spectra of the enzyme in the oxidized and reduced states (data not shown).
X-ray structural analyses. Glu90 is located within the wall of a potential O2 transfer pathway that passes through the fatty acid tails of PE2 on the positive side and those of PG1 and PG2 on the negative side (Figure 5A). In order to examine the functions of the potential O2 transfer pathway, the conformation of which could be redox controlled, the X-ray structure of the DCU derivative of the enzyme was determined in the oxidized and reduced states at 2.2 and 2.7 Å resolutions, respectively (details of X-ray structural analyses are provided in Supplementary data 10). Redox-coupled conformational changes were not observed in the O2 pathway of the DCU derivative or of the native CcO.
Bound DCU was found at Glu90 of subunit III consistent with the previous labeling experiment (Prochaska et al, 1981). The MR/DM (molecular replacement/density modification method; Supplementary data 10-3) electron density map of the DCU-bound structure shows a continuous electron density from the side chains of Glu90 (Figure 8A). In the native structure, two oxygen atoms in the carboxyl group of Glu90 form hydrogen bonds with the Nɛ atom of the imidazole group of His207 and Tyr241 (Figure 8A). The terminals of the two palmitates at the C-1 position of both PG1 and PG2 are located about 5 Å from the carboxyl group of Glu90. The replacement of the OH group of the Glu90 carboxyl group with DCU does not have an influence on the protein structure except for a small migration of the Cδ-Nɛ moiety of the DCU-Gln90 relative to the COOH group of Glu90. The derivatization of the COOH group with DCU breaks the hydrogen bond to His207, whereas the hydrogen bond to Tyr241 is retained. A water molecule is introduced to form a hydrogen bond between the His207 imidazole group and the hexylamine of the DCU group (Figure 8A). The two cyclohexyl groups induce movement of the fatty acyl terminals toward the channel (Figure 8B). The DCU derivative structure indicates that the two terminal portions of the fatty acyl groups completely occupy the space of the channel near Glu90, as revealed in the molecular surface of the channel through subunit III (Figure 8C). This has the effect of blocking the proposed O2 transfer channel that extends from the surface of subunit III to the O2 reduction site located within subunit I, as shown in the molecular surface of the native enzyme (Figure 8C). The possible function of the pathway in the O2 transfer process has been suggested by X-ray structural and mutational analyses of subunit I (Riistama et al, 1996; Tsukihara et al, 1996).
Figure 8.

X-ray structures of the DCU derivative of bovine heart CcO. (A) The MR/DM electron density maps and the atomic models of the X-ray structure of the native and DCU derivative at Glu90 in stereo-view. The dotted lines denote hydrogen bonds. The red structures represent sections of fatty acid tails. (B) The effect of DCU derivative formation on the conformation of the phospholipids of subunit III. Blue and red structures denote the DCU derivative and native structures, respectively. The red dotted surfaces represent the molecular surfaces of the native structure determined by using a probe radius of 1.1 Å, which determines O2 accessible surface. (C) Effect of DCU derivative formation on the structure of the potential O2 pathway. The definition of the blue dotted surface is described in (B). Cross-sections of CcO parallel to the membrane surface at the level of heme a3 iron and CuB denoted by cyan balls are shown in the native and DCU derivative forms. Cα-backbone structures of subunits I (yellow) and III (green) are depicted as thin sticks. A possible O2 movement in the pathway is shown by a block dotted line. The connection of the two pathways in subunits I and III is clearly seen in the native form. PG1 and PG2 in subunit III are shown in pink and magenta, respectively.
Discussion
Determination of lipid structures
As described above, the chemical structures of the phospholipids of bovine CcO including the head group structures, the chain lengths and unsaturated bond locations of the long-chain ester (or vinylic ether) groups and the positions of the long-chain groups in the glycerol backbone were determined by MS analyses and phospholipase A2 treatment. The cis/trans configurations of the unsaturated bonds were determined by GC analyses. However, X-ray structure data were required for determination of the number of phospholipids contained in each CcO molecule owing to insufficient accuracy of fractionation of the phospholipids extracted from the enzyme. The presence of three TGs was proven by the following results: CcO contains 33 fatty acyl tails (including three arachidonates) and 12 phosphate groups of phospholipids including 24 fatty acyl groups. The presence of three TGs was confirmed by examination of the X-ray structure.
The present determination of lipids as summarized above shows that X-ray structural analysis is a unique tool for quantitative analysis of lipids, as X-ray structural analysis is the only reliable method to determine the structures of lipids in the protein-bound state without extraction. For application of other analytical methods, the lipid must be extracted from the protein. Membrane proteins are most effectively purified by crystallization, giving, as in the present case, a highly consistent composition and reproducible characteristics, which are necessary for accurate structural analyses.
The lipid assignments for the 2.8 Å resolution structure without chemical analysis data for lipids have been significantly revised as described in Supplementary data 11.
Lipid–protein interactions determining the lipid binding specificity
Each of the three phospholipids (PE, PG and CL) isolated from crystalline bovine heart CcO has a single pair of fatty acyl groups at the C-1 and C-2 positions. The mitochondrial inner membrane, which is the phospholipids pool for CcO, contains only these species of phospholipids detected in CcO. On the other hand, this enzyme has only one site for choline-containing phospholipids (PC and CP). This site accepts the four different hydrophobic tail pairs (two pairs of PC and two pairs of CP). These observations indicate that the phospholipid binding specificity is determined by the head group at the C-3 position and not by the hydrophobic tails.
The ratio of cis/trans-vaccenate of bovine CcO (12.8:1) is significantly higher than that of the mitochondrial inner membrane (5:1). The results are consistent with the observation of the cis-configuration of the vaccenate in subunit III determined by X-ray structural analyses as described above, as CcO contains two PGs within subunit III and two PGs outside of subunit III. The electron densities of the unsaturated bonds of the vaccenates in subunit III are sufficiently clear to exclude the possibility of existence of the trans-configuration. Thus, the protein moiety of subunit III selects the fatty acid tail structure. It should be noted that X-ray structural analysis is the only method capable of determining cis/trans configuration of a fatty acid tail within the protein.
These results suggest that there are two types of interactions of hydrophobic tails of integral lipids with proteins, one specific enough for detection of the hydrophobic tail structures and the other that is insensitive for identification of the tail structures.
The seven TG species detectable in the mitochondrial inner membrane were identified from the TG fraction isolated from CcO with only three TG sites. Thus, the TG sites do not have absolute specificity for the fatty acid tail structure. The lack of a suitable binding site for the phospholipid head groups prevents the phospholipids from binding to the TG site. As a result, the fatty acyl group of the glycerol backbone corresponding to the C-3 site of phospholipids (either one of the carbons at both ends of the glycerol moiety of TG) determines the TG binding. Most of the fatty acyl tails of TG have significantly larger numbers of the hydrophobic interaction pairs relative to those of the phospholipids located outside of subunit III. This suggests that TGs effectively stabilize the subunit assembly in CcO as intrinsic constituents.
Physiological relevance of the lipid–protein interactions
The present X-ray structural analysis suggests that the dimer state of the bovine CcO is primarily stabilized by CL1 and subunit VIa. Support for this proposed role of CL1 and subunit VI is provided by the structure of P. denitrificans CcO, which is in the monomeric state and contains neither CL nor a subunit corresponding to the bovine subunit VIa (Harrenga and Michel, 1999). In the crystalline state, the bovine heart CcO exists as a dimer. However, if the monomeric state is stable enough within the mitochondrial inner membrane, a dimer/monomer equilibrium will be introduced. The N-terminal sequence of subunit VIa, which interacts with the other monomer in bovine heart CcO, is not conserved in the liver isozyme of CcO, which lacks a residue equivalent to the phosphorylated Thr11 of bovine CcO. The phosphate group of Thr11 is expected to stabilize the U-shaped conformation of the N-terminal region of bovine CcO. Thus, the diversity of subunit VIa sequences among different CcOs could have an influence on the stability of the dimer states among the different CcOs.
The X-ray structure of the DCCD-treated enzyme strongly suggests that the specific role of the hydrophobic fatty acid tails is regulation of the O2 transfer. As stated above, the DCU binding to Glu90 does not induce any significant conformational changes of the protein moiety (Figure 8A). The steric blockage of the channel is caused by the migration of the two palmitate tail ends of PG1 and PG2 from the wall of the channel to the channel space. This migration is driven by the DCU group, but the DCU group does not directly contribute to the blockage of the O2 path. This result indicates that a conformation of the palmitate tail ends (similar to that observed in the DCU derivative) can be induced by O2 molecules externally introduced through the pathway or by long-range interactions from the redox active metal sites. Such a conformational change, even if it occurs transiently under turnover conditions, would control the O2 supply to the O2 reduction site.
For evaluation of the role of the palmitate tail of PG1 participating in the O2 transfer pathway, a hypothetical structure where the palmitate (C=16:0) of PG1 was replaced by stearate (C=18:0) was predicted by an energy minimization analysis using X-PLOR under constraints of protein and lipid structures except for PG1, PG2 and PE2 within subunit III. The predicted structure (Figure 9) indicates that the stearate tail blocks the O2 pathway without influencing the conformations of PG2 and PE2. This simulation analysis confirms the critical requirement of the palmitate for the O2 transfer process (Figure 9). Thus, the protein moiety must select the PG for proper placement of the palmitate.
Figure 9.

Effect of chain elongation of palmitates of PG1 on the O2 transfer pathway. The blue dots denote the molecular surface calculated using a probe radius of 1.1 Å. (A) A cross-section of the native CcO at the level of heme a3 iron and CuB. (B) A close-up of the O2 transfer pathway near the subunit I/III interface. (C) Molecular surface calculated for the structure with a stearate substituted for the palmitate of PG1. Blockage of the O2 pathway is obvious. The conformation of the stearate was simulated by X-PLOR.
This structural finding is consistent with the suicide inhibition (Gilderson et al, 2003). The enzyme activity of the subunit III-depleted CcO preparation decreases down to 50% of the initial activity within 1–2 min during the steady-state enzyme turnover. The suicide inhibition is accompanied by increased flexibility (or damage) in the structure of the O2 reduction site, which results in a partial loss of CuB (Gilderson et al, 2003). It is possible that the uncontrolled O2 supply available during the turnover of the subunit III-depleted enzyme would produce reactive oxygen species, which would damage the protein structure.
Evolutionary aspects of phospholipids structures
The MS spectrum of the lipid fraction of CcO isolated from a soil bacterium, P. denitrificans, shows only two types of PGs (Figure 3), although the presence of PE, PC and CL in addition to PG in the whole cells has been reported (Thiele et al, 1980). The absence of phospholipids other than PG is consistent with the structure of the bacterial CcO, which is in the monomeric state and which lacks subunits corresponding to the nuclear-coded subunits of the bovine heart CcO (Harrenga and Michel, 1999). The X-ray structure of bovine heart CcO (Supplementary data 6) shows that with the exception of the integral lipids of subunit III, the lipids contribute to the stabilization of the dimer state and the assembly between the three core subunits and the 10 nuclear-coded subunits.
One of PGs in subunit III of the bacterial enzyme is replaced by PE2 in bovine CcO. The structure of one of the two species of PGs in the bacterial enzyme is identical to the PG of the bovine enzyme. That is, the PG that contains palmitate and vaccenate (Δ11-octadecenoate) is conserved in spite of a large abundance of a closely related fatty acid, oleate (Δ9-octadecenoate), in bovine heart mitochondria. This suggests that there is a critical requirement for the vaccenate group.
The PG/PE ratios estimated by MS analyses for proton-pumping complexes I, III and V in the mitochondrial respiratory system are much lower than the PE/PG ratio of CcO. If the PE content of these complexes is at the same level as that of CcO, the intensity ratios suggest that the PG content of these complexes is at a level of less than one molecule. Thus, the PG in these complexes could be due to PG in the contaminant CcO in the purified preparation. It is possible to conclude that the majority of PG molecules are bound to CcO. On the other hand, the core subunits of bovine CcO, which contain all of the functional sites, are encoded by mitochondrial genes, whereas most of core subunit genes of the other proton-pumping complexes in mitochondria have been transferred to the nucleus. These two facts indicate the existence of a positive correlation between PG content and retention of mitochondrial genes.
Materials and methods
Purified membrane proteins were obtained by the methods reported previously (Kubota et al, 1991; Tsukihara et al, 1995; Buchanan and Walker, 1996; Nakashima et al, 2002). All the reagents were of the highest grade available commercially.
Lipids were extracted with an extraction medium composed of chloroform, methanol and 28% ammonium hydroxide in a volume ratio of 65/33/2. The extraction medium was then washed with 40 mM HEPES–Na buffer, pH 7.8, and evaporated by flushing with N2. The residual extract was dissolved in a minimal volume of chloroform. The efficiency of the phospholipid extraction was found to be higher than 95% for the CcO sample at sufficiently low protein concentration by comparison of the phosphorous content of the protein sample with the extract.
For structural determination of fatty acyl chains by MS spectrometry, limited digestion of phospholipid by phospholipase A2 (Sigma, Naja mossambica mossambica) was performed to cleave the acyl group at C-2. The fatty acid released from the phospholipid by the phospholipase was separated by TLC developed with a solution of chloroform:methanol:water at a ratio of 75:22:3. Solvolysis of fatty acyl groups of the lipids was performed with methanol and K2CO3 at 50–60°C for 1 day to provide fatty acid methyl esters.
A high-resolution double-focused mass spectrometer (JEOL, HX110) was used for MS-MS analysis of the fatty acids and separated phospholipids. The other MS measurements were performed on the lipids in methanol solution with an ESI-TOF mass spectrometer (AccuTOF, JEOL, JMS-T100LC). The machine accuracy of the latter model for the m/z value is less than 5 p.p.m. The model is designed for quantitative analysis with the Continuous Averager.
Gas chromatographic (GC) analyses and NMR measurements were performed with a SHIMADZU GC-17A with a SHIMADZU C-R74 including a capillary column (TC-1, 30 m, i.d. 0.25 mm, 250°C, 30 cm/s) plus CHROMATOPAC for GC data analyses and ECA-600 NMR (JEOL) spectrometer, respectively. Methods for X-ray structural analyses of the DCU derivative of bovine heart CcO are essentially the same as described before for native CcO (Tsukihara et al, 2003) and given in Supplementary data 10. Refined atomic coordinates of 13 subunits, phospholipids and water molecules contained in the inside of the enzyme were used to calculate the molecular surface of the enzyme by the program MS (Connolly, 1983).
Methods for isolation of mitochondrial inner membrane fractions from bovine heart muscle, determination of phosphorous and sugar contents in fractionated lipid samples and analysis of the inhibitory effect of DCCD on CcO activity are given in Supplementary data 12.
Supplementary Material
Supplementary data 1
Supplementary data 2
Supplementary data 3
Supplementary data 4
Supplementary data 5
Acknowledgments
This work was supported in part by Grant-in-aid for scientific research on priority areas, for 21st Century Center of Excellence Program from the ministry of education, Culture, Sports, Science and Technology, Japan (to KS-I, TT and SY) and for Strategic Japan-UK Cooperative Program from Japan Science and Technology Agency (to TT). SY is a Senior Visiting Scientist in RIKEN Harima Institute.
References
- Belrhali H, Nollert P, Royant A, Menzel C, Rosenbusch JP, Landau EM, Pebay-Peyroula E (1999) Protein, lipid and water organization in bacteriorhodopsin crystals: a molecular view of the purple membrane at 1.9 Å resolution. Structure 7: 909–917 [DOI] [PubMed] [Google Scholar]
- Buchanan SK, Walker JE (1996) Large-scale chromatographic purification of F1Fo-ATPase and complex I from bovine heart mitochondria. Biochem J 318: 343–349 [DOI] [PMC free article] [PubMed] [Google Scholar]
- Camara-Artigas A, Brune D, Allen JP (2002) Interactions between lipids and bacterial reaction centers determined by protein crystallography. Proc Natl Acad Sci USA 99: 11055–11060 [DOI] [PMC free article] [PubMed] [Google Scholar]
- Casey RA, Thelen M, Azzi A (1980) Dicyclohexylcarbodiimide binds specifically and covalently to cytochrome c oxidase while inhibiting its H+-translocating activity. J Biol Chem 255: 3994–4000 [PubMed] [Google Scholar]
- Corcelli A, Colella M, Mascolo G, Fanizzi FP, Kates M (2000) A novel glycolipid and phospholipid in the purple membrane. Biochemistry 39: 3318–3326 [DOI] [PubMed] [Google Scholar]
- Connolly ML (1983) Solvent-accessible surfaces of proteins and nucleic acids. Science 221: 709–713 [DOI] [PubMed] [Google Scholar]
- Daum G (1985) Lipids of mitochondria. Biochim Biophys Acta 822: 1–42 [DOI] [PubMed] [Google Scholar]
- Gilderson G, Salomonsson L, Aagaard A, Gray J, Brzezinski P, Hosler J (2003) Subunit III of cytochrome c oxidase of Rhodobacter sphaeroides is required to maintain rapid proton uptake through the D pathway at physiologic pH. Biochemistry 42: 7400–7409 [DOI] [PubMed] [Google Scholar]
- Lange C, Nett HJ, Trumpower BL, Hunte C (2001) Specific roles of protein–phospholipid interactions in the yeast cytochrome bc1 complex structure. EMBO J 20: 6591–6600 [DOI] [PMC free article] [PubMed] [Google Scholar]
- Harrenga A, Michel H (1999) The cytochrome c oxidase from Paracoccus denitrificans does not change the metal center ligation upon reduction. J Biol Chem 274: 33296–33299 [DOI] [PubMed] [Google Scholar]
- Kubota T, Kawamoto M, Fukuyama K, Shinzawa-Itoh K, Yoshikawa S, Matsubara H (1991) Crystallization and preliminary X-ray crystallographic studies of bovine heart mitochondrial cytochrome bc1 complex. J Mol Biol 221: 379–382 [DOI] [PubMed] [Google Scholar]
- Marsh D, Pali T (2006) Lipid conformation in crystalline bilayers and in crystals of transmembrane proteins. Chem Phys Lipids 141: 48–65 [DOI] [PubMed] [Google Scholar]
- McAuley KE, Fyfe PK, Ridge JP, Isaacs NW, Cogdell RJ, Jones MR (1999) Structural details of an interaction between cardiolipin and an integral membrane protein. Proc Natl Acad Sci USA 96: 14706–14711 [DOI] [PMC free article] [PubMed] [Google Scholar]
- Nakashima Y, Shinzawa-Itoh K, Watanabe K, Naoki K, Hano N, Yoshikawa S (2002) Steady state kinetics of NADH:coenzyme Q oxidoreductase isolated from bovine heart mitochondria. J Bioener Biomembr 34: 11–19 [DOI] [PubMed] [Google Scholar]
- Prochaska LJ, Bisson R, Capaldi RA, Steffens GCM, Buse G (1981) Inhibition of cytochrome c oxidase function by dicyclohexylcarbodiimide. Biochim Biophys Acta 637: 360–373 [DOI] [PubMed] [Google Scholar]
- Riistama S, Puustinen A, García-Horsman A, Iwata S, Michel H, Wikström M (1996) Channelling of dioxygen into the respiratory enzyme. Biochim Biophys Acta 1275: 1–4 [DOI] [PubMed] [Google Scholar]
- Sedlák E, Panda M, Dale MP, Weintraub ST, Robinson NC (2006) Photolabeling of cardiolipin binding subunits within bovine heart cytochrome c oxidase. Biochemistry 45: 746–754 [DOI] [PMC free article] [PubMed] [Google Scholar]
- Svensson-Ek M, Abramson J, Larsson G, Törnroth S, Brzezinski P, Iwata S (2002) The X-ray crystal structures of wild-type and EQ(I-286) mutant cytochrome c oxidases from Rhodobacter sphaeroides. J Mol Biol 321: 329–339 [DOI] [PubMed] [Google Scholar]
- Thiele OW, Biswas CJ, Hunneman DH (1980) Isolation and characterization of an ornitine-containing lipid from Paracoccus denitrificans. Eur J Biochem 105: 267–274 [DOI] [PubMed] [Google Scholar]
- Tsukihara T, Aoyama H, Yamashita E, Tomizaki T, Yamaguchi H, Shinzawa-Itoh K, Nakashima R, Yaono R, Yoshikawa S (1995) Structures of metal sites of oxidized bovine heart cytochrome c oxidase at 2.8 Å. Science 269: 1069–1074 [DOI] [PubMed] [Google Scholar]
- Tsukihara T, Aoyama H, Yamashita E, Tomizaki T, Yamaguchi H, Shinzawa-Itoh K, Nakashima R, Yaono R, Yoshikawa S (1996) The whole structure of the 13-subunit oxidized cytochrome c oxidase at 2.8 Å. Science 272: 1136–1144 [DOI] [PubMed] [Google Scholar]
- Tsukihara T, Shimokata K, Katayama Y, Shimada H, Muramoto K, Aoyama H, Mochizuki M, Shinzawa-Itoh K, Yamashita E, Yao M, Ishimura Y, Yoshikawa S (2003) The low-spin heme of cytochrome c oxidase as the driving element of the proton-pumping process. Proc Natl Acad Sci USA 100: 15304–15309 [DOI] [PMC free article] [PubMed] [Google Scholar]
Associated Data
This section collects any data citations, data availability statements, or supplementary materials included in this article.
Supplementary Materials
Supplementary data 1
Supplementary data 2
Supplementary data 3
Supplementary data 4
Supplementary data 5