

Abstract
Little is known about the higher-order structure of prespliceosomal A complexes, in which pairing of the pre-mRNA's splice sites occurs. Here, human A complexes were isolated under physiological conditions by double-affinity selection. Purified complexes contained stoichiometric amounts of U1, U2 and pre-mRNA, and crosslinking studies indicated that these form concomitant base pairing interactions with one another. A complexes contained nearly all U1 and U2 proteins plus ∼50 non-snRNP proteins. Unexpectedly, proteins of the hPrp19/CDC5 complex were also detected, even when A complexes were formed in the absence of U4/U6 snRNPs, demonstrating that they associate independent of the tri-snRNP. Double-affinity purification yielded structurally homogeneous A complexes as evidenced by electron microscopy, and allowed for the first time the generation of a three-dimensional structure. A complexes possess an asymmetric shape (∼260 × 200 × 195 Å) and contain a main body with various protruding elements, including a head-like domain and foot-like protrusions. Complexes isolated here are well suited for in vitro assembly studies to determine factor requirements for the A to B complex transition.
Keywords: electron microscopy, mass spectrometry, pre-mRNA splicing, Prp19/CDC5, spliceosomal A complex
Introduction
Pre-mRNA splicing is catalyzed by the spliceosome, which consists of the U1, U2, U4/U6 and U5 snRNPs, and numerous splicing factors (Will and Lührmann, 2006). Spliceosome assembly proceeds sequentially with many intermediate stages, the most stable of which (i.e. the E, A, B and C complexes) can be detected biochemically (Will and Lührmann, 2006). Initially, the U1 snRNP interacts with the 5′ splice site, forming the E complex. In this complex, the U1 snRNA base pairs with the 5′ splice site. The U2 snRNP is also present but not stably bound at this stage (Das et al, 2000). Subsequently, the U2 snRNA base pairs with the branch point sequence (BPS), leading to its stable integration and A complex (also denoted the prespliceosome) formation. During these early assembly stages, contacts between spliceosomal components and the pre-mRNA play an important role in splice site recognition and pairing. Indeed, commitment to a given pair of 5′ and 3′ splice sites occurs at the time of A complex formation (Lim and Hertel, 2004). Thus, regulation of alternative splicing often occurs by modulating interactions within these early spliceosome assembly intermediates.
The preformed 25S U4/U6.U5 tri-snRNP is recruited subsequent to the A complex to form the precatalytic B complex. Activation of the spliceosome entails major RNA–RNA rearrangements, resulting in the displacement of the U1 and U4 snRNPs and formation of U2/U6 and U6/pre-mRNA base pairing interactions. The activated B* spliceosome catalyzes the first step of splicing, generating the C complex. After the second step, the spliced mRNA is released and the postspliceosomal complex, containing the excised intron and the U2, U5 and U6 snRNPs, is disassembled.
The spliceosome is highly dynamic, undergoing multiple compositional and structural rearrangements during each splicing cycle. Whereas remodeling events involving the snRNAs are well characterized (Nilsen, 1998), our current understanding of the dynamics of the spliceosome's proteome is far from complete. Mass spectrometry (MS) of a mixture of spliceosomal complexes revealed that the spliceosome's protein complement is highly complex, consisting of over 200 proteins (Rappsilber et al, 2002; Zhou et al, 2002). More than 50 proteins are recruited to the spliceosome as stable snRNP components, whereas the remaining are non-snRNP-associated (Will and Lührmann, 2006). Many proteins are known to act transiently with the spliceosome, and proteomic analyses of distinct spliceosomal complexes have provided insights into the specific timing of protein recruitment and release during spliceosome assembly and function. However, meaningful comparisons have been hampered, in part owing to different conditions used to isolate these complexes. For example, heparin, which strips away loosely associated proteins, was used to purify BΔU1 (Makarova et al, 2004), activated B* (Makarova et al, 2004) and C complexes (Jurica et al, 2002), whereas A and B complexes were isolated under more native conditions (Hartmuth et al, 2002; Deckert et al, 2006). Human A complexes previously purified by tobramycin affinity selection contained both H complexes and low levels of the B complex (Hartmuth et al, 2002), and they were structurally heterogeneous under the electron microscope (H Stark, K Hartmuth, H-P Vornlocher, B Kastner and R Lührmann, unpublished observations). Thus, they were not suitable for functional studies (e.g. investigating the A to B transition with purified components) or for the determination of their three-dimensional (3D) structure by electron microscopy (EM).
Prp19 and several proteins associated with it play a key role in the catalytic activation of the spliceosome both in humans and yeast (Tarn et al, 1993; Chan et al, 2003; Makarova et al, 2004). In humans, a stable 14S hPrp19/CDC5 complex additionally consisting of SPF27, PRL1, CCAP1/hsp73, CCAP2/AD002 and catenin β-like 1 can be isolated from HeLa nuclear extract (Ajuh et al, 2000; Makarova et al, 2004). In the yeast Saccharomyces cerevisiae, Prp19p and Cef1p (the homolog of CDC5) are also present in a heteromeric complex, the NTC (nineteen complex), together with Snt309p (human SPF27), Syf1p, Clf1p, Isy1p, NTC40 and NTC20 (Tarn et al, 1994; Tsai et al, 1999; Chen et al, 2002). Initially, the NTC complex was thought to first associate after B complex formation, but recent studies suggest that several NTC components are recruited at earlier stages of spliceosome assembly (Chung et al, 1999; Wang et al, 2003; Tardiff and Rosbash, 2006). Likewise, MS of purified human B complexes recently revealed that all components of the hPrp19/CDC5 complex plus 10 Prp19-related proteins are present before spliceosome activation (Deckert et al, 2006). Furthermore, addition of either CDC5 deletion mutants or peptides derived from the self-interaction domain of hPrp19 inhibits the formation of and/or destabilizes A complexes in nuclear extract (Ajuh et al, 2001; Grillari et al, 2005). Collectively, these data suggest that the hPrp19/CDC5 complex is recruited at an early stage of spliceosome assembly.
The complexity and dynamic nature of the spliceosome create challenges for determining its 3D structure. Nonetheless, 3D structures at a resolution of 30–40 Å could be obtained for the BΔU1 and C complexes by performing single-particle EM (Boehringer et al, 2004; Jurica et al, 2004). The 3D structure of a subunit of the so-called supraspliceosome was also determined (Azubel et al, 2004). In contrast, relatively little is known about the higher-order structure of the spliceosome at the early stages of its assembly.
To obtain more structurally homogeneous A complexes suitable for EM and functional studies, we employed a novel two-step selection method that coupled tobramycin affinity selection with immunoaffinity purification. Using this method, highly pure A complexes were obtained. MS and immunoblotting analyses revealed that A complexes contained proteins of the hPrp19/CDC5 complex, indicating that the latter can interact before the U4/U6.U5 tri-snRNP. Single-particle EM revealed that double affinity-purified A complexes were more homogeneous than previously isolated complexes and led to the first 3D map of these early spliceosomal complexes. These studies provide much needed information about the 3D structure of the spliceosome at an early stage of its assembly and new insights into the dynamics of spliceosomal protein recruitment and release.
Results
Double affinity selection of human spliceosomal A complexes
To purify structurally homogeneous, functional A complexes, we performed tobramycin affinity selection after 45 min of splicing, followed by immunoaffinity purification with antibodies against the U2-associated SF3a66 protein (Behzadnia et al, 2006). Purification with anti-SF3a66 antibodies should lead to a reduction in the amount of H complexes copurifying with the A complex, as the former do not contain U2 snRNPs. Under these conditions, predominantly A, and also some B complex, but no later spliceosomal complexes, are formed (data not shown; Deckert et al, 2006). Double affinity-selected complexes were separated by density gradient sedimentation (Figure 1). Gradient fractions 9–12 contained stoichiometric amounts of pre-mRNA and U1 and U2 snRNA, but no other snRNAs, suggesting that they contain highly pure A complexes. U4, U5 and U6 snRNAs were first detected in fraction 13 and peaked in fractions 15 and 16. Importantly, spliceosomal A complexes in fractions 9–12 could be chased into mature spliceosomes that catalyzed both steps of splicing when incubated in extract depleted of U2 snRNPs (Behzadnia et al, 2006).
Figure 1.
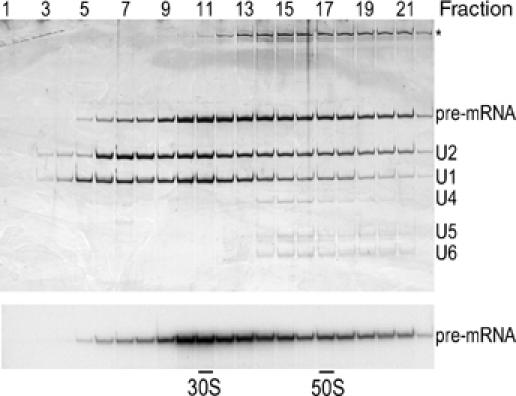
Characterization of double affinity-purified spliceosomal A complexes. Complexes were purified by a combination of tobramycin and anti-SF3a66 affinity selection, and fractionated on a glycerol gradient. RNA was isolated from the indicated fractions, analyzed by denaturing PAGE and visualized by silver staining (upper panel) or autoradiography (lower panel). RNA identities are indicated on the right. Contaminating high-molecular-weight RNA (most likely rRNA from the 40S subunit) is indicated by an asterisk. 30S and 50S correspond to migration positions of Escherichia coli ribosomal subunits in parallel gradients.
Characterization of RNA–RNA interactions by psoralen crosslinking
Base pairing between U2 and the BPS occurs first in the A complex. Thus, to characterize our purified complexes in more detail, we performed RNA–RNA crosslinking. Gradient fractions were UV irradiated in the presence of psoralen and RNA was analyzed by Northern blotting, sequentially probing for U2, U1 and the pre-mRNA (Figure 2). A low level of 32P-labeled pre-mRNA (present in the purified complexes) was observed in the absence of hybridization; however, crosslinked pre-mRNA species were not observed before hybridization with the 32P-labeled probe, even after exposing for a time period longer than that used to detect U1 and U2 crosslinks (data not shown).
Figure 2.
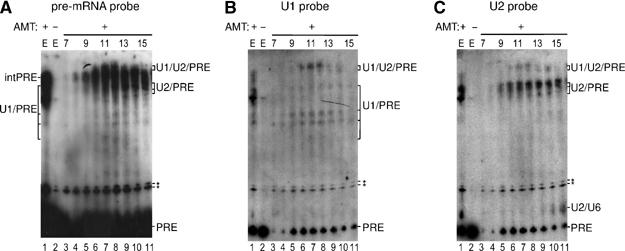
Identification of RNA–RNA interactions in double affinity-purified spliceosomal complexes. Gradient fractions 7–15 containing double affinity-purified complexes or 0.5% of the unfractionated tobramycin eluate (E) were UV irradiated in the presence (+; lanes 1 and 3–12) or absence (−; lane 2) of psoralen (AMT); note that the input of the gradient fractionated material, that is, the anti-SF3a66 eluate, is not shown. Recovered RNA was separated by denaturing PAGE and transferred to a nylon membrane that was hybridized sequentially with 32P-labeled probes against the U2 snRNA (C), U1 (B) or pre-mRNA (A). A low level of 32P-labeled pre-mRNA (present in the purified complexes) is detected in panels B and C, but crosslinked pre-mRNA species were not observed before Northern blotting. The identity of the crosslinked species is indicated on the right, where ‘PRE' indicates pre-mRNA and ‘intPRE' internally crosslinked pre-mRNA. Asterisks: the identity of this double band is unknown.
When the tobramycin eluate or gradient fractions were irradiated in the presence of psoralen, several slower migrating bands could be detected (Figure 2A–C). Some of these were also observed with crosslinked, naked pre-mRNA (data not shown), and were detected solely with the pre-mRNA probe; thus, they represent internal pre-mRNA crosslinks (Figure 2A, intPRE). Northern blotting also revealed multiple U1 snRNA-containing crosslinks in fractions 8–15 (Figure 2B, lanes 4–11) that additionally contained pre-mRNA (Figure 2A), demonstrating they are U1/pre-mRNA crosslinks (U1/PRE). Similarly, U2/pre-mRNA crosslinks (U2/PRE) were detected in fractions 9–15 (Figure 2A and C, lanes 5–11).
Interestingly, two bands containing pre-mRNA, U1 and U2 were observed directly above the internal pre-mRNA crosslinks (Figure 2A–C, lanes 6–10), suggesting the formation of U1/U2/pre-mRNA triple crosslinks. To confirm that these are indeed triple crosslinks, total RNA was recovered from fractions 10–12 after psoralen crosslinking and RNase H cleavage was performed with oligonucleotides directed against the pre-mRNA, U1 or U2 followed by Northern blotting (Figure 3A–C); note that in this experiment, electrophoresis was performed for a longer period of time in order to better separate the two putative U1/U2/PRE crosslinks. Approximately 95% of pre-mRNA, 80% of U1 and 70% of U2 were generally cleaved by RNase H with the respective oligonucleotide and each specifically cleaved its respective RNA. Both bands designated U1/U2/PRE were no longer detected by any of the probes used for Northern blotting after digestion with the pre-mRNA oligonucleotide (Figure 3, cf lanes 1 and 2 in panels A–C), indicating that pre-mRNA is present in all of the crosslinked species and that it is crosslinked to either U1 or U2 alone and/or both simultaneously. Upon cleavage with the anti-U1 oligonucleotide, the vast majority of both U1/U2/PRE bands were no longer detected by the U1 probe (Figure 3B, cf lanes 1 and 3), consistent with the 80% U1 cleavage efficiency of this oligo. Significantly, the majority of the pre-mRNA- and U2-containing species were also cleaved, as revealed by Northern blotting with these probes (Figure 3A and C, cf lanes 1 and 3). A similar result was observed when RNase H cleavage was performed with the anti-U2 oligonucelotide (Figure 3A–C, cf lanes 1 and 4). This demonstrates that the majority of RNA species present in the bands designated U1/U2/PRE are indeed triple crosslinks containing all three RNAs. A larger percentage of the U1-containing crosslinks remained after U2 digestion than the U2-containing species, and vice versa. Thus, the bands designated U1/U2/PRE likely also contain some pre-mRNA that is crosslinked both internally and to either U1 or U2 alone. Thus, fractions 10–12 contain complexes in which there are concomitant base pairing interactions between the pre-mRNA and U1, and the pre-mRNA and U2, demonstrating the presence of A complexes. A crosslink containing U2 and, based on its migration behavior, also U6 was first detected in fraction 13 and increased in intensity in the following fractions (Figure 2C, lanes 9–11); this U2/U6 crosslink is indicative of the B complex (and also later spliceosomal complexes). Taken together, these results indicate that fractions 9–12 contain A complexes and are devoid of B complexes.
Figure 3.
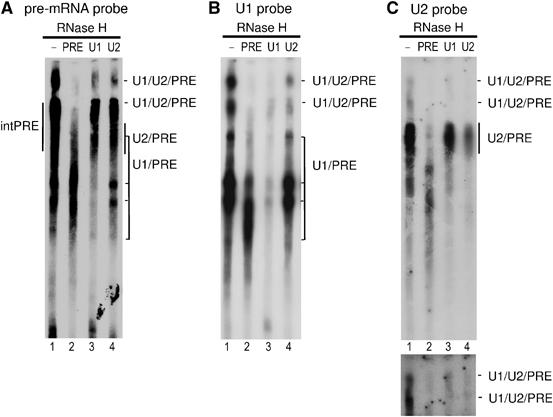
Characterization of crosslinks by RNase H digestion. (A–C) Pooled gradient fractions 10–12 were UV irradiated in the presence of psoralen. Recovered RNA was incubated with RNase H in the absence (lane 1) or presence of DNA oligonucleotides against the pre-mRNA (lane 2), U1 (lane 3) or U2 snRNA (lane 4) and then analyzed by Northern blotting as described in Figure 2. A longer exposure of the upper portion of the gel is shown below in panel C. Additional minor crosslinks are discussed in the text.
The protein composition of spliceosomal A complexes
Proteins from pooled gradient fractions 9 and 10 or 11 and 12 were recovered, separated by SDS–PAGE and identified by liquid chromatography ESI tandem mass spectrometry (LC-ESI-MSMS). Consistent with their snRNA composition, nearly all U1 and U2 snRNP proteins (except U1-C, which is difficult to detect by MS and SF3b10) were found in fractions 9 and 10 (Table I). In contrast, no U4/U6 or U5 proteins were detected, confirming the higher purity of A complexes prepared here, as compared with one-step affinity-purified A complexes (Hartmuth et al, 2002), in which numerous tri-snRNP proteins were detected (Table I). Approximately 50 non-snRNP proteins were also found, many of which were detected in one-step affinity-purified A complexes (Table I). However, several were not previously found (e.g. SF1, FBP11, S164 and TCERG1), most of which have documented links to pre-mRNA splicing, consistent with their presence in spliceosomal complexes. Additional non-snRNP proteins not previously found in purified A complexes (see Table I) have no known function in splicing, but were identified in other spliceosome preparations (Rappsilber et al, 2002; Zhou et al, 2002; Deckert et al, 2006). The remaining non-snRNP proteins identified (Sec31-like2 and p30 DBC) have no apparent link to splicing and thus likely are contaminants.
Table 1.
Protein composition of double affinity-purified human A complexes
| Mol mass (kDa) | GenBank accession no. | No. 9+10 | No. 11+12 | A complex (Hartmuth et al) | S. cerevisiae gene | S. pombe gene | |
|---|---|---|---|---|---|---|---|
| Sm proteins | |||||||
| B | 24.6 | gi∣4507125 | 15 | 20 | · | SMB1 | smb1 |
| D1 | 13.3 | gi∣5902102 | 1 | 7 | · | SMD1 | smd1 |
| D2 | 13.5 | gi∣29294624 | 26 | 32 | · | SMD2 | cwf9/smd2 |
| D3 | 13.9 | gi∣4759160 | 21 | 24 | · | SMD3 | smd3 |
| E | 10.8 | gi∣4507129 | 9 | 25 | · | SME1 | sme1 |
| F | 9.7 | gi∣4507131 | 2 | 7 | · | SMX3 | smf1 |
| G | 8.5 | gi∣4507133 | 15 | · | SMX2 | smg1 | |
| U1 snRNP | |||||||
| U1-70K | 51.6 | gi∣29568103 | 67 | 67 | · | SNP1 | U1-70k/SPAC19A8.13 |
| U1-A | 31.3 | gi∣4759156 | 24 | 38 | · | MUD1 | U1-A/SPBC4B4.07c |
| U1-C | 17.4 | gi∣4507127 | 2 | · | YHC1 | SPBP35G2.09 | |
| U1 snRNP-related | |||||||
| FBP11 | 48.5 | gi∣88953744 | 10 | 18 | PRP40 | prp40 | |
| S164 (fSAP94) | 100.1 | gi∣4050087 | 10 | 13 | SNU71 | SPBC839.10 | |
| 17S U2 snRNP | |||||||
| U2A′ | 28.4 | gi∣50593002 | 31 | 32 | · | LEA1 | U2-A/SPBC1861.08c |
| U2B″ | 25.4 | gi∣4507123 | 8 | 16 | · | MSL1 | U2-B/SPBC8D2.09c |
| SF3a120 | 88.9 | gi∣5032087 | 53 | 90 | · | PRP21 | sap114 |
| SF3a66 | 49.3 | gi∣21361376 | 13 | 7 | · | PRP11 | sap62 |
| SF3a60 | 58.5 | gi∣5803167 | 20 | 21 | · | PRP9 | sap61 |
| SF3b155 | 145.8 | gi∣54112117 | 69 | 77 | · | HSH155 | prp10/sap155 |
| SF3b145 | 100.2 | gi∣55749531 | 37 | 53 | · | CUS1 | sap145 |
| SF3b130 | 135.5 | gi∣54112121 | 160 | 196 | · | RSE1 | prp12/sap130 |
| SF3b49 | 44.4 | gi∣5032069 | 7 | 8 | · | HSH49 | sap49 |
| SF3b14a/p14 | 14.6 | gi∣7706326 | 23 | 15 | · | SPBC29A3.07c | |
| SF3b14b | 12.4 | gi∣14249398 | 14 | 12 | · | RDS3 | ini1 |
| SF3b10 | 10.1 | gi∣13775200 | 2 | · | YNL138W-A/RCP10/YSF3 | SPBC211.05 | |
| 17S U2-related | |||||||
| hPRP43 | 90.9 | gi∣68509926 | 16 | 37 | · | PRP43 | prp43 |
| SPF45 | 45.0 | gi∣14249678 | 4 | 9 | · | ||
| SPF30 | 26.7 | gi∣5032113 | 8 | 10 | · | spf30 | |
| U2AF65 | 53.5 | gi∣6005926 | 5 | 8 | · | MUD2 | prp2/mis11/U2AF59 |
| U2AF35 | 27.9 | gi∣5803207 | 1 | 5 | · | U2AF23/SPAP8A3.06 | |
| SPF31 | 31.0 | gi∣7657611 | 1 | 8 | · | spf31 | |
| hPRP5 | 117.4 | gi∣41327773 | 27 | 10 | · | PRP5 | prp11 |
| SR140 (fSAPa) | 118.2 | gi∣51492636 | 1 | 3 | · | SPBC11C11.01 | |
| CHERP | 100.0 | gi∣21359884 | 2 | · | |||
| PUF60 | 59.9 | gi∣17298690 | 10 | 10 | |||
| SF3b125 | 103.0 | gi∣45446743 | 3 | 1 | |||
| U5 snRNP | |||||||
| 220K | 273.7 | gi∣3661610 | 2 | · | PRP8 | spp42/cwf6/prp15 | |
| 200K | 244.5 | gi∣45861372 | · | BRR2 | brr2 | ||
| 116K | 109.4 | gi∣41152056 | 2 | · | SNU114 | cwf10/spef2/snu114 | |
| 102K | 106.9 | gi∣40807485 | · | PRP6 | prp1 | ||
| 100K | 95.6 | gi∣41327771 | · | PRP28 | prp28 | ||
| 52K | 37.6 | gi∣5174409 | · | LIN1 (SNU40) | SPBC83.09c | ||
| U4/U6 snRNP | |||||||
| 90K | 77.6 | gi∣4758556 | 1 | PRP3 | SPAC29E6.02 | ||
| U4/U6.U5 snRNP | |||||||
| 110K | 90.2 | gi∣13926068 | · | SNU66 | snu66 | ||
| SR proteins | |||||||
| SF2/ASF | 27.8 | gi∣5902076 | 89 | 69 | · | ||
| 9G8 | 27.4 | gi∣72534660 | 15 | 29 | · | ||
| SRp20 | 19.4 | gi∣4506901 | 22 | 10 | · | ||
| SRp30c | 25.5 | gi∣4506903 | 4 | 30 | · | ||
| SRp40 | 31.3 | gi∣3929378 | 13 | 25 | · | ||
| SRp55 | 39.6 | gi∣20127499 | 22 | 29 | · | ||
| SRp75 | 56.8 | gi∣21361282 | 11 | 7 | |||
| SC35 (SFRS2) | 25.5 | gi∣47271443 | 6 | 8 | · | ||
| hTra-2 beta/SFRS10 | 33.7 | gi∣4759098 | 2 | 3 | |||
| SR-related proteins | |||||||
| FLJ10154 | 32.9 | gi∣48675817 | 1 | 6 | |||
| SRm160 | 102.5 | gi∣3005587 | 2 | SPCC825.05c | |||
| SRm300 | 300.0 | gi∣19923466 | 12 | 1 | CWC21 (?) | cwf21 | |
| HnRNP | |||||||
| hnRNP A1 | 38.7 | gi∣4504445 | 20 | 43 | · | ||
| hnRNP A3 | 39.6 | gi∣34740329 | 4 | · | |||
| hnRNP AB | 36.0 | gi∣12803583 | 2 | 2 | |||
| hnRNP A2/B1 | 37.4 | gi∣14043072 | 10 | 17 | · | ||
| hnRNP C1/C2 | 33.3 | gi∣4758544 | 8 | 24 | · | ||
| hnRNP G | 42.4 | gi∣56699409 | · | ||||
| hnRNP K | 51.0 | gi∣14165435 | · | ||||
| hnRNP Q | 69.6 | gi∣23397427 | 4 | 2 | |||
| hnRNP R | 70.9 | gi∣5031755 | · | ||||
| hnRNP U | 90.6 | gi∣14141161 | 7 | 3 | · | ||
| PCBP1 | 37.5 | gi∣5453854 | 4 | 8 | HEK2 | ||
| E1B-AP5 | 95.7 | gi∣21536326 | · | ||||
| cap binding complex | |||||||
| CBP20 | 18.0 | gi∣19923387 | 1 | 9 | · | CBC2 | SPBC13A2.01c |
| CBP80 | 91.8 | gi∣4505343 | 7 | 9 | · | STO1 | SPAC6G10.07 |
| hPRP19/CDC5 complex | |||||||
| hPRP19 | 55.2 | gi∣7657381 | 7 | · | PRP19 | cwf8/prp19 | |
| CDC5 (CDC5L) | 92.2 | gi∣11067747 | 1 | 6 | CEF1 | cdc5 | |
| SPF27 | 21.5 | gi∣5031653 | 3 | SNT309 | cwf7/spf27 | ||
| PRL1 (PRLG1) | 57.2 | gi∣4505895 | PRP46 | cwf1/prp5/prl1/pi024 | |||
| CCAP1 (hsp73) | 70.4 | gi∣5729877 | 2 | 3 | SSA1 | ssa1 | |
| CCAP2 (hspc148, AD-002) | 26.6 | gi∣7705475 | 9 | CWC15 | cwf15 | ||
| Catenin β-like 1 (CTNNBL1, NAP) | 65.1 | gi∣18644734 | 3 | 5 | SPAC1952.06c | ||
| Npw38BP | 70.0 | gi∣7706501 | 4 | 5 | |||
| Npw38 | 30.5 | gi∣5031957 | 1 | 1 | |||
| hPRP19/CDC5-related | |||||||
| PRCC | 52.4 | gi∣40807447 | 2 | ||||
| Non-snRNP proteins (previously detected) | |||||||
| RBM5/LUCA15 | 92.1 | gi∣5032031 | 4 | 4 | · | ||
| FLJ10839 | 132.8 | gi∣46852388 | 9 | 7 | · | ||
| ASR2B | 100.0 | gi∣58331218 | 27 | 56 | · | SPBC725.08 | |
| p68 (DDX5) | 69.2 | gi∣4758138 | 6 | 21 | · | DBP2 | dbp2 |
| SF4 (F23858) | 72.5 | gi∣33469964 | 16 | 13 | · | YNL224C (?) | SPAC2G11.04 (?) |
| RNPC2 (CC1.3, CAPER, fSAP59) | 59.4 | gi∣4757926 | 17 | 15 | · | rsd1 | |
| TLS/FUS | 53.4 | gi∣544357 | 7 | 9 | · | ||
| ELAV (HuR) | 36.1 | gi∣38201714 | 2 | 3 | · | ||
| YB-1 | 35.9 | gi∣34098946 | 2 | 2 | · | ||
| NFAR | 95.4 | gi∣24234750 | 8 | · | |||
| DDX9 | 142.0 | gi∣4503297 | 1 | · | |||
| Non-snRNP proteins (previously not detected) | |||||||
| SF1 | 68.3 | gi∣42544130 | 6 | 7 | MSL5/BBP1/YSF1 | bpb1/bbp/sf1 | |
| tat SF1 | 85.7 | gi∣21361437 | 4 | 4 | CUS2 | uap2 | |
| CDC2L2 | 91.0 | gi∣16357494 | 5 | 1 | SPBC18H10.15 | ||
| MGC2803 (fSAP18) | 18.4 | gi∣13128992 | 6 | 10 | |||
| RBM10 | 103.5 | gi∣12644371 | 9 | 8 | SPAC17H9.04c (?) | ||
| ZNF207 | 50.8 | gi∣4508017 | 1 | 4 | |||
| BUB3 | 37.2 | gi∣4757880 | 7 | 16 | BUB3 | bub3 | |
| TCERG1 (CA150) | 123.9 | gi∣21327715 | 8 | 11 | YPR152C | dre4 | |
| NRIP2 | 31.3 | gi∣13899327 | 3 | 6 | |||
| LOC124245 | 104.0 | gi∣31377595 | 3 | 9 | |||
| NIPP1 | 38.5 | gi∣13699256 | 1 | 5 | |||
| HCNGP | 33.9 | gi∣9994179 | 4 | SPAC3H1.03 | |||
| PPP1CA | 38.6 | gi∣4506003 | 1 | GLC7 | dis2/bws1/sds1 | ||
| NF45 | 43.0 | gi∣24234747 | 1 | ||||
| p72/DDX17 | 80.5 | gi∣3122595 | 2 | (DBP2) | (dbp2) | ||
| Acinus (fSAP152) | 151.8 | gi∣7662238 | 6 | 4 | |||
| Pinin | 81.6 | gi∣33356174 | 4 | ||||
| RNPS1 | 34.2 | gi∣6857826 | 1 | rnps1 | |||
| Miscellaneous | |||||||
| p30 DBC | 102.9 | gi∣24432106 | 2 | ||||
| SEC31-like 2 | 128.7 | gi∣14149696 | 4 | SEC31 | sec31/sns-B2/pi045 | ||
| AGGF1 | 80.9 | gi∣39725952 | 2 | ||||
| CIRP | 18.7 | gi∣4502847 | 2 | ||||
| TAFIIB | 137.0 | gi∣8392875 | 2 | ||||
| Proteins were identified by LC-MSMS after separation by SDS–PAGE, and the given number is the absolute number of peptides sequenced for that protein. Proteins identified previously in A complexes purified by one-step tobramycin affinity selection (Hartmuth et al, 2002) are indicated by a dot. Proteins generally accepted to be common contaminants, such as ribosomal proteins, are not shown. The calculated mass of each protein (in kDa), its accession number in the GenBank database at the NCBI and gene names of S. cerevisiae and S. pombe homologues are indicated. ?: unclear whether the indicated yeast protein is a true orthologue. | |||||||
Unexpectedly, fractions 9 and 10 also contained three proteins of the 14S hPrp19/CDC5 complex, namely CDC5, hsp73 and catenin β-like 1, as well as Npw38 and Npw38BP, which appear to be loosely associated with this complex (Makarova et al, 2004). However, relatively few peptides were identified for each of these proteins, suggesting that only a subset of the A complexes in fractions 9 and 10 contains these proteins. The protein composition of A complexes in fractions 11 and 12 was nearly identical to that of 9 and 10, with one notable exception: all proteins of the hPrp19/CDC5 complex (excluding PRL1) plus Npw38 and Npw38BP were detected. In addition, PRCC, which has been shown to associate with CDC5 (Skalsky et al, 2001) was also identified. As the hPrp19/CDC5 complex sediments as a 14S particle and fractions 11 and 12 correspond to the 30S region of the gradient, free hPrp19/CDC5 complexes should not be present in these fractions. Likewise, little or no B complex or 35S U5 snRNPs (which contain hPrp19/CDC5 proteins) are present in this region. This is evidenced by the fact that only the U5-220 K, U5-116 K and U4/U6-90 K proteins of the U5 and/or tri-snRNP were detected by MS, and only 1–2 peptides were identified in each case, compared with 50–200 in a B complex isolated under similar native conditions (Deckert et al, 2006). Taken together, these data suggest that proteins of the hPrp19/CDC5 complex are associated with at least a subpopulation of A complexes and can bind independent of the tri-snRNP.
Immunoprecipitation confirms that CDC5 is associated with the A complex
To provide additional evidence that the hPrp19/CDC5 complex is indeed associated with A complexes, we performed immunoprecipitation (IP) with anti-CDC5 antibodies (Makarova et al, 2004) and gradient fraction 11 or 15. Pre-mRNA and U1, U2, U4, U5 and U6 snRNAs were precipitated from gradient fraction 15 (Figure 4, lane 5), consistent with the known association of CDC5 and the hPrp19/CDC5 complex with the B complex. Note that U6 snRNA is poorly labeled by 32P-pCp and that the remaining snRNAs are labeled with different efficencies, leading to differences in the intensities of their respective bands. Significantly, pre-mRNA, U1 and U2 snRNA were precipitated from gradient fraction 11 (∼8–10% of the input—excluding background binding—for each RNA; data not shown; Figure 4, lane 2), demonstrating that CDC5 (and presumably other proteins of the hPrp19/CDC5 complex) is indeed associated with the A complex. Preincubation of the antibody with the cognate anti-CDC5 peptide significantly reduced the amount of all co-immunoprecipitated RNAs in both cases, demonstrating the specificity of the IPs (Figure 4, lanes 3 and 6).
Figure 4.
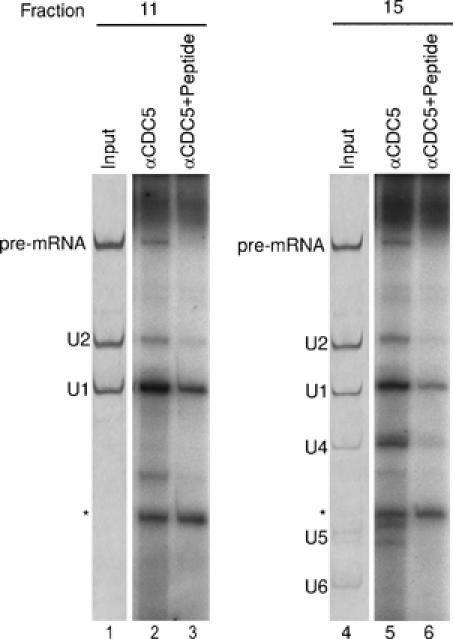
A complexes are precipitated by anti-CDC5 antibodies. Immunoprecipitations were performed with glycerol gradient fractions 11 and 15 (as indicated) containing double affinity-purified complexes, and anti-CDC5 antibodies (lanes 2 and 5) or anti-CDC5 antibodies preblocked with cognate CDC5 peptide (lanes 3 and 6). Coprecipitated RNAs were labeled with 32P-pCp, fractionated by 10% denaturing PAGE and detected by autoradiography (lanes 2, 3, 5 and 6). Lanes 1 and 4: RNA recovered directly from gradient fraction 11 or 15 and visualized by silver staining. The identity of the various RNAs is indicated on the left. The asterisk indicates a band arising due to the addition of tRNA before pCp labeling.
hPrp19/CDC5 complex proteins bind A complexes independent of the tri-snRNP
To provide independent evidence that the hPrp19/CDC5 proteins are associated with A complexes, we used an alternative method to purify them, namely MS2 affinity selection (Deckert et al, 2006). Briefly, MINX pre-mRNA with three MS2 binding sites was prebound with MS2-MBP fusion protein and incubated for 8–10 min under splicing conditions. Assembled complexes were then purified by binding to amylose beads, eluting with maltose and fractionating by glycerol gradient centrifugation. Significantly, hPrp19/CDC5 proteins were detected in both A and B complexes but not H complexes purified in this way (see Supplementary Figure S1). Thus, the association of hPrp19/CDC5 proteins with pre-mRNA is splicing dependent and is detected in A complexes isolated by two independent methods.
Previously, we showed that functional A complexes can be purified from nuclear extract depleted of U4/U6 snRNs (ΔU4/U6), which does not allow the formation of tri-snRNPs or B complexes (Behzadnia et al, 2006). To determine whether hPrp19/CDC5 proteins indeed bind A complexes independent of the tri-snRNP, we analyzed whether these proteins are present in A complexes purified from ΔU4/U6 nuclear extract. A complexes purified via MS2 affinity selection from mock or ΔU4/U6 extract contained equimolar amounts of pre-mRNA, U1 and U2 snRNA (Figure 5A, lanes 1 and 2), and B complexes contained equimolar amounts of pre-mRNA, U1, U2, U4, U5 and U6 snRNA (lane 3). To analyze for the presence of selected proteins, we performed immunoblotting. Antibodies against SF3b155, a core component of A and B complexes, were used to confirm that comparable amounts of complexes were analyzed. As expected, the U4/U6-61 K, U4/U6-15.5 K and U5-40 K proteins were detected only in B complexes purified from mock-depleted extract and not in A complexes purified from mock- or U4/U6-depleted extract (Figure 5B). Significantly, the hPrp19/CDC5 proteins Prp19, CDC5, AD002 and also PRL1, which was not previously detected by MS in the double affinity-purified A complexes, were detected in A complexes purified from ΔU4/U6 and mock extracts but not in H complexes isolated in parallel (Figure 5B; data not shown). ECM2, a hPrp19/CDC5-related protein that was not found in double affinity-purified A complexes, was also not detected in MS2 affinity-selected A complexes. A complexes assembled in ΔU4/U6 extract were also precipitated by anti-CDC5 antibodies (data not shown). Taken together, these data demonstrate that the hPrp19/CDC5 proteins can bind to the A complex independent of the tri-snRNP, and further indicate that the A complex containing the hPrp19/CDC5 complex represents a novel spliceosome assembly intermediate that forms before the B complex.
Figure 5.
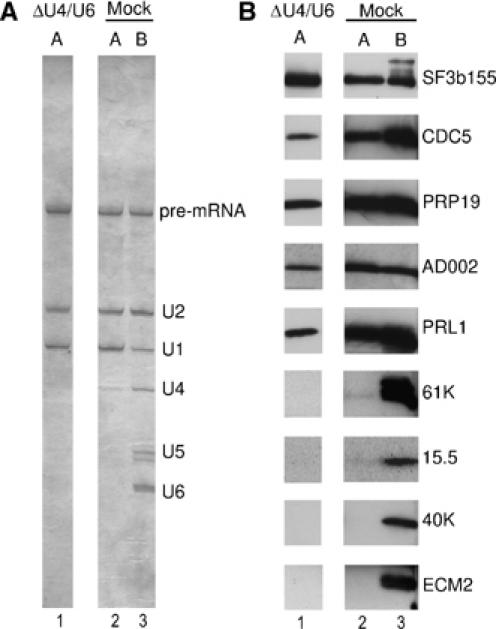
hPrp19/CDC5 complex proteins bind to the A complex independent of the tri-snRNP. (A, B) Spliceosomal complexes, MS2 affinity-selected from U4/U6-depleted (lane 1) and mock-depleted (lanes 2 and 3) nuclear extract, were fractionated on a glycerol gradient. A complex (lanes 1 and 2) and B complex fractions (lane 3) were separately pooled. (A) RNA was isolated, analyzed by denaturing PAGE and visualized by silver staining. (B) Proteins were recovered, separated by SDS–PAGE and immunoblotting was performed with the indicated antibodies.
Structural analysis of the A complex by EM
To determine the structure of native A complexes, double affinity-purified particles from the glycerol gradient A complex peak (corresponding to fraction 11) were negatively stained with uranyl formate and analyzed by EM. Owing to the presence of contaminating H complexes and their higher degree of heterogeneity, MS2 affinity-selected A complexes were not suitable for the generation of a 3D structure via EM. The raw EM images of the double affinity-purified particles revealed a monodisperse population relatively homogeneous in size and shape (Figure 6A), confirming that intact spliceosomal complexes had been isolated. Imaged particles are up to 260 Å long and show distinct fine structural details. Two-dimensional (2D) single-particle analysis revealed typical 2D class averages, consisting of 20–30 class members (Figure 6B). Typically, the class averages exhibit two foot-like density elements oriented at the bottom in Figure 6B, which are connected to a globular main body. At the top, the main body shows an inclined, somewhat cantilevered, element on one side (oriented to the right in rows 1 and 2 and to the left in row 3). Opposite this element, a protruding, head-like element is seen. These general features (i.e. the foot-like and head-like protrusions) were used to orient the particles in Figure 6B, and a similar distribution of densities was found in the majority of the class averages, underscoring the reliability of the projection views. Although the particles appear to adsorb onto the carbon film with a preferred orientation, as indicated by the predominance of the particles shown in rows 1 and 2 of Figure 6B, several additional orientations appear to be present in the data set. For example, some class averages of the 2D analysis represent mirror images (e.g. compare the first class average in row 1 versus 3), thus indicating that opposite sides of the particles can bind to the carbon film.
Figure 6.
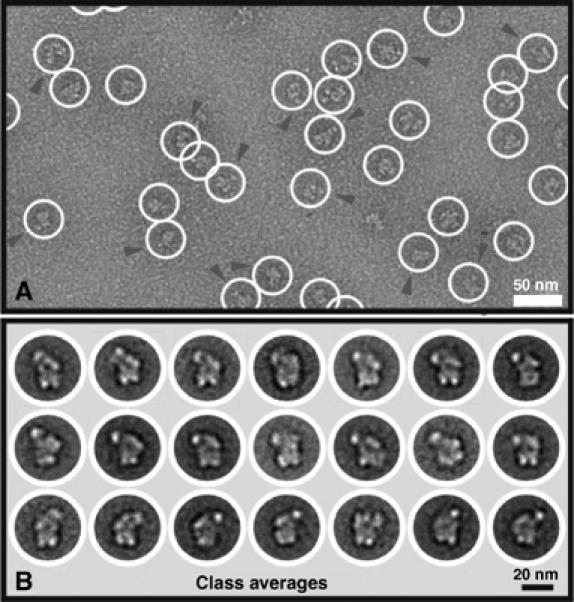
EM of the A complex and 2D analysis. (A) Typical EM image of the A complex taken with a 4k × 4k CCD camera in tile mode. The image reveals a homogenous population of globular particles (circled) with maximum dimensions of ∼260 Å (diagonal). In some views, the head-like domain has been marked by an arrowhead. (B) 2D analysis of the A complex. Multiple class averages are shown and reveal particles with a globular main body with two bottom protuberances and an upper side protuberance (pointing to the left in rows 1 and 2, and pointing to the right in row 3).
Three-dimensional analysis of the A complex by random conical tilt
Using the random conical tilt (RCT) approach (Radermacher, 1988), a 3D structure of the spliceosomal A complex was calculated to an estimated resolution of 4–5 nm (Figure 7). This method is particularly well suited to determine reliably the general morphology of a given particle that shows a preferred binding orientation in the EM preparation and also provides the correct handedness of the 3D structure. The data set was classified into 51 groups by multivariate statistical analysis (MSA)-based hierarchic ascendant classification (van Heel, 1984), and classes with the largest numbers of members were selected for 3D reconstruction. The A complex has an elongated, globular appearance, with an overall size of approximately 230 × 200 × 195 Å and a maximum dimension of ∼260 Å (diagonal). The general architecture shows a globular main body with a size of approximately 205 × 195 × 150 Å and several protruding elements. In the middle of the main body, a slight constriction that we have denoted the ‘waist is seen'. At the bottom, two foot-like protuberances are connected to the main body of the particle. One side of the upper region exhibits a descending, slightly protruding density element that we refer to as the ‘shoulder'. On the other side, a prominent head-like density element is connected to the main body by a ‘neck' region. Between the head domain and main body, a cleft is present (Figure 7, right). Lateral to the neck region, a smaller arm-like element protrudes. Significantly, all of the prominent structural features seen in the 2D class averages (Figure 6B) or even in the raw images (Figure 6A) can also be seen in the 3D reconstruction, supporting its validity.
Figure 7.
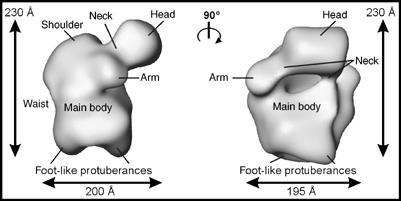
3D structure of the A complex. A 3D structure was computed using the RCT approach and two views of its surface representation are separated by a 90° rotation. The A complex has a maximum size of ∼260 Å (diagonal). Characteristic landmarks are labeled for orientation and are described in the main text.
Discussion
Here, we have purified native A complexes under low-stringency conditions using a double affinity purification method. Psoralen crosslinking confirmed the concomitant base pairing interaction of U1 and U2 with the pre-mRNA in these complexes, demonstrating that they are indeed A complexes, as opposed to E complexes. Unexpectedly, MS and immunoblotting revealed that proteins of the hPrp19/CDC5 complex are associated with purified A complexes, and that the latter are recruited to the spliceosome independent of the tri-snRNP. Subsequent EM analyses provided the first information about the 3D structure of the spliceosomal A complex.
MS reveals novel A complex components
Most of the proteins identified here were also found in A complexes purified solely by tobramycin affinity selection (Hartmuth et al, 2002). Surprisingly, ∼20 additional non-snRNP proteins (excluding hPrp19/CDC5 proteins) were detected in double affinity-purified A complexes, suggesting that the protein composition of the A complex is larger than previously thought. However, the number of peptides identified by MS is relatively low for some of these newly detected proteins. Although MS is not reliably quantitative when solely numbers of sequenced peptides are compared, the drastically lower number of peptides derived from several of the newly identified proteins versus those obtained from proteins of similar size suggest that they are present in substoichiometric amounts. Nearly all of the newly identified proteins have documented links to splicing or were also detected in other affinity-purified spliceosomes. Thus, they appear to be, for the most part, bona fide spliceosomal proteins. The fact that these proteins were not detected in previous A complex preparations could be due to differences in the purification methods used and/or to previously less sensitive MS. For example, unlike the currently analyzed A complex samples (where an entire lane of SDS–PAGE-separated proteins is subjected to MS), previously only clearly visible protein bands were excised from the gel and subjected to MALDI MS, and proteins within the bands were almost exclusively identified by peptide mass fingerprint. Thus, several A complex proteins may have simply escaped detection in the past.
Among the newly detected proteins, several have interesting links to core components of the A complex. For example, homology searches suggest that FBP11 and S164 are the human counterparts of the yeast U1 snRNP-associated proteins Prp40 and Snu71, respectively (B Séraphin, personal communication). These proteins are not found in purified human U1 snRNPs by MS (data not shown)—indicating that they are not stable snRNP components—but are detected in a mixture of human spliceosomal complexes (Rappsilber et al, 2002; Zhou et al, 2002). Thus, they potentially could aid in the recruitment of the human U1 snRNP to the pre-mRNA or in communication between U1 and other A complex components such as U2. The function of FBP11 in splicing is presently not clear, but its WW domain preferentially interacts with U2AF, SF1 and the U2 snRNP (Lin et al, 2004).
The presence of a given protein in purified A complexes indicates that it is recruited very early during spliceosome assembly and potentially functions already at this stage. As double affinity-purified A complexes and the spliceosomal B complex were isolated under very similar conditions, a meaningful comparison of their proteomes can be made. Nearly all A complex proteins are also found in purified B complexes, and several, such as subunits of SF3a and SF3b, remain associated throughout the latter stages of spliceosome assembly/function. Interestingly, only a handful of proteins, including hPrp5, SF1, RBM5, MGC2803, FLJ10839, ZNF207 and BUB3, are lost during the A to B complex transition, suggesting that they interact transiently with early spliceosomal complexes and that their activity/presence is only required for early spliceosome assembly events. Indeed, hPrp5 and SF1 are required for A complex formation (Krämer, 1992; Will et al, 2002). SF1 interacts with the BPS already in the E complex and is displaced upon base pairing of U2 snRNA with the BPS at the time of A complex formation (Schwer, 2001). Whether it subsequently remains associated with the A complex is not known. As we cannot rule out that our purified A complexes contain small amounts of E complex, the detection of SF1 in our preparations does not allow any conclusions regarding this point. Nonetheless, they are consistent with the idea that SF1 remains associated until the A to B complex transition.
A complexes also contain hPrp19/CDC5 complex proteins
MS and IP revealed that double affinity-purified A complexes contain a complete set of proteins of the hPrp19/CDC5 complex (Table I and Figure 4). However, PRL1 was not detected by MS in the double affinity-purified A complexes. Immunoblotting studies also revealed the presence of hPrp19/CDC5 and associated proteins in MS2 affinity-purified A complexes (Figure 5). Taken together, these results demonstrate that hPrp19/CDC5 proteins are recruited very early during spliceosome assembly, a conclusion consistent with several observations both in yeast and humans. For example, disruption of the human hPrp19/CDC5 complex by addition of CDC5 mutant proteins containing the PRL1 interaction domain interferes with spliceosome formation (Ajuh et al, 2001). Furthermore, the addition of peptides derived from the self-interaction domain of hPrp19 also destabilizes or inhibits A complex formation in splicing extracts (Grillari et al, 2005). In line with these observations, hPrp19 alone was also previously detected in purified human spliceosomal A complexes (Hartmuth et al, 2002). In yeast, recent data suggest that Clf1p, a component of the NTC, the yeast equivalent of the human Prp19/CDC5 complex, functions before tri-snRNP integration (Chung et al, 1999; Wang et al, 2003), and recently, Cef1 and Prp19 were detected in prespliceosomes (Tardiff and Rosbash, 2006).
Although kinetic experiments (i.e. a detailed time course of splicing complex formation followed by affinity selection and MS) were not performed, the A complex containing hPrp19/CDC5 likely represents a novel spliceosome assembly intermediate. A complexes containing hPrp19/CDC5 proteins are clearly not generated by the breakdown of the B complex (e.g. during glycerol gradient centrifugation), as no ‘free' U4/U6.U5 tri-snRNPs (which would be expected to be released together with A complexes containing hPrp19/CDC5 proteins) are observed. More importantly, A complexes isolated from U4/U6-depleted nuclear extract, which lacks U4/U6.U5 tri-snRNPs and no longer supports B complex formation, also contained significant amounts of hPrp19/CDC5 proteins (Figure 5). These data additionally confirm that the hPrp19/CDC5 complex can interact with pre-mRNA independent of and before the tri-snRNP. It will be interesting in the future to determine which A complex proteins provide a binding platform for the hPrp19/CDC5 complex; prime candidates include proteins associated with the U1 and U2 snRNPs. As the hPrp19/CDC5 complex is ultimately released from the spliceosome as part of the 35S U5 snRNP (Makarov et al, 2002) and U5 is not present in the A complex, significant changes in protein–protein interactions involving the hPrp19/CDC5 complex must occur during splicing. Future in vitro assembly studies with purified A complexes (with and without hPrp19/CDC5) plus purified tri-snRNPs should allow a detailed dissection of the A to B transition and help to identify additional factors required at this step of spliceosome assembly.
3D structure of the A complex
EM revealed that the double affinity isolation procedure yields a relatively homogeneous population of particles (Figure 6). Thus, the A complexes isolated here represent a defined, structurally intact entity. Specific morphological features were consistently found in the 2D class averages and reflected elements already seen in the raw images. By using the RCT approach, a 3D reconstruction was obtained, revealing for the first time the 3D structure of the presplicesomal A complex. The main structural element of the A complex is a globular body ∼205 × 195 × 150 Å in size from which several smaller elements protrude.
The molecular mass of the A complex was estimated to be approximately 2.5±0.6 MDa. This is in line with the molecular masses of U1 snRNP (0.24 MDa) and U2 snRNP (∼1 MDa), and leaves room for other A complex proteins. Although the combined molecular mass of all proteins detected by MS exceeds 3 MDa, several proteins are likely not abundant components and thus will not be represented in the EM images. Some of these less abundant proteins may associate only transiently with the A complex or may have partially been lost during the double affinity purification procedure. Indeed, inspection of those A complex proteins visible by Coomassie staining after SDS–PAGE suggests that the sum of the most abundant components comprises a molecular mass of roughly 2 MDa (not shown), consistent with the mass estimated by EM.
The 3D structures of the A complex and human U11/U12 di-snRNP exhibit some similarities. The U11/U12 di-snRNP is the main subunit of the minor (U12 type) A complex, but lacks pre-mRNA and non-snRNP proteins. U11 and U12 are functional analogues of U1 and U2, respectively (Patel and Steitz, 2003). A comparison of their RCT 3D reconstructions reveals that both the major A complex and the U11/U12 di-snRNP are elongated and possess multiple protuberances including two foot-like protrusions that appear much thinner in the U11/U12 structure (Figures 7 and Supplementary Figure S2; Golas et al, 2005). However, consistent with its more complex proteome, the major A complex is significantly larger than the U11/U12 di-snRNP. As the U11/U12 3D structure was obtained at a resolution of ∼13 Å, several proteins could be precisely localized based on their characteristic shape and/or by immunolabeling experiments (Golas et al, 2005). However, owing to the much lower resolution of the A complex, it is currently not clear where SF3b or other functionally important components are located. Furthermore, initial attempts to localize components of the A complex via immunolabeling failed, owing to disintegration of the complex. The main factor limiting resolution still appears to be heterogeneity in the A complex preparation. Indeed, although the A complexes isolated here are much more homogenous than those previously isolated, several proteins appear to be present in only substoichiometric amounts. More sophisticated image analyses might allow the extraction of those images showing a more homogenous subpopulation of A complexes and thereby lead to enhanced resolution.
The A complex is converted to the precatalytic B complex upon integration of the U4/U6.U5 tri-snRNP and additional proteins. EM image analyses of B complexes isolated under physiological conditions revealed a 420-Å-long particle consisting of a triangular body and a conformationally more heterogeneous head domain (Deckert et al, 2006). B complexes isolated under stringent conditions that lack the U1 snRNP also contain a triangular body, but differ from native B complexes mainly in the appearance of their head domain (Boehringer et al, 2004). As the triangular body of the B complex resembles very much the triangularly shaped tri-snRNP complex in both 2D (Boehringer et al, 2004) and 3D (Sander et al, 2006), the head domain of the B complex compartment likely contains A complex components. Indeed, the size of the B complex head domain (∼200 Å wide) could accommodate reasonably well the A complex structure determined here. In summary, our EM analyses provide the first 3D structure of the A complex and thus important insights into the spatial organization of the spliceosome at an initial assembly stage during which the splice sites are selected for splicing. The 3D structure determined here, together with that of the U4/U6.U5 tri-snRNP (Sander et al, 2006), also provide essential information for more precise localization of components of the B complex.
Materials and methods
In vitro transcription and extract preparation
MINX pre-mRNA tagged with the J6f1 tobramycin RNA aptamer or three MS2 binding sites was generated as described (Hartmuth et al, 2002; Deckert et al, 2006). HeLa nuclear extract and mock- or U4/U6-depleted extract were prepared as described (Behzadnia et al, 2006).
Double affinity purification of A complexes and MS
Human A complexes were purified by tobramycin affinity selection followed by immunoaffinity selection with antibodies against SF3a66 (Behzadnia et al, 2006). For MS and EM, the reaction volume was increased two-fold. After fractionation of spliceosomal complexes on a 10–30% glycerol gradient, RNA was recovered, analyzed on an 8.3 M urea–10% polyacrylamide gel and visualized by silver staining or autoradiography. For MS, proteins were recovered from pooled gradient fractions 9 and 10 or 11 and 12, separated by 10%/13% SDS–PAGE and stained with Coomassie blue. Entire lanes were cut into ∼50 slices and proteins were digested in-gel with trypsin and extracted according to Shevchenko et al (1996). Peptides were analyzed in an LC-coupled ESI Q-ToF (Q-ToF Ultima, Waters) and/or a linear iontrap (4000 QTrap, Applied Biosystems) mass spectrometer under standard conditions. Proteins were identified by searching fragment spectra against the NCBI nr database using Mascot as search engine.
MS2 affinity selection and immunoblotting
A and B complexes were isolated by MS2 affinity selection from mock- or U4/U6-depleted extract according to Deckert et al (2006) with the following exceptions: complexes were affinity selected directly from the splicing reaction, all buffers contained 75 mM NaCl and splicing was performed for 10 min at a substrate concentration of 10 nM. Gradient centrifugation of the MS2 eluate and RNA analysis were performed as decribed above. For immunoblotting, proteins were separated by SDS–PAGE on a 10%/13% gel, transferred to Hybond P membrane and immunostained using an ECL detection kit (Pierce). Antibodies against the following proteins were used: SF3b155 (Will et al, 2002), 15.5 K, 40 K, CDC5, hPrp19 and AD002 (Makarova et al, 2004), 61 K (Deckert et al, 2006), PRL1 (aa 60–77) and ECM2 (aa 405–420).
Psoralen crosslinking
Psoralen crosslinking, Northern blotting and generation of 32P-labeled DNA probes against U1, U2 and MINX pre-mRNA were carried out as described (Hartmuth et al, 2002). For RNase H digestion, RNA from pooled fractions 10–12 was recovered after crosslinking and incubated at 37°C with DNA oligonucleotides (4 μM) against the pre-mRNA (TCTGGAAAGACCGCGAAG), U1 (CCTTCGTGATCA) or U2 (CCATTTAATATATTGTCC) and 5 U RNase H (USB).
Immunoprecipitation
A 100 μl volume of protein A–Sepharose beads was incubated end over end (EOE) for 1 h at 4°C with 100 μl of affinity-purified anti-CDC5 antibodies (Makarova et al, 2004) in phosphate-buffered saline, pH 8.0, containing 0.5 mg/ml of bovine serum albumin and 50 μg/ml yeast tRNA. Antibody-charged beads were then divided into two aliquots and incubated with either CDC5 peptide or water. Beads were incubated EOE for 1 h at 4°C and washed 4 × with G75 buffer (20 mM HEPES, pH 7.9, 75 mM KCl, 1.5 mM MgCl2 and 0.05% NP-40). A 65 μl volume of the indicated gradient fraction was incubated for 1.5 h at 4°C with 20 μl of the preblocked or unblocked anti-CDC5 beads in a total volume of 300 μl of G75 buffer. The beads were then washed 5 × with G75 buffer. Co-precipitated RNAs were recovered, 3′ end labeled with 32P-pCp and analyzed by denaturing PAGE.
Electron microscopy
For EM, complexes were subjected to 10–30% glycerol gradient centrifugation and 0–0.1% glutaraldehyde. Samples were prepared from the peak A complex-containing fraction (as determined by the distribution of 32P-labeled pre-mRNA) as outlined previously (Golas et al, 2003). Images were taken at room temperature twice at a tilt angle of −45 and 0° at 200 kV and a magnification of ∼122 000-fold (using a Philips holder) on a CM200 FEG electron microscope (Philips/FEI, Eindhoven, The Netherlands) equipped with a two-fold coarsened 4k × 4k CCD camera (F415 TVIPS, Gauting, Germany). Approximately 7600 particles were selected manually from the untilted and tilted images. Subsequent to two-fold coarsening of the single-particle images, the pixel size was ∼4.9 Å at the specimen level, resulting in an excellent image contrast (Sander et al, 2005). The untilted single-particle images were aligned using exhaustive multireference alignment based on polar coordinates (Sander et al, 2003) and subjected to MSA and hierarchic ascendant classification, generating classes with 20–30 members on average in the context of the software IMAGIC-5 (van Heel et al, 1996). This procedure (Dube et al, 1993) was repeated four times until the result was stable. In the final iteration, the aligned single-particle images were divided into 51 classes. Projection angles of the tilted images were determined by the RCT method (Radermacher, 1988) and a 3D structure of the visually best class was calculated using these projection angles. The 3D structure containing 224 class members was visualized with the software AmiraDev 2.3 (TGS Europe, Merignac Cedex, France).
Accession code
The density map of the A complex has been deposited at the Macromolecular structure Database under the accession number EMO-1325.
Supplementary Material
Figure S1
Figure S2
Acknowledgments
We are grateful to I Öchsner, T Conrad, P Kempkes and H Kohansal for excellent technical assistance, and to M Raabe and U Plessmann for excellent help with MS analyses. NB was supported by a Kekulé-Stipendium from the Fonds der Chemischen Industrie. This work was supported by grants from the DFG, the BMBF, Fonds der Chemischen Industrie and the Ernst Jung Stiftung to RL, and from the BMBF (031U215B) to HS.
References
- Ajuh P, Kuster B, Panov K, Zomerdijk JC, Mann M, Lamond AI (2000) Functional analysis of the human CDC5L complex and identification of its components by mass spectrometry. EMBO J 19: 6569–6581 [DOI] [PMC free article] [PubMed] [Google Scholar]
- Ajuh P, Sleeman J, Chusainow J, Lamond AI (2001) A direct interaction between the carboxyl-terminal region of CDC5L and the WD40 domain of PLRG1 is essential for pre-mRNA splicing. J Biol Chem 276: 42370–42381 [DOI] [PubMed] [Google Scholar]
- Azubel M, Wolf SG, Sperling J, Sperling R (2004) Three-dimensional structure of the native spliceosome by cryo-electron microscopy. Mol Cell 15: 833–839 [DOI] [PubMed] [Google Scholar]
- Behzadnia N, Hartmuth K, Will CL, Lührmann R (2006) Functional spliceosomal A complexes can be assembled in vitro in the absence of a penta-snRNP. RNA 12: 1738–1745 [DOI] [PMC free article] [PubMed] [Google Scholar]
- Boehringer D, Makarov EM, Sander B, Makarova OV, Kastner B, Lührmann R, Stark H (2004) Three-dimensional structure of a pre-catalytic human spliceosomal complex B. Nat Struct Mol Biol 11: 463–468 [DOI] [PubMed] [Google Scholar]
- Chan SP, Kao DI, Tsai WY, Cheng SC (2003) The Prp19p-associated complex in spliceosome activation. Science 302: 279–282 [DOI] [PubMed] [Google Scholar]
- Chen CH, Yu WC, Tsao TY, Wang LY, Chen HR, Lin JY, Tsai WY, Cheng SC (2002) Functional and physical interactions between components of the Prp19p-associated complex. Nucleic Acids Res 30: 1029–1037 [DOI] [PMC free article] [PubMed] [Google Scholar]
- Chung S, McLean MR, Rymond BC (1999) Yeast ortholog of the Drosophila crooked neck protein promotes spliceosome assembly through stable U4/U6.U5 snRNP addition. RNA 5: 1042–1054 [DOI] [PMC free article] [PubMed] [Google Scholar]
- Das R, Zhou Z, Reed R (2000) Functional association of U2 snRNP with the ATP-independent spliceosomal complex E. Mol Cell 5: 779–787 [DOI] [PubMed] [Google Scholar]
- Deckert J, Hartmuth K, Boehringer D, Behzadnia N, Will CL, Kastner B, Stark H, Urlaub H, Lührmann R (2006) Protein composition and electron microscopy structure of affinity-purified human spliceosomal B complexes isolated under physiological conditions. Mol Cell Biol 26: 5528–5543 [DOI] [PMC free article] [PubMed] [Google Scholar]
- Dube P, Tavares P, Lurz R, van Heel M (1993) The portal protein of bacteriophage SPP1: a DNA pump with 13-fold symmetry. EMBO J 12: 1303–1309 [DOI] [PMC free article] [PubMed] [Google Scholar]
- Golas MM, Sander B, Will CL, Lührmann R, Stark H (2003) Molecular architecture of the multiprotein splicing factor SF3b. Science 300: 980–984 [DOI] [PubMed] [Google Scholar]
- Golas MM, Sander B, Will CL, Lührmann R, Stark H (2005) Major conformational change in the complex SF3b upon integration into the spliceosomal U11/U12 di-snRNP as revealed by electron cryomicroscopy. Mol Cell 17: 869–883 [DOI] [PubMed] [Google Scholar]
- Grillari J, Ajuh P, Stadler G, Loscher M, Voglauer R, Ernst W, Chusainow J, Eisenhaber F, Pokar M, Fortschegger K, Grey M, Lamond AI, Katinger H (2005) SNEV is an evolutionarily conserved splicing factor whose oligomerization is necessary for spliceosome assembly. Nucleic Acids Res 33: 6868–6883 [DOI] [PMC free article] [PubMed] [Google Scholar]
- Hartmuth K, Urlaub H, Vornlocher HP, Will CL, Gentzel M, Wilm M, Lührmann R (2002) Protein composition of human prespliceosomes isolated by a tobramycin affinity-selection method. Proc Natl Acad Sci USA 99: 16719–16724 [DOI] [PMC free article] [PubMed] [Google Scholar]
- Jurica MS, Licklider LJ, Gygi SR, Grigorieff N, Moore MJ (2002) Purification and characterization of native spliceosomes suitable for three-dimensional structural analysis. RNA 8: 426–439 [DOI] [PMC free article] [PubMed] [Google Scholar]
- Jurica MS, Sousa D, Moore MJ, Grigorieff N (2004) Three-dimensional structure of C complex spliceosomes by electron microscopy. Nat Struct Mol Biol 11: 265–269 [DOI] [PubMed] [Google Scholar]
- Krämer A (1992) Purification of splicing factor SF1, a heat-stable protein that functions in the assembly of a presplicing complex. Mol Cell Biol 12: 4545–4552 [DOI] [PMC free article] [PubMed] [Google Scholar]
- Lim SR, Hertel KJ (2004) Commitment to splice site pairing coincides with A complex formation. Mol Cell 15: 477–483 [DOI] [PubMed] [Google Scholar]
- Lin KT, Lu RM, Tarn WY (2004) The WW domain-containing proteins interact with the early spliceosome and participate in pre-mRNA splicing in vivo. Mol Cell Biol 24: 9176–9185 [DOI] [PMC free article] [PubMed] [Google Scholar]
- Makarov EM, Makarova OV, Urlaub H, Gentzel M, Will CL, Wilm M, Lührmann R (2002) Small nuclear ribonucleoprotein remodeling during catalytic activation of the spliceosome. Science 298: 2205–2208 [DOI] [PubMed] [Google Scholar]
- Makarova OV, Makarov EM, Urlaub H, Will CL, Gentzel M, Wilm M, Lührmann R (2004) A subset of human 35S U5 proteins, including Prp19, function prior to catalytic step 1 of splicing. EMBO J 23: 2381–2391 [DOI] [PMC free article] [PubMed] [Google Scholar]
- Nilsen TW (1998) RNA–RNA interactions in nuclear pre-mRNA splicing. In RNA Structure and Function, Grundberg-Manago M, Simsons RW (eds) pp 279–307. Cold Spring Harbor, NY: Cold Spring Harbor Laboratory Press [Google Scholar]
- Patel AA, Steitz JA (2003) Splicing double: insights from the second spliceosome. Nat Rev Mol Cell Biol 4: 960–970 [DOI] [PubMed] [Google Scholar]
- Radermacher M (1988) Three-dimensional reconstruction of single particles from random and nonrandom tilt series. J Electron Microsc Tech 9: 359–394 [DOI] [PubMed] [Google Scholar]
- Rappsilber J, Ryder U, Lamond AI, Mann M (2002) Large-scale proteomic analysis of the human spliceosome. Genome Res 12: 1231–1245 [DOI] [PMC free article] [PubMed] [Google Scholar]
- Sander B, Golas MM, Makarov EM, Brahms H, Kastner B, Lührmann R, Stark H (2006) Organization of core spliceosomal components U5 snRNA loop I and U4/U6 di-snRNP within U4/U6.U5 tri-snRNP as revealed by electron cryomicroscopy. Mol Cell 24: 267–278 [DOI] [PubMed] [Google Scholar]
- Sander B, Golas MM, Stark H (2003) Corrim-based alignment for improved speed in single-particle image processing. J Struct Biol 143: 219–228 [DOI] [PubMed] [Google Scholar]
- Sander B, Golas MM, Stark H (2005) Advantages of CCD detectors for de novo three-dimensional structure determination in single-particle electron microscopy. J Struct Biol 151: 92–105 [DOI] [PubMed] [Google Scholar]
- Schwer B (2001) A new twist on RNA helicases: DExH/D box proteins as RNPases. Nat Struct Biol 8: 113–116 [DOI] [PubMed] [Google Scholar]
- Shevchenko A, Wilm M, Vorm O, Mann M (1996) Mass spectrometric sequencing of proteins from silver-stained polyacrylamide gels. Anal Chem 68: 850–858 [DOI] [PubMed] [Google Scholar]
- Skalsky YM, Ajuh PM, Parker C, Lamond AI, Goodwin G, Cooper CS (2001) PRCC, the commonest TFE3 fusion partner in papillary renal carcinoma is associated with pre-mRNA splicing factors. Oncogene 20: 178–187 [DOI] [PubMed] [Google Scholar]
- Tardiff DF, Rosbash M (2006) Arrested yeast splicing complexes indicate stepwise snRNP recruitment during in vivo spliceosome assembly. RNA 12: 968–979 [DOI] [PMC free article] [PubMed] [Google Scholar]
- Tarn WY, Hsu CH, Huang KT, Chen HR, Kao HY, Lee KR, Cheng SC (1994) Functional association of essential splicing factor(s) with PRP19 in a protein complex. EMBO J 13: 2421–2431 [DOI] [PMC free article] [PubMed] [Google Scholar]
- Tarn WY, Lee KR, Cheng SC (1993) Yeast precursor mRNA processing protein PRP19 associates with the spliceosome concomitant with or just after dissociation of U4 small nuclear RNA. Proc Natl Acad Sci USA 90: 10821–10825 [DOI] [PMC free article] [PubMed] [Google Scholar]
- Tsai WY, Chow YT, Chen HR, Huang KT, Hong RI, Jan SP, Kuo NY, Tsao TY, Chen CH, Cheng SC (1999) Cef1p is a component of the Prp19p-associated complex and essential for pre-mRNA splicing. J Biol Chem 274: 9455–9462 [DOI] [PubMed] [Google Scholar]
- van Heel M (1984) Multivariate statistical classification of noisy images (randomly oriented biological macromolecules). Ultramicroscopy 13: 165–183 [DOI] [PubMed] [Google Scholar]
- van Heel M, Harauz G, Orlova EV, Schmidt R, Schatz M (1996) A new generation of the IMAGIC image processing system. J Struct Biol 116: 17–24 [DOI] [PubMed] [Google Scholar]
- Wang Q, Hobbs K, Lynn B, Rymond BC (2003) The Clf1p splicing factor promotes spliceosome assembly through N-terminal tetratricopeptide repeat contacts. J Biol Chem 278: 7875–7883 [DOI] [PubMed] [Google Scholar]
- Will CL, Lührmann R (2006) Spliceosome structure and function. In The RNA World, Gesteland RF, Cech TR, Atkins JF (eds) pp 369–400. Cold Spring Habor, NY: Cold Spring Habor Laboratory Press [Google Scholar]
- Will CL, Urlaub H, Achsel T, Gentzel M, Wilm M, Lührmann R (2002) Characterization of novel SF3b and 17S U2 snRNP proteins, including a human Prp5p homologue and an SF3b DEAD-box protein. EMBO J 21: 4978–4988 [DOI] [PMC free article] [PubMed] [Google Scholar]
- Zhou Z, Licklider LJ, Gygi SP, Reed R (2002) Comprehensive proteomic analysis of the human spliceosome. Nature 419: 182–185 [DOI] [PubMed] [Google Scholar]
Associated Data
This section collects any data citations, data availability statements, or supplementary materials included in this article.
Supplementary Materials
Figure S1
Figure S2