

Abstract
Human height is a complex trait regulated by multiple genetic and environmental factors. CYP19 (cytochrome P450 19) encodes aromatase, which catalyses the rate-limiting step in the conversion of androgens to estrogens. Deleterious mutations in CYP19 can result in estrogen deficiency that will influence adult height to certain extent. In the present study, we aimed to test the associations between the CYP19 gene polymorphisms with adult height variation, using family-based association methods, such as QTDT (quantitative transmission disequilibrium test) and FBAT (family-based association test) in 1,873 subjects from 405 Caucasian nuclear families. We found one SNP (rs730154) significantly associated with height by both QTDT (P=0.0030) and FBAT (P=0.0016) analyses. Haplotype analyses corroborated our single-marker results by showing that the haplotypes in block 4 containing rs730154 were significantly associated with height variation. We thus concluded that CYP19 could be one of the genetic factors influencing adult height in Caucasians. Further studies are required to identify the causal functional variants responsible for Caucasian height within the CYP19 gene.
Introduction
Abnormal adult height has been considered one risk factor for complex diseases, such as type 2 diabetes (Lawlor et al. 2002), osteoporotic fracture (Hemenway et al. 1995), cancer (Giovannucci et al. 1997; Hebert et al. 1997), and cardiovascular disease (Forsen et al. 2000). Human height per se is also a complex trait, which is regulated by multiple genetic and environmental factors. High heritability of height was reported by previous genetic studies, ranging from 0.75 to 0.90 (Carmichael and McGue 1995; Luke et al. 2001; Luo et al. 1998; Phillips and Matheny 1990; Stunkard et al. 1986).
Some of the genetic factors influencing height were found to be the key regulators in the in vivo endocrine systems, such as VDR (vitamin D receptor) (van der Sluis et al. 2003; Xiong et al. 2005a, b) and ER-α (estrogen receptor-alpha) (Schuit et al. 2004). This is expected since bone growth directly associated with final height is influenced by endocrinologic factors (Kronenberg, 2003) such as estrogen (Forriol and Shapiro 2005). Synthetic estrogens have been used to treat abnormal tall stature for many years. In this study, we focused on CYP19 (cytochrome P450 19) gene, which encodes aromatase—a key enzyme catalyzing the in vivo biosynthesis of active estrogens from their lipid precursors (Thompson and Ambrosone 2000; Mitrunen and Hirvonen 2003). We investigated the LD (linkage disequilibrium) patterns and haplotype structures of CYP 19 and then tested the associations between CYP19 with adult height variation using high-density SNPs in 1,873 subjects from 405 nuclear families.
Materials and methods
Subjects
The study was approved by the Creighton University Institutional Review Board. Signed informed-consent documents were obtained from all participants before they entered the study. The subjects were selected from an expanding database created for ongoing studies in the Osteoporosis Research Center (ORC) of Creighton University to search for genes underlying common complex diseases/traits, which were recruited from 1997 to 2003. The detailed design and sampling procedures were published before (Xiong et al. 2005b). In brief, all of the 1,873 participants from 405 nuclear families including 740 parents, 389 male children, and 744 female children were the US Caucasians of European origin and recruited randomly in terms of height variation. Subjects were asked for their age by questionnaire. All height measurements without shoes were made using a standard wall-mounted statiometer in the clinic by nurses. In addition, the average of two repeated measurements for height was used as the final data of height. The basic characteristics of the study subjects are presented in Table 1. For the 405 nuclear families used in association analysis, the average family size was 4.63±1.78 (mean ± SD, Standard Deviation), ranging from 3 to 12. The overall sample yielded a total of 1,512 sib pairs.
Table 1.
Characteristics of study subjects genotyped in 405 nuclear families
| Characteristic | Male subjects (N=749) | Female subjects (N=1,124) |
|---|---|---|
| Mean ± SD | ||
| Height (m) | 1.78±0.07 | 1.64±0.06 |
| Age (years) | 49.23±17.44 | 45.96±15.61 |
Genotyping
Genomic DNA was extracted from whole blood using a commercial isolation kit (Gentra Systems, Minneapolis, MN, USA) following the procedure detailed in the kit. DNA concentration was assessed by a DU530 UV/VIS Spectrophotometer (Beckman Coulter, Inc., Fullerton, CA, USA). SNPs were identified searching through public databases such as dbSNP (http://www.ncbi.nlm.nih.gov/SNP/), JSNP (http://www.snp.ims.u-tokyo.ac.jp/), HGVbase (http://www.hgv-base.cgb.ki.se/), SNP Consortium (TSC) (http://www.snp.cshl.org/) and SNPper (http://www.snpper.chip.org/bio/snpper-enter). A total of 33 SNPs in and around CYP19 were selected on the basis of the following criteria: (1) validation status, especially in Caucasians, (2) an average density of 1 SNP per 4 kb, (3) degree of heterozygosity, i.e., minor allele frequencies (MAF) >0.05, (4) functional relevance and importance, (5) reported to dbSNP by various sources. A total of 31 SNPs were successfully genotyped using the high-throughput BeadArray SNP genotyping technology of Illumina Inc. (San Diego, CA, USA) and 28 were analyzed subsequently (3 rare SNPs were abandoned because of insufficient power to analyze them in association studies). The average rate of missing genotype data was reported by Illumina to be ~0.05%. The average genotyping error rate estimated through blind duplicating was reported to be less than ~0.01%.
Statistical analysis of association
PedCheck (O’Connell and Weeks 1998) was used to check Mendelian inheritance errors of SNP genotype data and any inconsistent genotypes were removed. Then the error checking option embedded in Merlin (Abecasis et al. 2002) was run to identify and disregard the genotypes flanking excessive recombinants, thus further reducing genotyping errors. Less than 11 genotypes were removed due to the violation of any of the above two rules. Allele frequencies for each SNP were calculated by allele counting, and the Hardy–Weinberg equilibrium was tested using the PEDSTATS procedure embedded in Merlin.
Our LD and haplotype analyses were based on the 703 unrelated parents from the 405 nuclear families. The chosen parental group consisted of 340 males and 363 females ranging in age from 40.7 to 87.9 years when recruited. The greater sample size we adopted allowed for more confidence in the dissected LD structures. Population haplotypes and their frequencies were inferred among 703 unrelated parents using PHASE v2.1.1 (Stephens and Scheet 2005). The |D′| for all pairs of SNPs was calculated, and LD block structure was examined by the program GOLD (Abecasis and Cookson 2000). HaploBlockFinder (Zhang and Jin 2003) was used to identify block structures and select haplotype-tagging SNPs (htSNPs) for CYP19. To infer haplotypes defined by the tagging SNPs within each block of CYP19 gene for all of the subjects among 405 families, we adopted the algorithm of integer linear programming (ILP) implemented in PedPhase V2.0 (Li and Jiang 2005), which is based on LD assumption and able to recover phase information at each marker locus with great speed and accuracy even in the presence of 20% missing data.
The quantitative transmission disequilibrium test (QTDT) (Abecasis et al. 2000) and the family-based association test (FBAT) (Horvath et al. 2001) were used to test the tagging SNPs and haplotypes with estimated frequencies greater than 5% for associations with height in all individuals as well as in male and female family members separately. We adopted the orthogonal model implemented in QTDT for our analyses. The orthogonal tests were carried out in a variance component framework decomposing the genotype score into orthogonal between- and within-family components. To avoid potential population stratification, we only performed the within-family association test. Empirical significance levels for the QTDT tests were computed from 1,000 Monte-Carlo permutations, and the empirical threshold was 0.003 for analyses of “all individuals”, 0.004 for analyses of “all females”, and 0.006 for analyses of “all males”, separately. FBAT analyses were performed under the assumption of additive model. The –o flag was used to minimize the variance of the FBAT statistic. All the P values given by FBAT in our study were subject to Bonferroni correction to account for multiple testing, and the significance threshold of a single test was set as 0.05/N, with N being the number of independent markers—namely the number of htSNPs in our case (N=13 as determined by HaploBlockFinder). Thus, the significance level for a single test was determined to be 0.0038 (0.05/13).
The residuals of height adjusted by age and sex in the total sample were calculated by MINITAB (Minitab Inc., State College, PA, USA). In sex-specific analyses, the height residuals of all the females were obtained by adjusting original height data for age, menopause status and the HRT (hormone replacement therapy) use; in the male sample, the height residuals were calculated by adjusting for age. Normality tests for all kinds of height residuals were performed by MINITAB before doing association analyses.
Results
LD and haplotype analyses
The human CYP19 gene is located on chromosome 15q21.2 with the length of ~130 kb. The information of the 28 analyzed SNPs was summarized in Table 2. These SNPs were spaced ~4.6 kb apart on average and covered the full transcript length of CYP19. We identified five LD blocks, which ranged in size from 9 to 34 kb. These blocks can be represented by the 13 htSNPs selected by HaploBlockFinder. SNP 22 had little LD with any other SNPs, and thus cannot be assigned for any of the blocks. Yet we still count SNP 22 as htSNP for simplicity. One to four htSNPs were selected to represent each block (Fig. 1).
Table 2.
Information of the studied SNPs in the CYP19 gene
| SNP Number | dbSNP rs number | SNP | Frequencya | Genomic location (bp) | SNP type |
|---|---|---|---|---|---|
| 1 | rs934632 | A/G | 0.185 | 49283122 | 3′ UTR |
| 2 | rs2255192 | A/G | 0.200 | 49288127 | 3′ UTR |
| 3 | rs2289105 | A/G | 0.473 | 49294800 | Intron7 |
| 4 | rs2899472 | A/C | 0.257 | 49303347 | Intron 4 |
| 5 | rs1065778 | A/G | 0.499 | 49307498 | Intron 3 |
| 6 | rs2414095 | A/G | 0.346 | 49311584 | Intron 3 |
| 7 | rs700518 | A/G | 0.500 | 49316404 | Exon 3 |
| 8 | rs727479 | C/A | 0.350 | 49321839 | Intron 2 |
| 9 | rs17703982 | A/G | 0.054 | 49331651 | Intron 1 |
| 10 | rs12901187 | A/G | 0.429 | 49336829 | Intron 1 |
| 11 | rs17523527 | A/G | 0.443 | 49341324 | Intron 1 |
| 12 | rs749292 | A/G | 0.443 | 49346023 | Intron 1 |
| 13 | rs11636639 | C/A | 0.444 | 49350384 | Intron 1 |
| 14 | rs1902586 | A/G | 0.054 | 49358145 | Intron 1 |
| 15 | rs8029807 | A/G | 0.107 | 49359329 | Intron 1 |
| 16 | rs936307 | A/C | 0.107 | 49367267 | Intron 1 |
| 17 | rs2470176 | G/A | 0.163 | 49371231 | Intron 1 |
| 18 | rs730154 | G/A | 0.166 | 49378496 | Intron 1 |
| 19 | rs16964254 | C/A | 0.058 | 49383073 | Intron 1 |
| 20 | rs10519302 | G/A | 0.060 | 49386975 | Intron 1 |
| 21 | rs16964258 | G/A | 0.060 | 49392700 | Intron 1 |
| 22 | rs3751591 | G/A | 0.163 | 49394002 | Intron 1 |
| 23 | rs1902584 | A/T | 0.071 | 49398946 | Intron 1 |
| 24 | rs2445761 | G/A | 0.424 | 49402908 | Intron 1 |
| 25 | rs2470146 | G/A | 0.056 | 49405661 | Intron 1 |
| 26 | rs2470144 | G/A | 0.465 | 49409017 | Intron 1 |
| 27 | rs1870049 | G/A | 0.110 | 49412515 | Intron 1 |
| 28 | rs6493496 | T/A | 0.254 | 49415411 | Intron 1 |
Allele frequencies for the first allele were shown
Fig. 1.
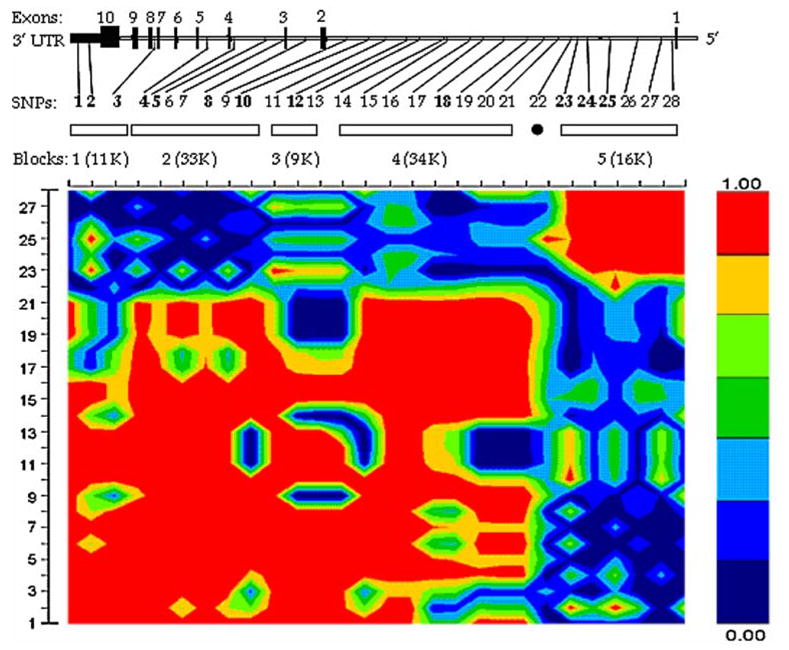
LD structure of CYP19. Blocks with all pair wise |D′| values (0.8 are illustrated and numbered 1–5. SNP IDs correspond to those in Table 2. Haplotype-tagging SNPs (htSNPs) were labeled in bold. SNP 22 had no LD with any of other SNPs and cannot be assigned to any of the blocks
Association analyses
Table 3 presented the SNP-based association results. Thirteen htSNPs (including the ‘orphan’ SNP—SNP 22) were used for SNP-based association analysis. For QTDT analyses, SNP 18 showed significant associations (P=0.003) with adult height in the entire sample (the “All” column in Table 3). When we used P=0.003 as the overall significance level, SNP 18 still remained significant. SNP 18 was also significant in the FBAT analyses (P=0.0016, remaining significant after Bonferroni correction). When sex-specific analyses were conducted, the significant association of SNP 18 with height was still present in women as revealed by both analyses (QTDT P=0.0086; FBAT P=0.0083).
Table 3.
SNP-based association with adult height
| QTDT P valueb |
FBAT P value
|
|||||
|---|---|---|---|---|---|---|
| SNP IDa | All | Male | Female | All | Male | Female |
| 1 | 0.9866 | 0.3464 | 0.8672 | 0.3440 | 0.9962 | 0.2733 |
| 2 | 0.2745 | NA | 0.6304 | 0.2770 | 0.2207 | 0.7721 |
| 3 | 0.5727 | NA | 0.7617 | 0.4111 | 0.5900 | 0.7702 |
| 4 | 0.1186 | NA | 0.3106 | 0.8175 | 0.5473 | 0.6644 |
| 5 | 0.5056 | NA | 0.9886 | 0.2682 | 0.3431 | 0.6045 |
| 8 | 0.7466 | 0.4271 | 0.6590 | 0.3260 | 0.6289 | 0.4467 |
| 10 | 0.330 | NA | 0.2994 | 0.1668 | 0.5998 | 0.3291 |
| 12 | 0.6614 | 0.5993 | 0.3397 | 0.1760 | 0.7021 | 0.2108 |
| 18 | 0.0030* | 0.0310 | 0.0086 | 0.0016** | 0.1615 | 0.0083 |
| 22 | 0.8648 | NA | NA | 0.0562 | 0.0518 | 0.3458 |
| 23 | 0.3927 | 0.5101 | 0.9395 | 0.3597 | 0.1584 | 0.8794 |
| 24 | 0.3127 | NA | 0.1872 | 0.6715 | 0.8826 | 0.4221 |
| 25 | 0.9731 | 0.5817 | 0.7148 | 0.9722 | 0.3183 | 0.2908 |
SNP IDs correspond to those in Table 1. Thirteen htSNPs including SNP22 were used for SNP-based association analysis
P values of within-family association for QTDT test were shown, which were generated by 1,000-permutations. P values (0.05 were in bold, empirical significant P values were indicated by an asterisk (*), and P values significant after Bonferroni correction were indicated by double asterisks (**)
NA cannot be tested, due to too few informative probands
The haplotype association results based on htSNPs were generally consistent with our results of SNP-by-SNP association. We observed significant association (P(0.05) with adult height for block 4 (represented by SNP 18) containing SNPs 14–21, with P values of 0.0247/0.0016 (QTDT/FBAT results) for height variation in the total sample and 0.0253/0.0083 (QTDT/ FBAT results) in the female sample, respectively (Table 4). In addition, we performed the analyses based on the haplotypes constructed by all of the eight SNPs in block 4 using “hbat” command in FBAT analyses. The haplotypes 1 and 2 of block 4 consistently showed significant association signals in the overall and female samples (hap1: P=0.0008 for All, P=0.0017 for Female; hap2: P=0.0274 for All, P=0.0079 for Female). After Bonferroni correction, the haplotype 1 of block 4 remained significant in the overall and female samples.
Table 4.
Haplotype-based association analysis
| QTDT P valuesc |
FBAT P valuesd |
|||||||
|---|---|---|---|---|---|---|---|---|
| Haplotypea | Haplotypeb | Frequency | All | Male | Female | All | Male | Female |
| block4-hap1 | GGCAAAAA | 0.848 | 0.0247 | NA | 0.0253 | 0.0016** (0.0008**) | 0.1615 (0.1799) | 0.0083 (0.0017**) |
| block4-hap2 | GAAGGAAA | 0.104 | 0.0247 | NA | 0.0253 | 0.0016** (0.0274) | 0.1615 (0.9080) | 0.0083 (0.0079) |
Only two common haplotypes (MAF (5%)with significant associations (P(0.05) were shown. All the other haplotypes were rare (MAF (5%) and not associated with height. P values significant after Bonferroni correction were indicated by double asterisks (**)
Only haplotypes with frequencies ≥ were presented. SNP in bold was tag SNP
In QTDT analysis, only htSNPs-based haplotype was analyzed
In FBAT analysis, besides htSNPs-based haplotype analysis, we also performed all-SNP based haplotype analysis using “hbat” command. The results of all-SNP haplotype analysis were showed in brackets
NA cannot be tested due to too few informative probands
Discussion
In present study, we performed both SNP-based analyses and haplotype analyses to assess the association of CYP19 gene with adult height. Recently, Ma et al. (2005) identified genetic polymorphisms in CYP19 by resequencing the exons, exon–intron splice junctions, and a portion of the 3′-untranslated regions. Most of the polymorphisms they observed had not been reported previously thus were not analyzed in the present study.
The five blocks we established for CYP19 were generally comparable with that observed by Haiman et al. (2003). The most significant association between haplotypes and adult height was detected in block 4. Interestingly, Haiman et al. also found significant association with breast cancer in this region. Therefore, it is reasonable to suggest that this region may have pleiotropic effects on various phenotypes. In addition, another marker SNP 17, which belongs to this block, is within a transcription factor binding site revealed by a recently developed web-based Bioinformatics tool (Mapper, http://www.snpper.chip.org/bio/mapper-enter), to which PPARγ (Peroxisomal Proliferator-Activated Receptor-γ) will bind and regulate the transcription of CYP19 (Rubin et al. 2002; Spiegelman 1998). Thus the variations of SNP 17 per se or the functional alleles in strong LD with the SNP 17 allele may influence the CYP19 transcription rate by affecting the binding efficiency of PPARγ. However, the real mechanism underlying the association could be different. Further molecular studies are necessary in this regard.
Sex-specific analyses showed that the associations between SNPs 18 with adult height were mainly driven by female subjects (Table 3). This can be explained from two aspects. First, in the present study, the association tests for height in males were statistically less powerful than those in females because the size of the male sample (n=749) was much smaller than that of the female sample (n=1,124). Second, biological differences exist in terms of height growth between men and women. For instance, the physiology of pubertal growth in females is different from that in males in that the former begins and ends earlier and has a lower peak velocity. And adult height in females could be more influenced by in vivo estrogens due to menarche (Stoll 1998). Therefore, the importance of estrogen-related genes such as CYP19 to height may be more obvious in females.
We used two family-based methods to test associations. QTDT has the advantages of conducting the powerful total association analyses using the entire sample while correcting for internal correlations among all the members, as well as performing within-family association tests that are robust against obvious population stratification. However, QTDT needs to assume that the tested phenotypes are normally distributed. In contrast, FBAT is a nonparametric approach and require no assumptions regarding the trait distribution. Simultaneously, using these two methods enabled us to cross-validate the results and make more reliable conclusions.
Furthermore, we used empirical significance level for QTDT analyses and Bonferroni correction for FBAT to control inflated type I error rate caused by multiple testing. The associations between SNP 18, and the haplotype 1 in block 4 with adult height still remained significant after correcting for multiple testing. We estimated the power of our study sample by the Program Genetic Power Calculator (GPC, http://www.statgen.iop.kcl.ac.uk/gpc/qtlassoc.html) with a conservative significance level of 0.001. Assuming that incomplete LD of |D′| = 0.9; our sample can reach 90 and 80% power in females and males, respectively, under additive models to detect a QTL responsible for about 4% variation of height.
One potential limitation in this study is that some of our adult height data may not represent maximal adult height due to the early loss of height caused by osteopenia, vertebral fractures, loss of intervertebral disc’s turgor and elasticity, and kyphosis. Adjusting height by age may only partly overcome the differences between adult heights of younger and older members of the families. However, due to the lack of data in those aspects, this study represents the best we can do under present conditions.
In summary, our results suggested that the CYP19 gene polymorphisms, especially those in block 4, may be associated with adult height in Caucasians. However, the causal functional variants underlying the associations are unknown, for which further functional studies are required.
Acknowledgments
Investigators of this work were partially supported by grants from NIH (R01 AR050496, K01 AR02170-01, R01 AR45349-01, and R01 GM60402-01A1) and an LB595 grant from the State of Nebraska. The study also benefited from grants from National Science Foundation of China, Huo Ying Dong Education Foundation, HuNan Province, Xi’an Jiaotong University, and the Ministry of Education of China.
Footnotes
Tie-Lin Yang and Dong-Hai Xiong have contributed equally to this work.
References
- Abecasis GR, Cookson WO. GOLD—graphical overview of linkage disequilibrium. Bioinformatics. 2000;16:182–183. doi: 10.1093/bioinformatics/16.2.182. [DOI] [PubMed] [Google Scholar]
- Abecasis GR, Cardon LR, Cookson WO. A general test of association for quantitative traits in nuclear families. Am J Hum Genet. 2000;66:279–292. doi: 10.1086/302698. [DOI] [PMC free article] [PubMed] [Google Scholar]
- Abecasis GR, Cherny SS, Cookson WO, Cardon LR. Merlin—rapid analysis of dense genetic maps using sparse gene flow trees. Nat Genet. 2002;30:97–101. doi: 10.1038/ng786. [DOI] [PubMed] [Google Scholar]
- Carmichael CM, McGue M. A cross-sectional examination of height, weight, and body mass index in adult twins. J Gerontol A Biol Sci Med Sci. 1995;50:B237–B244. doi: 10.1093/gerona/50a.4.b237. [DOI] [PubMed] [Google Scholar]
- Forriol F, Shapiro F. Bone development: interaction of molecular components and biophysical forces. Clin Orthop Relat Res. 2005;(432):14–33. [PubMed] [Google Scholar]
- Forsen T, Eriksson J, Qiao Q, Tervahauta M, Nissinen A, Tuomilehto J. Short stature and coronary heart disease: a 35-year follow-up of the Finnish cohorts of The Seven Countries Study. J Intern Med. 2000;248:326–332. doi: 10.1046/j.1365-2796.2000.00747.x. [DOI] [PubMed] [Google Scholar]
- Giovannucci E, Rimm EB, Stampfer MJ, Colditz GA, Willett WC. Height, body weight, and risk of prostate cancer. Cancer Epidemiol Biomarkers Prev. 1997;6:557–563. [PubMed] [Google Scholar]
- Haiman CA, Stram DO, Pike MC, Kolonel LN, Burtt NP, Altshuler D, Hirschhorn J, Henderson BE. A comprehensive haplotype analysis of CYP19 and breast cancer risk: the Multiethnic Cohort. Hum Mol Genet. 2003;12:2679–2692. doi: 10.1093/hmg/ddg294. [DOI] [PubMed] [Google Scholar]
- Hebert PR, Ajani U, Cook NR, Lee IM, Chan KS, Hennekens CH. Adult height and incidence of cancer in male physicians (United States) Cancer Causes Control. 1997;8:591–597. doi: 10.1023/a:1018442329319. [DOI] [PubMed] [Google Scholar]
- Hemenway D, Feskanich D, Colditz GA. Body height and hip fracture: a cohort study of 90,000 women. Int J Epidemiol. 1995;24:783–786. doi: 10.1093/ije/24.4.783. [DOI] [PubMed] [Google Scholar]
- Horvath S, Xu X, Laird NM. The family based association test method: strategies for studying general genotype–phenotype associations. Eur J Hum Genet. 2001;9:301–306. doi: 10.1038/sj.ejhg.5200625. [DOI] [PubMed] [Google Scholar]
- Kronenberg HM. Developmental regulation of the growth plate. Nature. 2003;423:332–336. doi: 10.1038/nature01657. [DOI] [PubMed] [Google Scholar]
- Lawlor DA, Ebrahim S, Davey SG. The association between components of adult height and Type II diabetes and insulin resistance: British Women’s Heart and Health Study. Diabetologia. 2002;45:1097–1106. doi: 10.1007/s00125-002-0887-5. [DOI] [PubMed] [Google Scholar]
- Li J, Jiang T. Computing the minimum recombinant haplotype configuration from incomplete genotype data on a pedigree by integer linear programming. J Comput Biol. 2005;12:719–739. doi: 10.1089/cmb.2005.12.719. [DOI] [PubMed] [Google Scholar]
- Luke A, Guo X, Adeyemo AA, Wilks R, Forrester T, Lowe W, Jr, Comuzzie AG, Martin LJ, Zhu X, Rotimi CN, Cooper RS. Heritability of obesity-related traits among Nigerians, Jamaicans and US black people. Int J Obes Relat Metab Disord. 2001;25:1034–1041. doi: 10.1038/sj.ijo.0801650. [DOI] [PubMed] [Google Scholar]
- Luo ZC, Albertsson-Wikland K, Karlberg J. Target height as predicted by parental heights in a population-based study. Pediatr Res. 1998;44:563–571. doi: 10.1203/00006450-199810000-00016. [DOI] [PubMed] [Google Scholar]
- Ma CX, Adjei AA, Salavaggione OE, Coronel J, Pelleymounter L, Wang L, Eckloff BW, Schaid D, Wieben ED, Adjei AA, Weinshilboum RM. Human aromatase: gene rese-quencing and functional genomics. Cancer Res. 2005;65:11071–11082. doi: 10.1158/0008-5472.CAN-05-1218. [DOI] [PubMed] [Google Scholar]
- Mitrunen K, Hirvonen A. Molecular epidemiology of sporadic breast cancer. The role of polymorphic genes involved in oestrogen biosynthesis and metabolism. Mutat Res. 2003;544:9–41. doi: 10.1016/s1383-5742(03)00016-4. [DOI] [PubMed] [Google Scholar]
- O’Connell JR, Weeks DE. PedCheck: a program for identification of genotype incompatibilities in linkage analysis. Am J Hum Genet. 1998;63:259–266. doi: 10.1086/301904. [DOI] [PMC free article] [PubMed] [Google Scholar]
- Phillips K, Matheny AP., Jr Quantitative genetic analysis of longitudinal trends in height: preliminary results from the Louisville Twin Study. Acta Genet Med Gemellol (Roma) 1990;39:143–163. doi: 10.1017/s0001566000005389. [DOI] [PubMed] [Google Scholar]
- Rubin GL, Duong JH, Clyne CD, Speed CJ, Murata Y, Gong C, Simpson ER. Ligands for the peroxisomal proliferator-activated receptor gamma and the retinoid X receptor inhibit aromatase cytochrome P450 (CYP19) expression mediated by promoter II in human breast adipose. Endocrinology. 2002;143:2863–2871. doi: 10.1210/endo.143.8.8932. [DOI] [PubMed] [Google Scholar]
- Schuit SC, van Meurs JB, Bergink AP, van der Kliff M, Fang Y, Leusink G, Hofman A, Van Leeuwen JP, Uitterlinden AG, Pols HA. Height in pre- and postmenopausal women is influenced by estrogen receptor alpha gene polymorphisms. J Clin Endocrinol Metab. 2004;89:303–309. doi: 10.1210/jc.2003-031095. [DOI] [PubMed] [Google Scholar]
- van der Sluis IM, de Muinck Keizer-Schrama SM, Krenning EP, Pols HA, Uitterlinden AG. Vitamin D receptor gene polymorphism predicts height and bone size, rather than bone density in children and young adults. Calcif Tissue Int. 2003;73:332–338. doi: 10.1007/s00223-002-2130-2. [DOI] [PubMed] [Google Scholar]
- Spiegelman BM. PPAR-gamma: adipogenic regulator and thiazolidinedione receptor. Diabetes. 1998;47:507–514. doi: 10.2337/diabetes.47.4.507. [DOI] [PubMed] [Google Scholar]
- Stephens M, Scheet P. Accounting for decay of linkage disequilibrium in haplotype inference and missing-data imputation. Am J Hum Genet. 2005;76:449–462. doi: 10.1086/428594. [DOI] [PMC free article] [PubMed] [Google Scholar]
- Stoll BA. Western diet, early puberty, and breast cancer risk. Breast Cancer Res Treat. 1998;49:187–193. doi: 10.1023/a:1006003110909. [DOI] [PubMed] [Google Scholar]
- Stunkard AJ, Foch TT, Hrubec Z. A twin study of human obesity. JAMA. 1986;256:51–54. [PubMed] [Google Scholar]
- Thompson PA, Ambrosone C. Molecular epidemiology of genetic polymorphisms in estrogen metabolizing enzymes in human breast cancer. J Natl Cancer Inst Monogr. 2000;(27):125–134. doi: 10.1093/oxfordjournals.jncimonographs.a024235. [DOI] [PubMed] [Google Scholar]
- Xiong DH, Xu FH, Liu PY, Shen H, Long JR, Elze L, Recker RR, Deng HW. Vitamin D receptor gene polymorphisms are linked to and associated with adult height. J Med Genet. 2005a;42:228–234. doi: 10.1136/jmg.2004.024083. [DOI] [PMC free article] [PubMed] [Google Scholar]
- Xiong DH, Liu YZ, Liu PY, Zhao LJ, Deng HW. Association analysis of estrogen receptor alpha gene polymorphisms with cross-sectional geometry of the femoral neck in Caucasian nuclear families. Osteoporos Int. 2005b;16:2113–2122. doi: 10.1007/s00198-005-2011-4. [DOI] [PubMed] [Google Scholar]
- Zhang K, Jin L. HaploBlockFinder: haplotype block analyses. Bioinformatics. 2003;19:1300–1301. doi: 10.1093/bioinformatics/btg142. [DOI] [PubMed] [Google Scholar]